. 2023 Dec;12(2):2275606.
doi: 10.1080/22221751.2023.2275606. Epub 2023 Nov 15.

PLK3 facilitates replication of swine influenza virus by phosphorylating viral NP protein

Affiliations

PLK3 facilitates replication of swine influenza virus by phosphorylating viral NP protein

Caiyue Ren et al. Emerg Microbes Infect. 2023 Dec.

Abstract

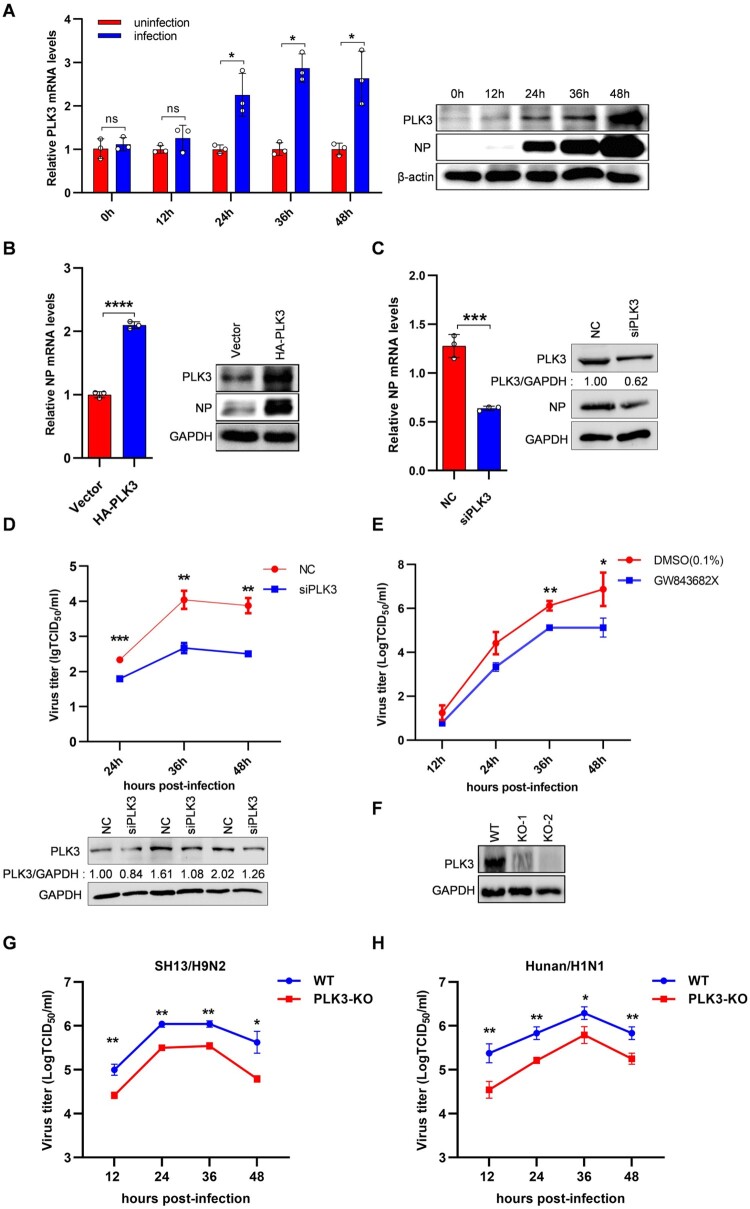
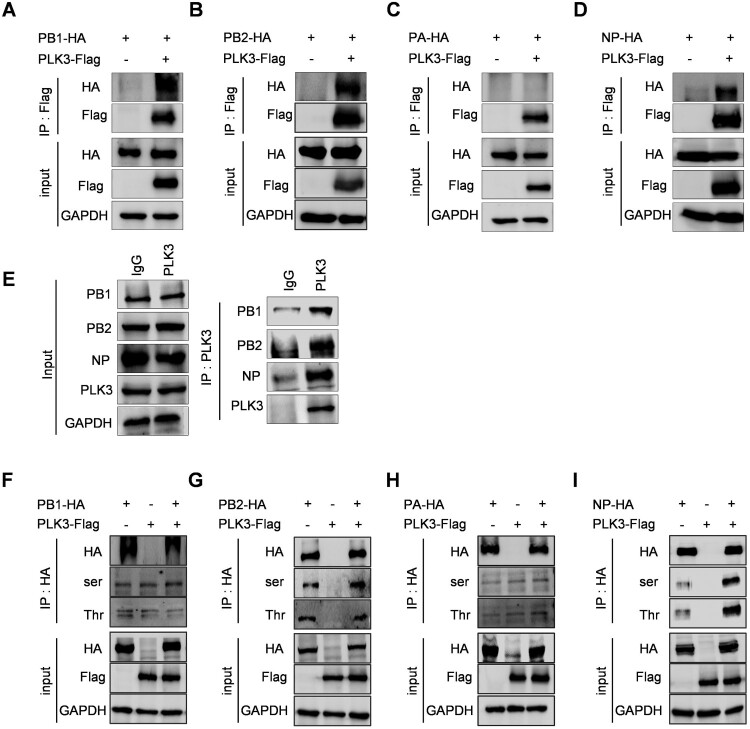
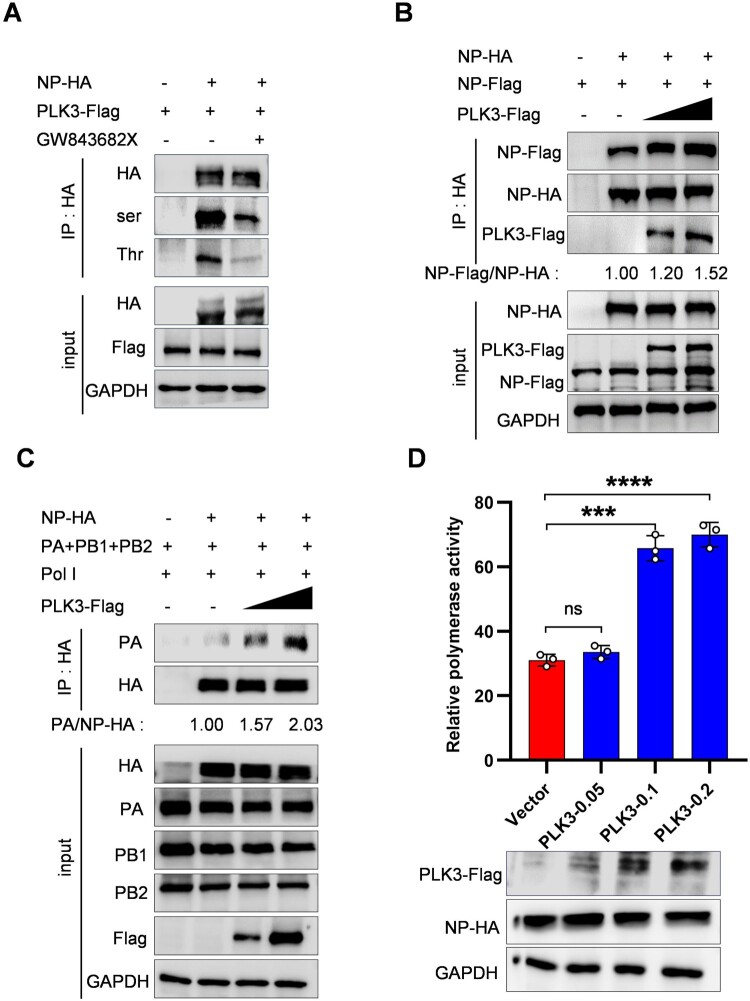
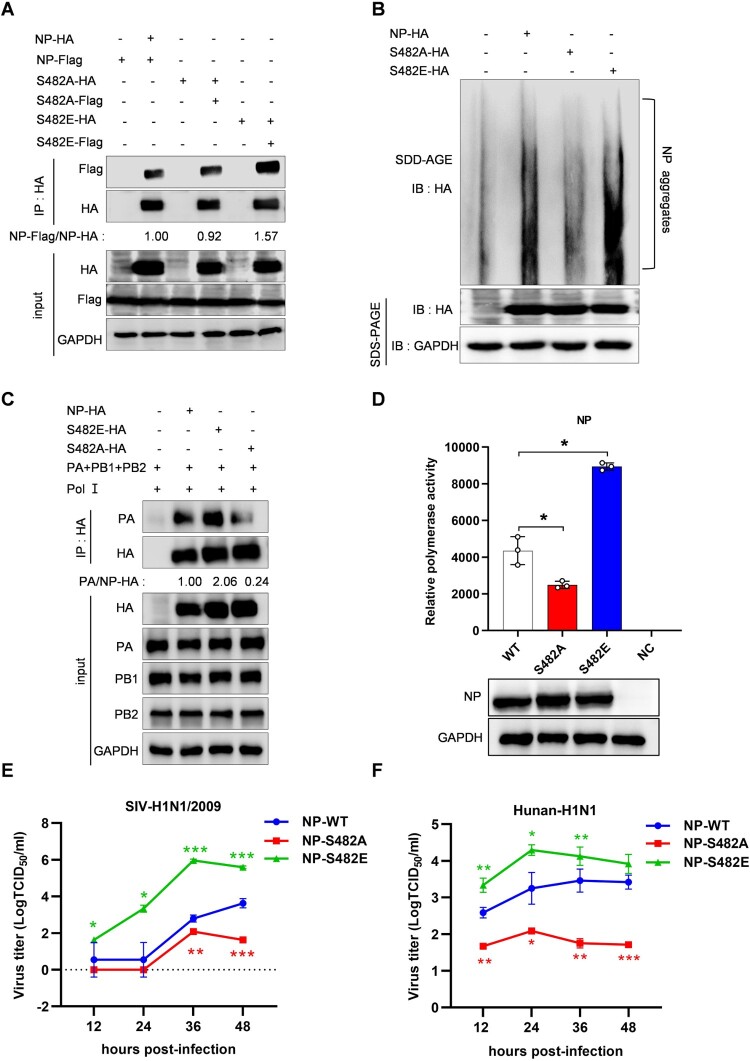
Swine H1N1/2009 influenza is a highly infectious respiratory disease in pigs, which poses a great threat to pig production and human health. In this study, we investigated the global expression profiling of swine-encoded genes in response to swine H1N1/2009 influenza A virus (SIV-H1N1/2009) in newborn pig trachea (NPTr) cells. In total, 166 genes were found to be differentially expressed (DE) according to the gene microarray. After analyzing the DE genes which might affect the SIV-H1N1/2009 replication, we focused on polo-like kinase 3 (PLK3). PLK3 is a member of the PLK family, which is a highly conserved serine/threonine kinase in eukaryotes and well known for its role in the regulation of cell cycle and cell division. We validated that the expression of PLK3 was upregulated after SIV-H1N1/2009 infection. Additionally, PLK3 was found to interact with viral nucleoprotein (NP), significantly increased NP phosphorylation and oligomerization, and promoted viral ribonucleoprotein assembly and replication. Furthermore, we identified serine 482 (S482) as the phosphorylated residue on NP by PLK3. The phosphorylation of S482 regulated NP oligomerization, viral polymerase activity and growth. Our findings provide further insights for understanding the replication of influenza A virus.

Keywords: PLK3; Swine influenza virus; nucleoprotein; phosphorylation; virus replication.


Conflict of interest statement

No potential conflict of interest was reported by the author(s).

Figures

Figure 1.
Figure 1.
PLK3 promoted SIV-H1N1/2009 replication. (A) PLK3 was upregulated after SIV-H1N1/2009 infection. NPTr cells were uninfected or infected with SIV-H1N1/2009 at a MOI of 0.01 and harvested at 0, 12, 24, 36, and 48 h postinfection, respectively. The mRNA levels of PLK3 were determined by qRT-PCR and normalized to GAPDH. All results were standardized to 1 in uninfected cells for each time point. The protein levels of PLK3 were determined by western blotting and normalized to β-actin. (B) Effects of PLK3 overexpression on NP. NPTr cells were transfected with pCAGGS-HA-PLK3 for 24 h, then infected with SIV-H1N1/2009 at a MOI of 0.01 for 36 h. The mRNA levels and protein levels of viral NP were respectively measured by qRT-PCR and western blotting, and normalized to GAPDH. (C) Effects of siPLK3 on NP. NPTr cells were transfected with siPLK3 for 24 h, then infected with SIV-H1N1/2009 at a MOI of 0.01 for 36 h. The mRNA levels and protein levels of viral NP were respectively measured by qRT-PCR and western blotting, and normalized to GAPDH. (D) The growth curves of SIV-H1N1/2009 in NPTr cells after siPLK3 treated. NPTr cells were transfected with siPLK3 or negative control (NC), then infected with SIV-H1N1/2009 at a MOI of 0.01. Cell supernatants were collected at 24, 36, and 48 h post-infection. The virus titres were assessed by TCID50 assays on PK-15 cells. The protein levels of PLK3 at different time points were measured by western blotting. (E) The growth curves of SIV-H1N1/2009 in PK-15 cells after PLK3 inhibitor (GW843682X) treated. PK-15 cells were treated with GW843682X (10 µM) or DMSO (0.1%) for 2 h, then infected with SIV-H1N1/2009 at a MOI of 0.01. Cell supernatants were collected at 12, 24, 36, and 48 h postinfection. The virus titres were assessed by TCID50 assays on MDCK cells. Data were shown as means ± standard deviations (n = 3). Statistical significance was analyzed by Student's t-test, * p < 0.05, ** p < 0.01, ns represented no significance. (F) PK-15- PLK3-KO- cell lines were obtained by using the CRISPR/Cas9 system. The PLK3-knockout effects were measured by western blotting. (G) The growth curves of SH13/H9N2 in PK-15 cells. PK-15 WT cell line and PLK3-KO cell line were infected with SH13/H9N2 virus at a MOI of 0.01. Cell supernatants were collected at 12, 24, 36, and 48 h post-infection. The virus titres were assessed by TCID50 assays on PK-15 cells. (H) The growth curves of Hunan/H1N1 in PK-15 cells. PK-15 WT cell line and PLK3-KO cell line were infected with Hunan/H1N1 virus at a MOI of 0.01. Cell supernatants were collected at 12, 24, 36, and 48 h post-infection. The virus titres were assessed by TCID50 assays on PK-15 cells.
Figure 2.
Figure 2.
PLK3 interacted with NP and promoted NP phosphorylation. (A, B, C, and D) Interactions between PLK3 and viral RNP components. The expression plasmid of PLK3-Flag was respectively cotransfected with PB1-HA (A), PB2-HA (B), PA-HA (C), or NP-HA (D) in HEK293T cells. The cell lysates were collected at 24 h post-transfection. Co-IP assays were performed using an anti-Flag antibody to precipitate viral RNP components which interacted with PLK3, followed by western blotting to detect PLK3 using an anti-Flag antibody and PB1, PB2, PA, and NP using an anti-HA antibody. GAPDH served as a loading control in all of these experiments. (E) Interactions between endogenous PLK3 and viral RNP components in the context of viral infections. NPTr cells were infected with SIV-H1N1/2009 at a MOI of 0.01. The cell lysates were collected at 24 h post-infection. Co-IP assays were performed using anti-IgG and anti-PLK3 antibodies to precipitate viral RNP components which interacted with PLK3, followed by western blotting to detect PLK3 using an anti-PLK3 antibody and PB1, PB2, PA, and NP using endogenous antibodies. GAPDH served as a loading control in all of these experiments. (F, G, H, and I) Effects of PLK3 on the phosphorylation of viral RNP components. The expression plasmid of PLK3-Flag was respectively cotransfected with PB1-HA (F), PB2-HA (G), PA-HA (H), or NP-HA (I) in HEK293T cells. The cell lysates were collected at 24 h posttransfection, then, PB1-HA, PB2-HA, PA-HA, and NP-HA were immunoprecipitated with an anti-HA antibody, and the associated phosphorylated serine/threonine of PB1, PB2, PA, and NP were detected using anti-p-serine/threonine antibodies. GAPDH served as a loading control in all of these experiments.
Figure 3.
Figure 3.
PLK3 promoted NP oligomerization, vRNP assembly and viral polymerase activity. (A) PLK3 inhibitor (GW843682X) blocked NP phosphorylation. The expression plasmid of NP-HA was co-transfected with PLK3-Flag in HEK293T cells with or without GW843682X treatment for 2 h posttransfection. Co-IP assays were performed using an anti-HA antibody. The phosphorylated serine/threonine of NP were detected by western blotting with an anti-p-serine/threonine antibodies, and the total NP was detected with an anti-HA antibody. (B) The effect of PLK3 on NP oligomerization. Expression plasmids of PLK3-Flag (0, 0.5, and 1 µg), NP-Flag and NP-HA were cotransfected in HEK293T cells which were then lysed at 24 h posttransfection. Co-IP was performed using an anti-HA antibody followed by western blotting. The band intensities were quantified by ImageJ, and the relative precipitated NP-Flag/NP-HA ratios were shown below. (C) The effect of PLK3 on vRNP assembly. HEK293T cells were transfected with the vRNP reconstitution plasmids (pCDNA-PA, pCDNA-PB1, pCDNA-PB2, pCAGGS-HA-NP), and pPol I plasmid together with PLK3-Flag (0, 0.5, and 1 µg). Cells were then lysed at 24 h post-transfection. Co-IP was performed using an anti-HA antibody followed by western blotting. The band intensities were quantified by ImageJ, and the relative precipitated PA/NP-HA ratios were shown below. GAPDH was used as a loading control in all of these experiments. (D) The effect of PLK3 on viral polymerase activity. HEK293T cells were transfected with plasmids (pCDNA-PA, pCDNA-PB1, pCDNA-PB2, pCAGGS-HA-NP), pPolI-firefly and Renilla luciferase expression plasmids along with Flag-PLK3 (0.05, 0.1 and 0.2 µg or vector). The luciferase activity was measured at 24 h after the transfection. The proteins expression of NP and PLK3 were detected by western blotting. GAPDH was used as a control. Data were shown as means ± standard deviations (n = 3). Statistical significance was analyzed by Student's t-test, * p < 0.05, ** p < 0.01, ns represented no significance.
Figure 4.
Figure 4.
Identification of phosphorylation sites of PLK3 in NP. (A) The consensus sequence of PLK3 phosphorylation. The NP S467 and S482 sites were correspondent with the consensus sequence. (B and C) Residues S467 and S482 are highly conserved among different species of H1N1 influenza A viruses. The sequence alignments of avian, human, and swine H1N1 influenza A viruses were performed and analyzed by MegAlign. (D) Effects of PLK3 on S467 and S482 phosphorylation of NP. The expression plasmid of PLK3-Flag was co-transfected with NP-HA or NP mutants (NP S467A and NP S482A) in HEK293T cells. Co-IP assays were performed using an anti-HA antibody. The phosphorylated serine of NP was detected by western blotting with anti-p-Ser antibody, and the total NP was detected with an anti-HA antibody. GAPDH served as a loading control (left). The band intensities were quantified by ImageJ, and the grayscale values of each experiment was statistically analyzed by Graphpad (right, n = 3).
Figure 5.
Figure 5.
Effects of NP S482 phosphorylation on SIV-H1N1/2009 replication. (A) The effect of NP S482 phosphorylation on NP oligomerization. HEK293T cells were co-transfected with HA-tagged and Flag-tagged expression plasmids of NP or its mutants (NP S482A and NP S482E), then cell lysates were collected at 24 h post-transfection. Co-IP assay was performed using an anti-HA antibody followed by western blotting. The band intensities were quantified by ImageJ, and the relative precipitated NP-Flag (NP-Flag/NP-HA) were shown below. (B) SDD-AGE analysis of NP oligomerization. HEK293T cells were transfected with indicated plasmids for 24 h, cell lysates were analyzed by SDD-AGE and SDS-PAGE assays. (C) The effect of NP S482 on vRNP assembly. HEK293T cells were co-transfected with the vRNP reconstitution plasmids (pCDNA-PA, pCDNA-PB1, pCDNA-PB2) and tagged plasmid (NP-HA or its mutants NP S482E-HA, NP S482A-HA) and p-Pol I plasmid that to provide vRNAs. Cells were then lysed at 24 h posttransfection. Co-IP was performed using an anti-HA antibody followed by western blotting. The band intensities were quantified by ImageJ, and the relative precipitated PA/NP-HA or PA/NP S482 A/E-HA ratios were shown below. GAPDH was used as a loading control in all of these experiments. (D) The effect of NP S482 phosphorylation on viral polymerase activity. HEK293T cells were cotransfected with the vRNP expression plasmids (pCDNA-PA, pCDNA-PB1, pCDNA-PB2), tagged plasmid (NP-HA or its mutants NP S482A-HA, NP S482E-HA), pPolI-firefly and Renilla luciferase expression plasmids. The luciferase activity was measured at 24 h after the transfection. The luciferase activities of vRNPs containing NP mutants were compared with that generated by the vRNP containing WT NP. (E and F) The effects of NP S482 phosphorylation on virus growth. The recombinant viruses including wild-type (WT) NP and NP mutants (NP S482A and NP S482E) from SIV-H1N1/2009 or Hunan-H1N1/2015 were generated, then infected PK-15 cells at a MOI of 0.01. Cell supernatants were collected at 12, 24, 36, and 48 h postinfection. Virus titres were determined by TCID50 on PK-15 cells. Statistical significance was analyzed by Student's t-test, * p < 0.05, ** p < 0.01, *** p < 0.001, ns represented no significance.
Figure 6.
Figure 6.
NP S482 phosphorylation on SIV-H1N1/2009 alters virus pathogenicity in mice. (A and B) Weight loss and mortality of mice infected with each indicated virus. Body weights of the NP-WT and mutant groups were compared and statistically analyzed. Error bars represent means ± SEM (n = 10). Statistical analysis was used by two-tailed analysis of variance with Bonferroni post test. (C) Virus titres in the lungs of infected mice (n = 3) at 3 and 5 days post-infection. Error bars represent means ± SD. Statistical analysis was performed by using one-tailed method (ND, Not detected; ***, p < 0.001). (D) Pathological lesions in the lungs of mice infected with the indicated virus at 3 and 5 days postinfection with haematoxylin and eosin (H&E) staining. Scale bars, 100 μm. (E) Immunofluorescent staining of lung sections of mice infected with the indicated PBS or virus at 3 and 5 dpi. The viral NP antigen was stained red and the nucleus was stained blue. Scale bars, 100 μm.
Figure 7.
Figure 7.
Summary. PLK3 as a novel positive regulator of influenza A virus and can promote virus replication. Further mechanism revealed that PLK3 can interact with NP and promote NP phosphorylation, thereby promoting NP oligomerization and vRNP assembly. More importantly, we identified a PLK3-targeted NP-specific phosphorylation site S482, the phosphorylation of S482 is vital of importance for influenza virus replication both in vitro and in vivo.

References

    1. Ma W, Richt JA.. Swine influenza vaccines: current status and future perspectives. Anim Health Res Rev. 2010 Jun;11(1):81–96. doi:10.1017/S146625231000006X - DOI - PubMed
    1. Torremorell M, Allerson M, Corzo C, et al. . Transmission of influenza A virus in pigs. Transbound Emerg Dis. 2012 Mar;59(1):68–84. doi:10.1111/j.1865-1682.2011.01300.x - DOI - PubMed
    1. Hao L, Sakurai A, Watanabe T, et al. . Drosophila RNAi screen identifies host genes important for influenza virus replication. Nature. 2008 Aug 14;454(7206):890–893. doi:10.1038/nature07151 - DOI - PMC - PubMed
    1. Brass AL, Huang IC, Benita Y, et al. . The IFITM proteins mediate cellular resistance to influenza A H1N1 virus, West Nile virus, and dengue virus. Cell. 2009 Dec 24;139(7):1243–1254. doi:10.1016/j.cell.2009.12.017 - DOI - PMC - PubMed
    1. Shapira SD, Gat-Viks I, Shum BO, et al. . A physical and regulatory map of host-influenza interactions reveals pathways in H1N1 infection. Cell. 2009 Dec 24;139(7):1255–1267. doi:10.1016/j.cell.2009.12.018 - DOI - PMC - PubMed