. 2024 Jan 2;84(1):26-38.
doi: 10.1158/0008-5472.CAN-23-1362.

Cell State of Origin Impacts Development of Distinct Endometriosis-Related Ovarian Carcinoma Histotypes

Affiliations

Cell State of Origin Impacts Development of Distinct Endometriosis-Related Ovarian Carcinoma Histotypes

Ian Beddows et al. Cancer Res. .

Abstract

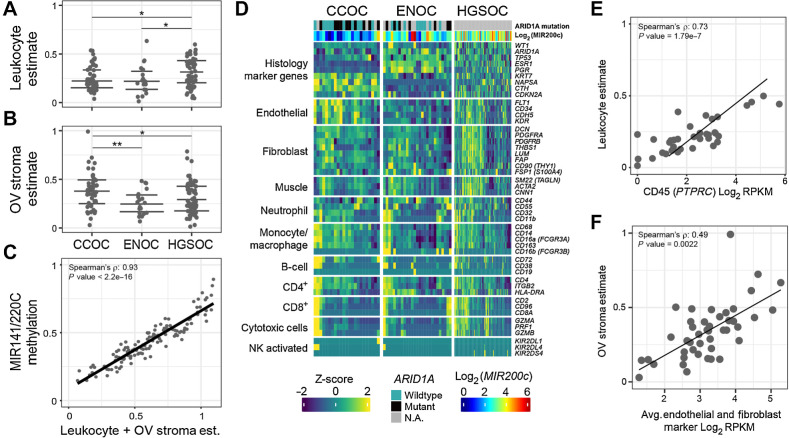
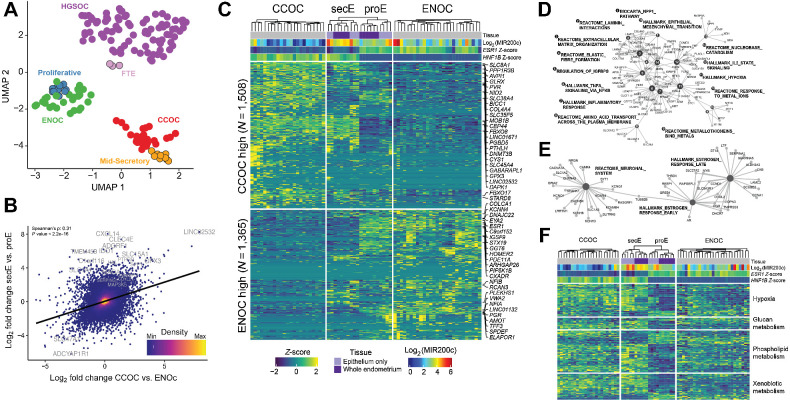
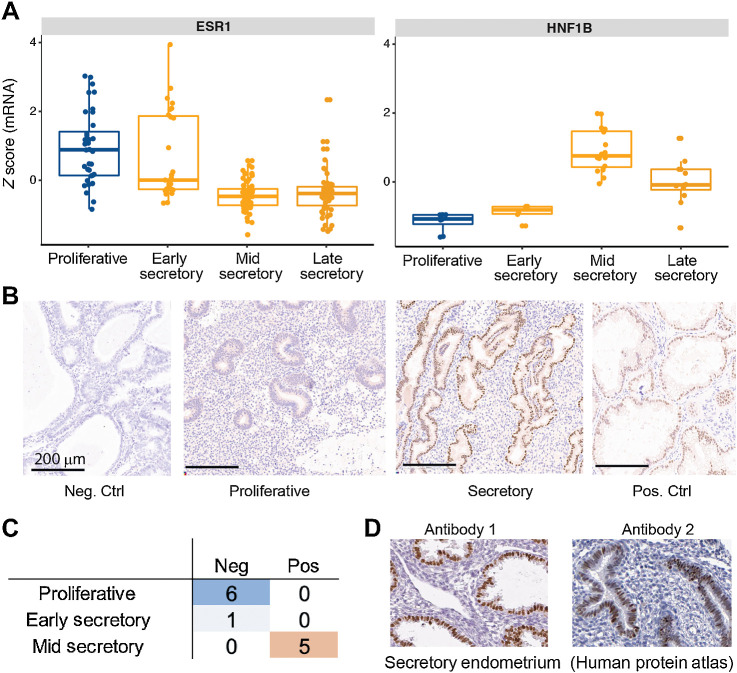
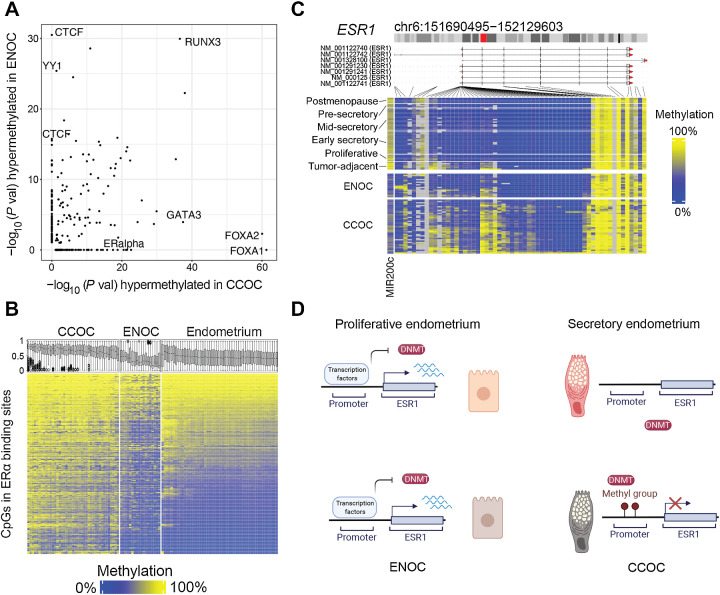
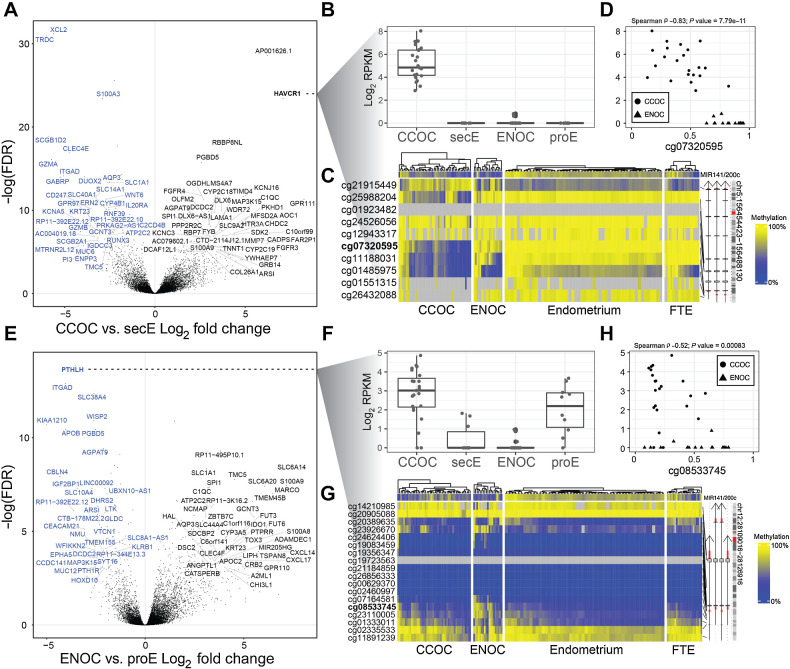
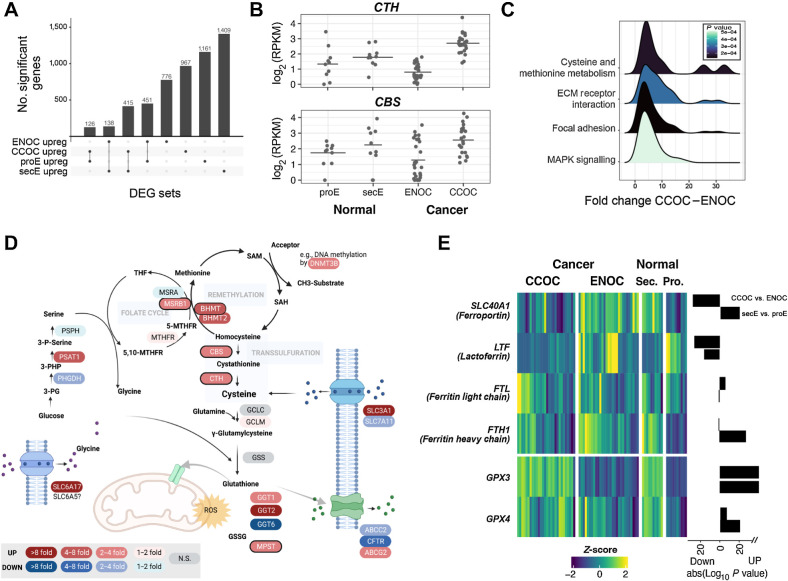
Clear cell ovarian carcinoma (CCOC) and endometrioid ovarian carcinoma (ENOC) are ovarian carcinoma histotypes, which are both thought to arise from ectopic endometrial (or endometrial-like) cells through an endometriosis intermediate. How the same cell type of origin gives rise to two morphologically and biologically different histotypes has been perplexing, particularly given that recurrent genetic mutations are common to both and present in nonmalignant precursors. We used RNA transcription analysis to show that the expression profiles of CCOC and ENOC resemble those of normal endometrium at secretory and proliferative phases of the menstrual cycle, respectively. DNA methylation at the promoter of the estrogen receptor (ER) gene (ESR1) was enriched in CCOC, which could potentially lock the cells in the secretory state. Compared with normal secretory-type endometrium, CCOC was further defined by increased expression of cysteine and glutathione synthesis pathway genes and downregulation of the iron antiporter, suggesting iron addiction and highlighting ferroptosis as a potential therapeutic target. Overall, these findings suggest that while CCOC and ENOC arise from the same cell type, these histotypes likely originate from different cell states. This "cell state of origin" model may help to explain the presence of histologic and molecular cancer subtypes arising in other organs.

Significance: Two cancer histotypes diverge from a common cell of origin epigenetically locked in different cell states, highlighting the importance of considering cell state to better understand the cell of origin of cancer.


Figures

Figure 1. Quality control of samples used in this study. A–C, Cellular composition and tumor purity estimation from DNA methylation with three orthogonal methods. A, Estimate of immune cell fraction with leukocyte-specific DNA methylation signature for the OV histotypes (see Materias and Methods). Y-axis indicates the estimated leukocyte proportion of each sample, with samples divided by subtype on the x-axis. Significance level: *, P ≤ 0.05; **, P ≤ 0.01. Horizontal lines denote the first quantile, median, and third quantile. B, Estimate of ovarian stroma-like component fraction (y-axis), with tissue-specific methylation signature (see Materials and Methods). C, Total mesenchymal fraction estimated by DNA methylation β values at the polycistronic MIR141/200C promoter (y-axis) is highly correlated with the sum (x-axis) of leukocyte fraction (A) and stroma fraction (B). D, RNA-seq shows histotype and cellular composition differences by expression of known marker genes for various cell populations. Color represents the Z-score of counts per million for marker genes (rows) across samples (columns). Samples are clustered within each histotype and genes are clustered within each marker category indicated on the left of the heatmap. Canonical histotype markers are plotted as controls (top). E, DNA methylation–based leukocyte estimates from A (y-axis) correlate to PTPRC mRNA expression for samples, with matching RNA-seq and methylation data. F, As in E, but with ovarian stroma estimate from DNA methylation (y-axis) and the RNA-seq stroma markers (x-axis).
Figure 1.
Quality control of samples used in this study. A–C, Cellular composition and tumor purity estimation from DNA methylation with three orthogonal methods. A, Estimate of immune cell fraction with leukocyte-specific DNA methylation signature for the OV histotypes (see Materias and Methods). Y-axis indicates the estimated leukocyte proportion of each sample, with samples divided by subtype on the x-axis. Significance level: *, P ≤ 0.05; **, P ≤ 0.01. Horizontal lines denote the first quantile, median, and third quantile. B, Estimate of ovarian stroma-like component fraction (y-axis), with tissue-specific methylation signature (see Materials and Methods). C, Total mesenchymal fraction estimated by DNA methylation β values at the polycistronic MIR141/200C promoter (y-axis) is highly correlated with the sum (x-axis) of leukocyte fraction (A) and stroma fraction (B). D, RNA-seq shows histotype and cellular composition differences by expression of known marker genes for various cell populations. Color represents the Z-score of counts per million for marker genes (rows) across samples (columns). Samples are clustered within each histotype and genes are clustered within each marker category indicated on the left of the heatmap. Canonical histotype markers are plotted as controls (top). E, DNA methylation–based leukocyte estimates from A (y-axis) correlate to PTPRC mRNA expression for samples, with matching RNA-seq and methylation data. F, As in E, but with ovarian stroma estimate from DNA methylation (y-axis) and the RNA-seq stroma markers (x-axis).
Figure 2. CCOC and ENOC resemble different phases of normal cyclic endometrium based on gene expression profile. A, RNA-seq UMAP shows tumors clustering by histotype and with putative corresponding normal cell(s) of origin. Each dot represents a sample, with colors indicating sample type. B, Globally, CCOC–ENOC expression differences for all genes (log2-fold change, x-axis) are positively correlated with fold change between secretory and proliferative endometrium (y-axis). Top 20 DEGs by P value for secE versus proE are labeled. C, Significant DEGs between CCOC and ENOC also separate endometrium of different phases (FDR <0.05 and absolute fold change >2). Each row represents a DEG and each column a sample. Both rows and columns are clustered by Euclidian distance after first grouping by fold change sign (rows) as well as into CCOC, ENOC, and endometrium (columns). Note that secE and proE separate perfectly based on CCOC versus ENOC DEGs. Gene expression (Log2 RPKM) is row normalized into Z-scores, capped at ±2. The 25 most up- and downregulated genes by P value are labeled. D, Gene-concept network plot showing enriched molecular pathways for genes upregulated in both CCOC relative to ENOC and secE relative to proE. Numbered nodes represent pathways, with DEGs in that pathway connected to the corresponding node. The size of each node is scaled on the basis of the number of overlapped DEGs in that pathway. E, As in D, but for pathways enriched in genes overexpressed in ENOC relative to CCOC and proE relative to secE. F, CCOC and ENOC share key metabolic pathways with secE and proE, respectively. Color of the heatmap represents Z-score as in C for genes (rows) from four pathways significantly overrepresented in DEGs between secretory and proliferative endometrium.
Figure 2.
CCOC and ENOC resemble different phases of normal cyclic endometrium based on gene expression profile. A, RNA-seq UMAP shows tumors clustering by histotype and with putative corresponding normal cell(s) of origin. Each dot represents a sample, with colors indicating sample type. B, Globally, CCOC–ENOC expression differences for all genes (log2-fold change, x-axis) are positively correlated with fold change between secretory and proliferative endometrium (y-axis). Top 20 DEGs by P value for secE versus proE are labeled. C, Significant DEGs between CCOC and ENOC also separate endometrium of different phases (FDR <0.05 and absolute fold change >2). Each row represents a DEG and each column a sample. Both rows and columns are clustered by Euclidian distance after first grouping by fold change sign (rows) as well as into CCOC, ENOC, and endometrium (columns). Note that secE and proE separate perfectly based on CCOC versus ENOC DEGs. Gene expression (Log2 RPKM) is row normalized into Z-scores, capped at ±2. The 25 most up- and downregulated genes by P value are labeled. D, Gene-concept network plot showing enriched molecular pathways for genes upregulated in both CCOC relative to ENOC and secE relative to proE. Numbered nodes represent pathways, with DEGs in that pathway connected to the corresponding node. The size of each node is scaled on the basis of the number of overlapped DEGs in that pathway. E, As in D, but for pathways enriched in genes overexpressed in ENOC relative to CCOC and proE relative to secE. F, CCOC and ENOC share key metabolic pathways with secE and proE, respectively. Color of the heatmap represents Z-score as in C for genes (rows) from four pathways significantly overrepresented in DEGs between secretory and proliferative endometrium.
Figure 3. Validation of HNF1B expression in normal mid-secretory endometrium. A, Expression z-scores averaged from all probes for ESR1 and HNF1B on an external microarray-based dataset (GSE4888), validating expression of HNF1B in mid-to-late secretory phase. B, IHC staining of endometrium at various menstrual cycle phases for HNF1B. Control specimens used are tissues from endometrioid endometrial carcinoma (negative) and clear cell carcinoma of the ovary (positive) that have been previously described as being negative or positive for HNF1B (respectively). These were rerun in the same experimental lot as endometrium samples. Note that stromal cells further serve as internal negative control in the CCOC control specimen as staining is restricted to nuclei of tumor epithelium. C, Tabulation of HNF1B IHC results from a panel of 12 normal endometrium samples shows segregation by menstrual cycle phase. D, HNF1B IHC results from Human Protein Atlas, with two different antibodies, for two normal endometrium samples at the secretory phase showing strong staining for HNF1B.
Figure 3.
Validation of HNF1B expression in normal mid-secretory endometrium. A, Expression z-scores averaged from all probes for ESR1 and HNF1B on an external microarray-based dataset (GSE4888), validating expression of HNF1B in mid-to-late secretory phase. B, IHC staining of endometrium at various menstrual cycle phases for HNF1B. Control specimens used are tissues from endometrioid endometrial carcinoma (negative) and clear cell carcinoma of the ovary (positive) that have been previously described as being negative or positive for HNF1B (respectively). These were rerun in the same experimental lot as endometrium samples. Note that stromal cells further serve as internal negative control in the CCOC control specimen as staining is restricted to nuclei of tumor epithelium. C, Tabulation of HNF1B IHC results from a panel of 12 normal endometrium samples shows segregation by menstrual cycle phase. D, HNF1B IHC results from Human Protein Atlas, with two different antibodies, for two normal endometrium samples at the secretory phase showing strong staining for HNF1B.
Figure 4. Epigenetic differences between CCOC and ENOC reveal how cell state differences are propagated through mitosis. A, −Log10 (P value) for TFBS enrichment for probes hypermethylated in ENOC compared with CCOC (y-axis) and CCOC compared with ENOC (x-axis). Each dot represents a TFBS region set. Labels are shown for region sets related to chromatin architecture (enriched for hypermethylation in ENOC) and those related to estrogen signaling (enriched for hypermethylation in CCOC). B, Heatmap of probes (rows) overlapping ERα TFBSs sorted by average methylation in endometrium. Boxplots show the methylation distribution for these probes for samples (columns). CCOC shows gain of methylation at ERα binding sites compared with normal endometrium. C, In addition, the promoter of ERα’s encoding gene, ESR1, gains methylation in CCOC at most probes around the transcription start site; ESR1 transcription start site is unmethylated in normal endometrium. D, A model for ESR1 promoter methylation in normal endometrium and tumors. In normal endometrium, regardless of the phase, the ESR1 promoter is unmethylated, which allows for cyclic modulation by transcription factors through normal monthly cycling. In the cell of origin of CCOC, which is likely secretory endometrium-like, ESR1 is not expressed, and DNA methylation can accumulate stochastically and then become clonally expanded.
Figure 4.
Epigenetic differences between CCOC and ENOC reveal how cell state differences are propagated through mitosis. A, −Log10 (P value) for TFBS enrichment for probes hypermethylated in ENOC compared with CCOC (y-axis) and CCOC compared with ENOC (x-axis). Each dot represents a TFBS region set. Labels are shown for region sets related to chromatin architecture (enriched for hypermethylation in ENOC) and those related to estrogen signaling (enriched for hypermethylation in CCOC). B, Heatmap of probes (rows) overlapping ERα TFBSs sorted by average methylation in endometrium. Boxplots show the methylation distribution for these probes for samples (columns). CCOC shows gain of methylation at ERα binding sites compared with normal endometrium. C, In addition, the promoter of ERα’s encoding gene, ESR1, gains methylation in CCOC at most probes around the transcription start site; ESR1 transcription start site is unmethylated in normal endometrium. D, A model for ESR1 promoter methylation in normal endometrium and tumors. In normal endometrium, regardless of the phase, the ESR1 promoter is unmethylated, which allows for cyclic modulation by transcription factors through normal monthly cycling. In the cell of origin of CCOC, which is likely secretory endometrium-like, ESR1 is not expressed, and DNA methylation can accumulate stochastically and then become clonally expanded.
Figure 5. Comparison with matched normal yields cancer-specific alterations. A, Volcano plot showing gene expression alterations between CCOC and secE. X-axis is log2-fold change and y-axis is negative log10-transformed FDR. Top ranked DEGs are labeled in black (upregulated in CCOC relative to secE) and blue (downregulated). B, HAVCR1 is expressed only in CCOC samples; lines indicate first quartile, median, and third quartile. C, HAVCR1 shows demethylation in three probes near the transcription start site in CCOC samples only. D, For samples with matched expression and methylation data, HAVCR1 expression corresponds to methylation at the transcription start site as illustrated by the probe cg07320595. E, As in A, but for ENOC vs. proE. F, Expression by sample group boxplots for PTHLH showing that this gene is downregulated in ENOC relative to proE but upregulated in CCOC relative to secE. These demonstrate that using a matched normal is critical because the merged signals from whole endometrium without regard to phase would obscure the change in ENOC relative to its putative cell state of origin. G, Methylation at the PTHLH gene shows some hypermethylation at the transcription start site in ENOC, but this does not fully explain the expression. H, As in D but for PTHLH. Athough expression is significantly associated with methylation at the transcription start site probe cg08533745, it does not seem to fully explain suppressed expression of PTHLH in ENOC samples.
Figure 5.
Comparison with matched normal yields cancer-specific alterations. A, Volcano plot showing gene expression alterations between CCOC and secE. X-axis is log2-fold change and y-axis is negative log10-transformed FDR. Top ranked DEGs are labeled in black (upregulated in CCOC relative to secE) and blue (downregulated). B,HAVCR1 is expressed only in CCOC samples; lines indicate first quartile, median, and third quartile. C,HAVCR1 shows demethylation in three probes near the transcription start site in CCOC samples only. D, For samples with matched expression and methylation data, HAVCR1 expression corresponds to methylation at the transcription start site as illustrated by the probe cg07320595. E, As in A, but for ENOC vs. proE. F, Expression by sample group boxplots for PTHLH showing that this gene is downregulated in ENOC relative to proE but upregulated in CCOC relative to secE. These demonstrate that using a matched normal is critical because the merged signals from whole endometrium without regard to phase would obscure the change in ENOC relative to its putative cell state of origin. G, Methylation at the PTHLH gene shows some hypermethylation at the transcription start site in ENOC, but this does not fully explain the expression. H, As in D but for PTHLH. Athough expression is significantly associated with methylation at the transcription start site probe cg08533745, it does not seem to fully explain suppressed expression of PTHLH in ENOC samples.
Figure 6. CCOC–ENOC differences beyond proEM–secEM differences highlight alterations in cysteine/methionine biogenesis and iron metabolism. A, Overlap of genes upregulated in ENOC (relative to CCOC), CCOC (relative to ENOC), proEM (relative to secEM), and secEM (relative to proEM) showing the shared gene sets used for enrichment testing. B, CTH and CBS are two highly differentially expressed genes between ENOC and CCOC, whereas not different between two phases of normal endometrium. C, Distribution of fold changes for genes in the four significantly enriched KEGG pathways upregulated in CCOC. D, Cysteine synthesis pathway with the fold change between CCOC and ENOC indicated for each expressed gene. E, Heatmap of iron and ferroptosis-related genes showing Z-score and absolute log10 (P value) for CCOC vs. ENOC and secEM vs. proEM, with direction indicated as a barplot on the right of the heatmap.
Figure 6.
CCOC–ENOC differences beyond proEM–secEM differences highlight alterations in cysteine/methionine biogenesis and iron metabolism. A, Overlap of genes upregulated in ENOC (relative to CCOC), CCOC (relative to ENOC), proEM (relative to secEM), and secEM (relative to proEM) showing the shared gene sets used for enrichment testing. B,CTH and CBS are two highly differentially expressed genes between ENOC and CCOC, whereas not different between two phases of normal endometrium. C, Distribution of fold changes for genes in the four significantly enriched KEGG pathways upregulated in CCOC. D, Cysteine synthesis pathway with the fold change between CCOC and ENOC indicated for each expressed gene. E, Heatmap of iron and ferroptosis-related genes showing Z-score and absolute log10 (P value) for CCOC vs. ENOC and secEM vs. proEM, with direction indicated as a barplot on the right of the heatmap.

References

    1. Hoadley KA, Yau C, Hinoue T, Wolf DM, Lazar AJ, Drill E, et al. Cell-of-origin patterns dominate the molecular classification of 10,000 tumors from 33 types of cancer. Cell 2018;173:291–304. - PMC - PubMed
    1. Visvader JE. Cells of origin in cancer. Nature 2011;469:314–22. - PubMed
    1. Karnezis AN, Cho KR, Gilks CB, Pearce CL, Huntsman DG. The disparate origins of ovarian cancers: pathogenesis and prevention strategies. Nat Rev Cancer 2017;17:65–74. - PubMed
    1. Kobel M, Kalloger SE, Boyd N, McKinney S, Mehl E, Palmer C, et al. Ovarian carcinoma subtypes are different diseases: implications for biomarker studies. PLoS Med 2008;5:e232. - PMC - PubMed
    1. Shen H, Fridley BL, Song H, Lawrenson K, Cunningham JM, Ramus SJ, et al. Epigenetic analysis leads to identification of HNF1B as a subtype-specific susceptibility gene for ovarian cancer. Nat Commun 2013;4:1628. - PMC - PubMed

Publication types