Comment
. 2024 Jan;27(1):72-85.
doi: 10.1007/s10120-023-01436-8. Epub 2023 Oct 24.

Stroma AReactive Invasion Front Areas (SARIFA) proves prognostic relevance in gastric carcinoma and is based on a tumor-adipocyte interaction indicating an altered immune response

Affiliations
Comment

Stroma AReactive Invasion Front Areas (SARIFA) proves prognostic relevance in gastric carcinoma and is based on a tumor-adipocyte interaction indicating an altered immune response

Bianca Grosser et al. Gastric Cancer. 2024 Jan.

Abstract

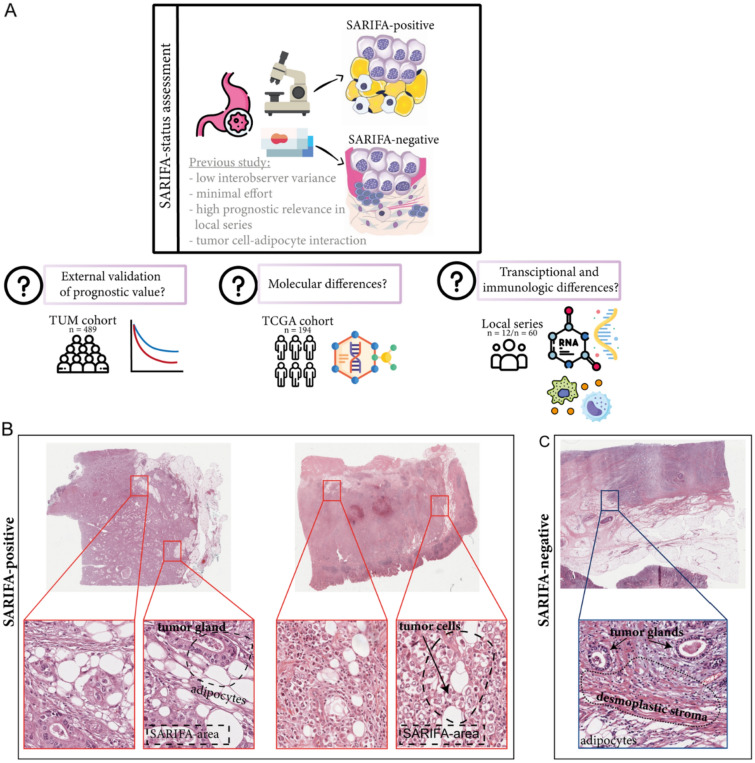
Background: Recently, we presented Stroma AReactive Invasion Front Areas (SARIFA) as a new histomorphologic negative prognostic biomarker in gastric cancer. It is defined as direct contact between tumor cells and fat cells. The aim of this study was to further elucidate the underlying genomic, transcriptional, and immunological mechanisms of the SARIFA phenomenon.

Methods: To address these questions, SARIFA was classified on H&E-stained tissue sections of three cohorts: an external cohort (n = 489, prognostic validation), the TCGA-STAD cohort (n = 194, genomic and transcriptomic analysis), and a local cohort (n = 60, digital spatial profiling (whole transcriptome) and double RNA in situ hybridization/immunostaining of cytokines).

Results: SARIFA status proved to be an independent negative prognostic factor for overall survival in an external cohort of gastric carcinomas. In TCGA-STAD cohort, SARIFA is not driven by distinct genomic alterations, whereas the gene expression analyses showed an upregulation of FABP4 in SARIFA-positive tumors. In addition, the transcriptional regulations of white adipocyte differentiation, triglyceride metabolism, and catabolism were upregulated in pathway analyses. In the DSP analysis of SARIFA-positive tumors, FABP4 and the transcriptional regulation of white adipocyte differentiation were upregulated in macrophages. Additionally, a significantly lower expression of the cytokines IL6 and TNFα was observed at the invasion front.

Conclusions: SARIFA proves to be a strong negative prognostic biomarker in advanced gastric cancer, implicating an interaction of tumor cells with tumor-promoting adipocytes with crucial changes in tumor cell metabolism. SARIFA is not driven by tumor genetics but is very likely driven by an altered immune response as a causative mechanism.

Keywords: Biomarker; Gastric cancer; Histopathology; Molecular mechanisms; Stroma Areactive Invasion Front Areas (SARIFA).


Conflict of interest statement

BM has received compensations of travel expenses and fees for advisory board activities by Astra Zeneca, Boehringer Ingelheim, MERCK, MSD, BMS, Bayer, and Novartis, not related to this study. The other authors declare no potential conflicts of interest.

Figures

Fig. 1
Fig. 1
A Overview of the study design with results of previous studies and study aims. B, C Hematoxylin & Eosin-stained images of SARIFA-positive and SARIFA-negative cases of the TCGA-STAD cohort. B SARIFA-positive cancers of TCGA-STAD patients showing tumor cells directly adjacent to adipocytes without a stromal reaction. C SARIFA-negative cancer from a TCGA-STAD patient treated by surgery alone showing a desmoplastic reaction between tumor and fat at the invasion front
Fig. 2
Fig. 2
SARIFA and Survival: A Kaplan–Meier analysis of all TUM patients shows that patients with SARIFA-negative tumors have a significantly better survival (HR 1.498, 95% CI (1.156–1.940), p = 0.002). B Forest Plot of multivariate Cox Regression analysis including SARIFA status and known prognostic factors C Kaplan–Meier analysis of TUM patients treated with neoadjuvant chemotherapy shows that patient with SARIFA-negative tumor have a significantly better survival (HR 1.644, 95% CI (1.207–2.239), p = 0.002) D Kaplan–Meier analysis of TUM patients treated by surgery alone suggests improved survival in patients with SARIFA-negative tumors. However, the difference is statistically not significant (HR 1.425, 95% CI (0.882–2.302, p = 0.148) E Kaplan–Meier analysis of pT3 TUM patients shows that patient with SARIFA-negative tumor have a significantly better survival (HR 1.582, 95% CI (1.122–2.230), p = 0.009) F Kaplan–Meier analysis of pT4 TUM patients shows no significant survival difference of patients regarding SARIFA (HR 1.064, 95% CI (0.679–1.166), p = 0.788)
Fig. 3
Fig. 3
A Genomic analysis in the TCGA-STAD cohort: Oncoprint of top mutated genes for SARIFA-graded patients. Genes with mutations or CNVs in 15% of patients were included in the oncoprint. Genetic alterations were annotated from the OncoKB database. Samples are first split by SARIFA-class and then ordered based on the mutation occurrence. Genes are ordered by the occurrence frequency in the cohort. B Recurring genomic alterations are not exclusive to SARIFA groups. Comparison of percentage of samples with genomic alterations (SNVs, CNVs, SVs) in each SARIFA group. Only genomic alterations found in at least 10% of samples are shown. C Frequency of the most common genetic alterations in SARIFA and non-SARIFA samples
Fig. 4
Fig. 4
Bulk-transcriptome-analysis TCGA-STAD cohort. A Results of the differential expression analysis with DESeq2 between SARIFA and non-SARIFA samples. X-axis shows the Log2 fold change between the groups, y-axis, the –log10 of the adjusted p value from DESeq2. The dotted lines show Log2 fold change and adjusted p value thresholds at abs(2) and 0.05, respectively. B Results from GSEA from SARIFA vs non-SARIFA differential expression analysis. (left) Enrichments in MsigDB C2 Reactome gene sets; (right) Enrichments in MsigDB Hallmark gene sets. C Gene Expression heatmap of differentially expressed genes between SARIFA and non-SARIFA samples. Gene expression values were normalized with DESeq2 and then z-score transformed. The sample annotation rows illustrate various metadata parameters from TCGA-STAD cohort. Rows and Columns were clustered using Euclidean distance metric and Ward’s clustering. D Violin plot of normalized FABP4 expression in the TCGA-STAD cohort stratified by SARIFA status. Expression values are normalized with DEseq2's vst. E FAPB4 expression contrasting samples by Lauren's criteria classification, further stratified by SARIFA classification status. Expression values are normalized with DEseq2's vst. F Correlation between FABP4 normalized gene expression and Stromal score calculated for each sample. Correlation metric is Pearson’s correlation
Fig. 5
Fig. 5
Digital spatial profiling analysis in CD68 + cells and Stroma: A Overview (scale bar 300 µm; ROIs chosen for multiplex profiling) and magnification (scale bar 100 µm; SARIFA area annotated) of a fluorescence image of a TMA core of an exemplary SARIFA-positive tumor visualizing the tumor cells, CD68 + cells and stroma. Within each region of interest, segmentation into different compartments is performed using CD68 fluorescent staining patterns as a mask to profile expression in CD68 + cells. B Volcano plot of the differential expression analysis in CD68 + cells between SARIFA-positive and negative samples. X-axis shows the Log2 fold change between the groups, y-axis the–log10 of the p value. The dotted lines show Log2 fold change and p value thresholds at abs(1) and 0.01, respectively. FABP4 is differentially upregulated in CD68 + cell in SARIFA-positive cases. C Overview (scale bar 300µm; ROIs chosen for multiplex profiling) and magnification (scale bar 100 µm) of a fluorescence image of a TMA core of an exemplary SARIFA-negative tumor visualizing the tumor cells, CD68 + cells and stroma. Within each region of interest, segmentation into different compartments is performed using ckpan fluorescent staining patterns as a mask to profile expression in the stroma component (ckpan negative). D Volcano plot of the differential expression analysis in the stroma between SARIFA-positive and negative samples. X-axis shows the Log2 fold change between the groups, y-axis the –log1010 of the p value. The dotted lines show Log2 fold change and p value thresholds at abs(1) and 0·01, respectively
Fig. 6
Fig. 6
RNA Scope analysis: A Comparison of IL6, TNFα, IL10 and IL12 expression in regard to SARIFA status in the tumor center, invasion front, adipocytes and endothelium. P-values adjusted for multiple testing. B Comparison of macrophage count shows no difference in SARIFA-negative and -positive tumors in the tumor center and at the invasion front. C Double in situ hybridization/immunostaining images showing expression of TNFα and IL6 in brown as DAB-signal and CD68 + cells in red as fast-red signal (overview 400x; inserts 700x). C1 a-f TNFα signal in tumor cells, C1 g CD68 + cells showing red staining and brown TNFα signal C1 h-i TNFα signal in spindle-like cells. C2 a IL6 expression in endothelia of small capillaries, C2 b adipocytes, and C2 c spindle-like cells (most likely fibroblasts)

Comment on

References

    1. Sung H, Ferlay J, Siegel RL, Laversanne M, Soerjomataram I, Jemal A, Bray F. Global cancer statistics 2020: GLOBOCAN estimates of incidence and mortality worldwide for 36 cancers in 185 countries. CA Cancer J Clin. 2021;71:209–249. doi: 10.3322/caac.21660. - DOI - PubMed
    1. Network CGAR. Comprehensive molecular characterization of gastric adenocarcinoma. Nature. 2014;513:202. doi: 10.1038/nature13480. - DOI - PMC - PubMed
    1. Cristescu R, Lee J, Nebozhyn M, Kim KM, Ting JC, Wong SS, Liu J, Yue YG, Wang J, Yu K, et al. Molecular analysis of gastric cancer identifies subtypes associated with distinct clinical outcomes. Nat Med. 2015;21:449–456. doi: 10.1038/nm.3850. - DOI - PubMed
    1. Martin B, Grosser B, Kempkens L, Miller S, Bauer S, Dhillon C, Banner BM, Brendel EM, Sipos E, Vlasenko D, et al. Stroma AReactive Invasion Front Areas (SARIFA)-a new easily to determine biomarker in colon cancer-results of a retrospective study. Cancers (Basel) 2021 doi: 10.3390/cancers13194880. - DOI - PMC - PubMed
    1. Grosser B, Gluckstein MI, Dhillon C, Schiele S, Dintner S, VanSchoiack A, Kroeppler D, Martin B, Probst A, Vlasenko D, et al. Stroma AReactive Invasion Front Areas (SARIFA) - a new prognostic biomarker in gastric cancer related to tumor-promoting adipocytes. J Pathol. 2022;256:71–82. doi: 10.1002/path.5810. - DOI - PubMed