. 2023 Oct 24:12:e87098.
doi: 10.7554/eLife.87098.

Genome-wide screen reveals Rab12 GTPase as a critical activator of Parkinson's disease-linked LRRK2 kinase

Affiliations

Genome-wide screen reveals Rab12 GTPase as a critical activator of Parkinson's disease-linked LRRK2 kinase

Herschel S Dhekne et al. Elife. .

Abstract

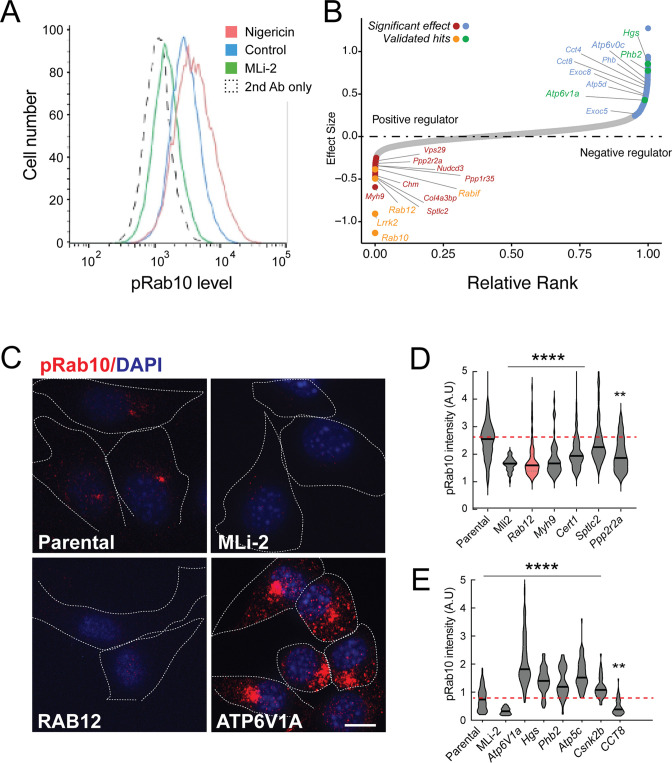
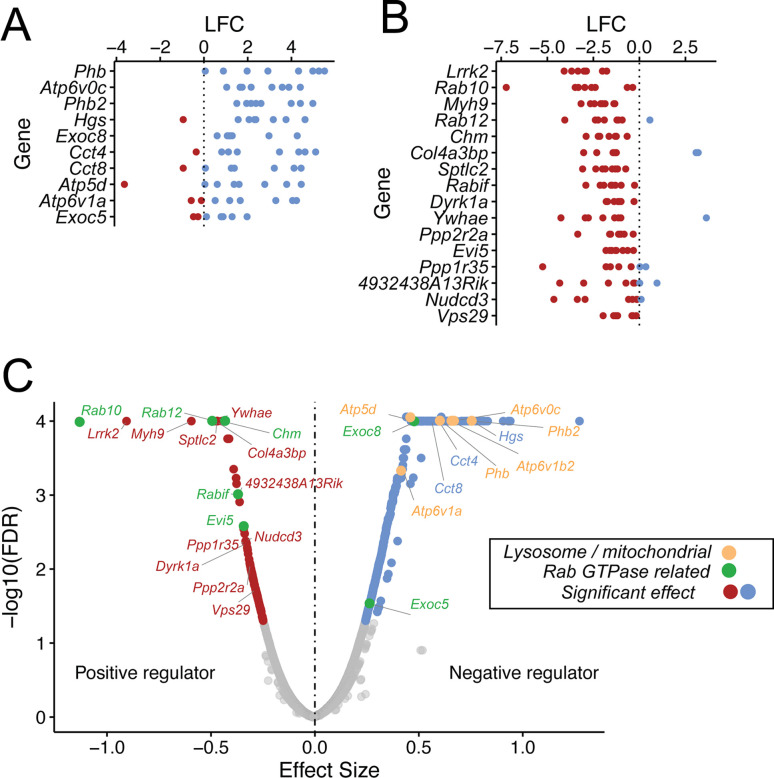
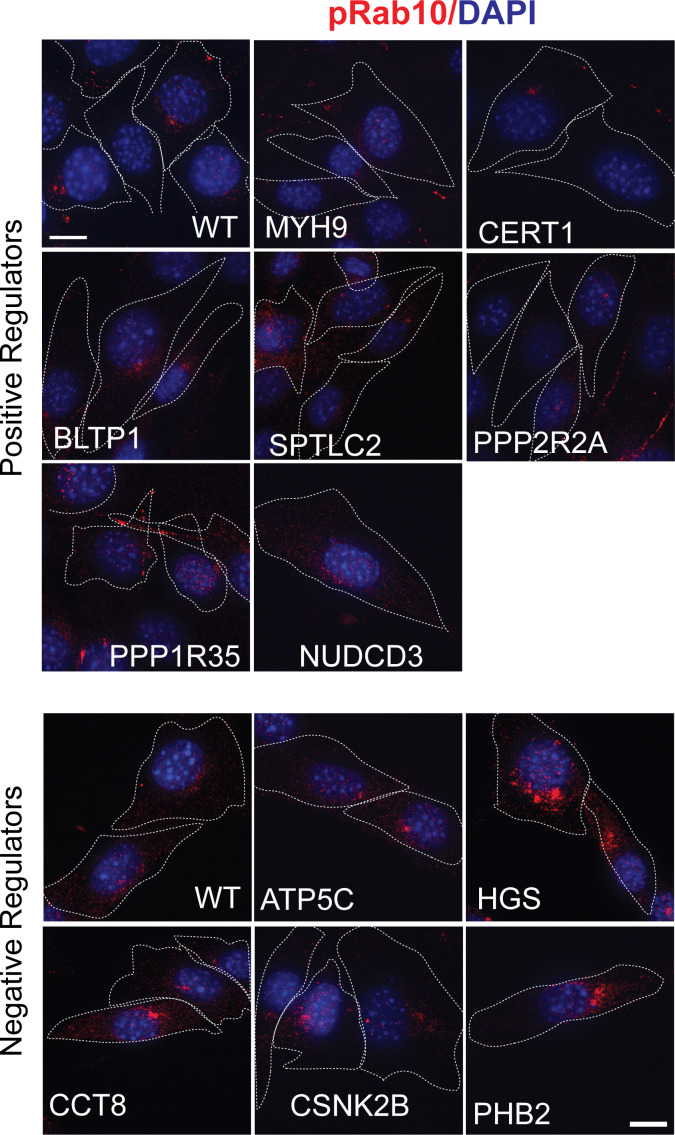
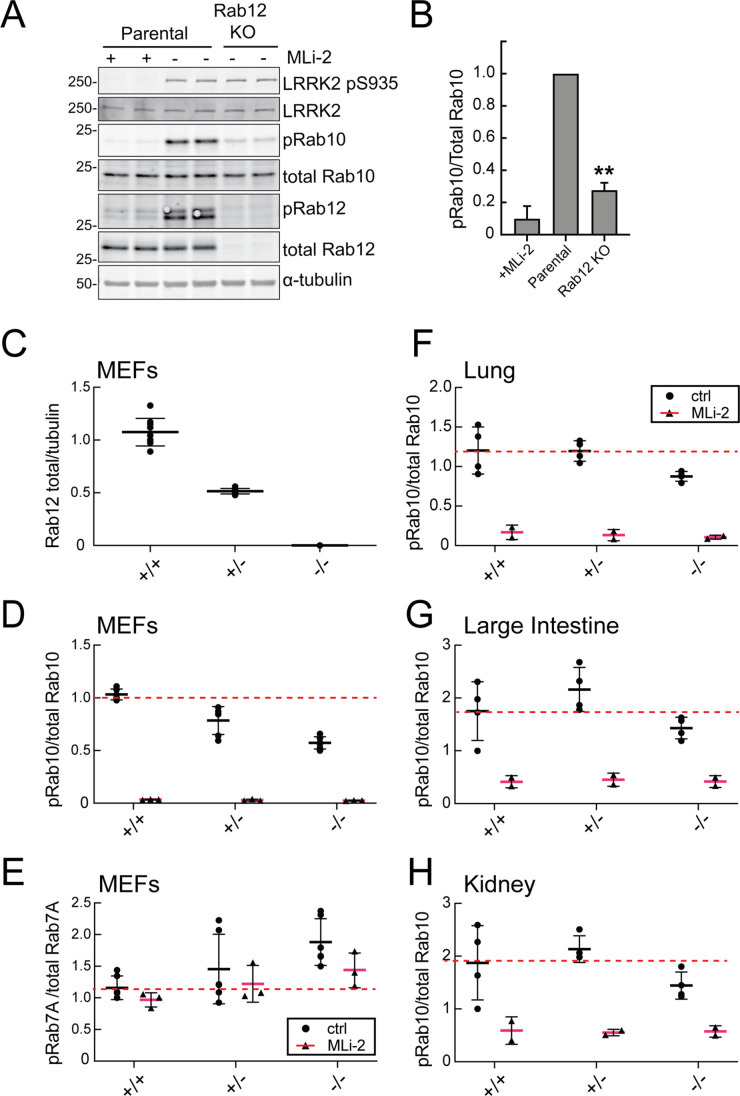
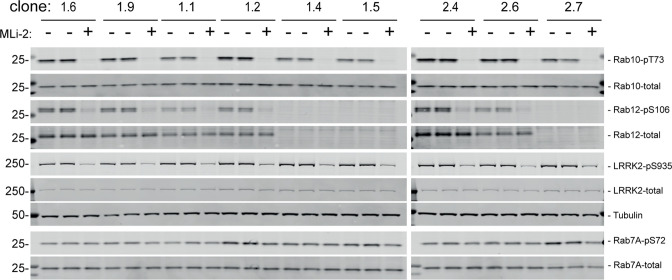
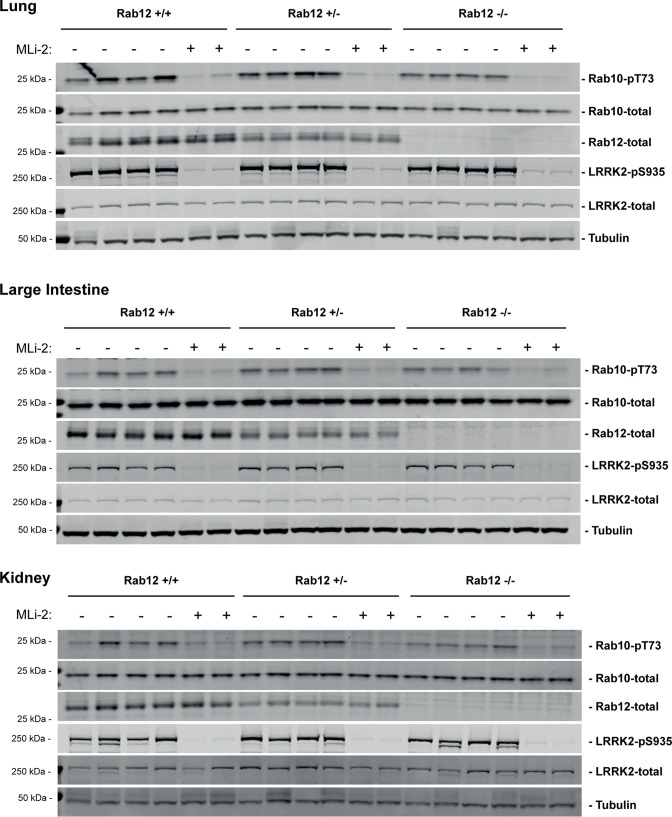
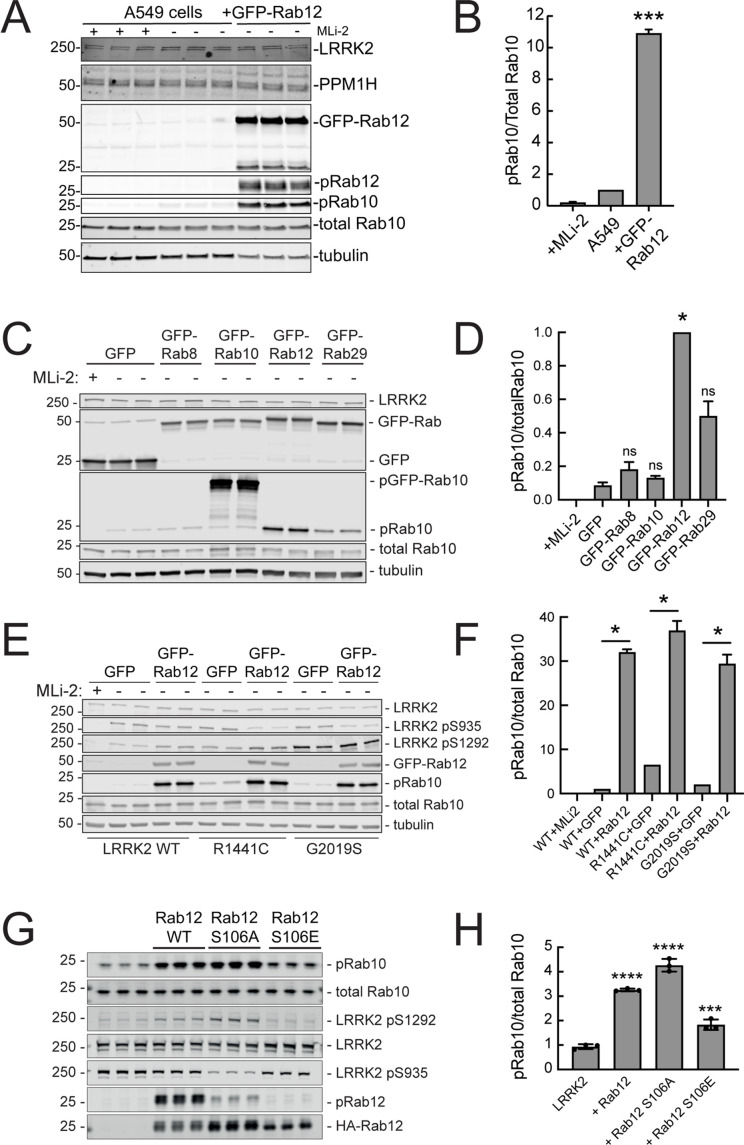
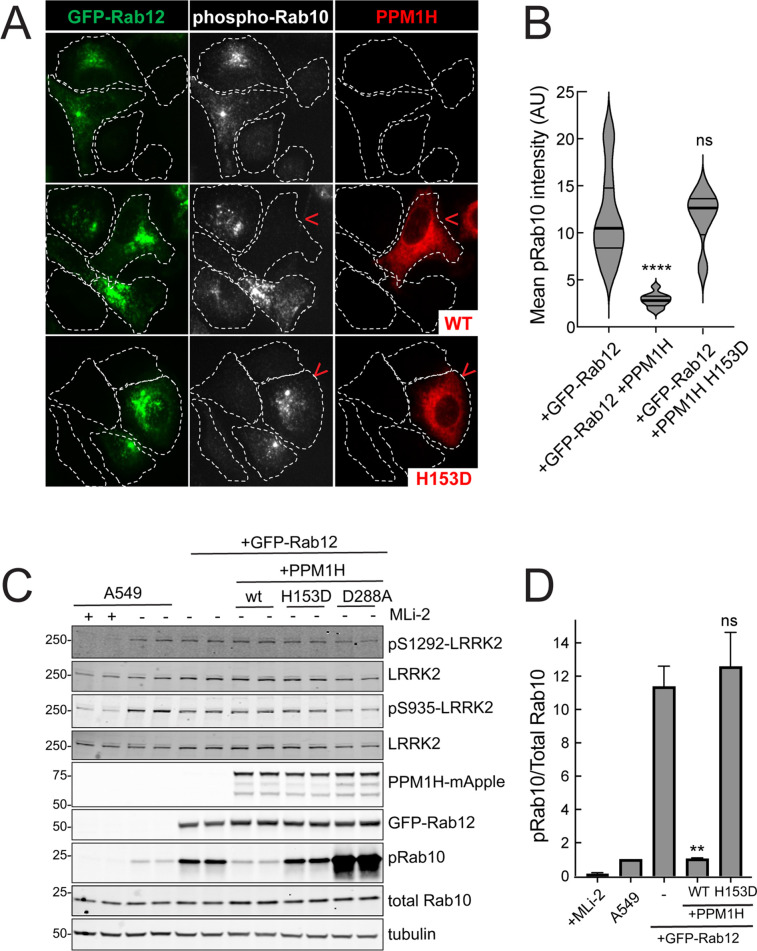
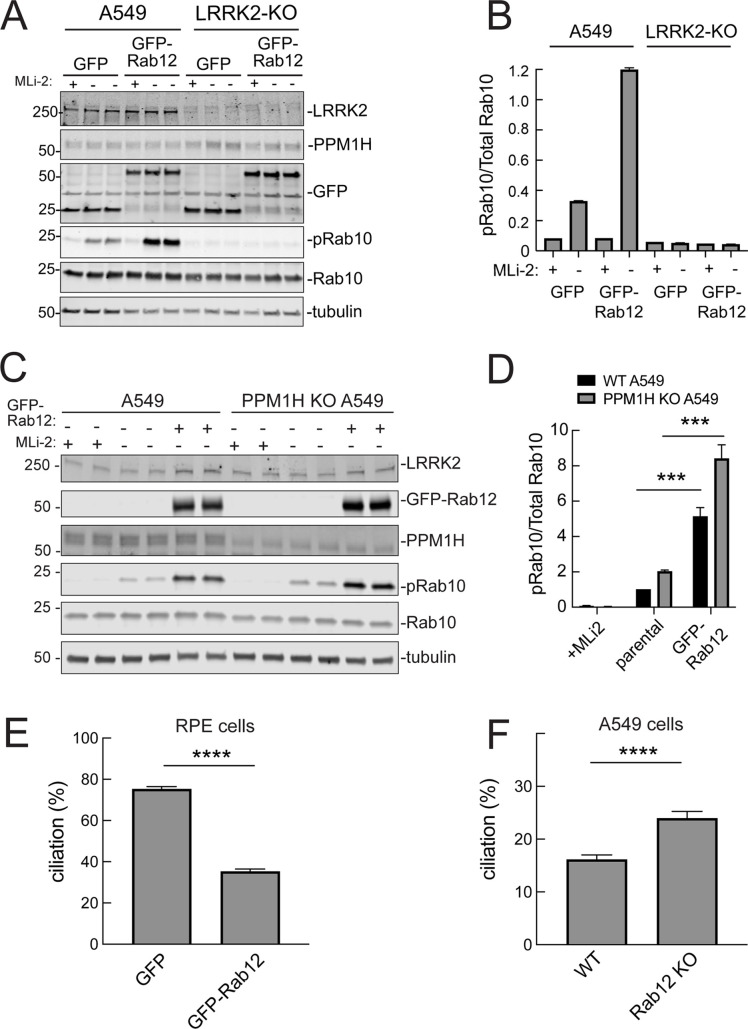
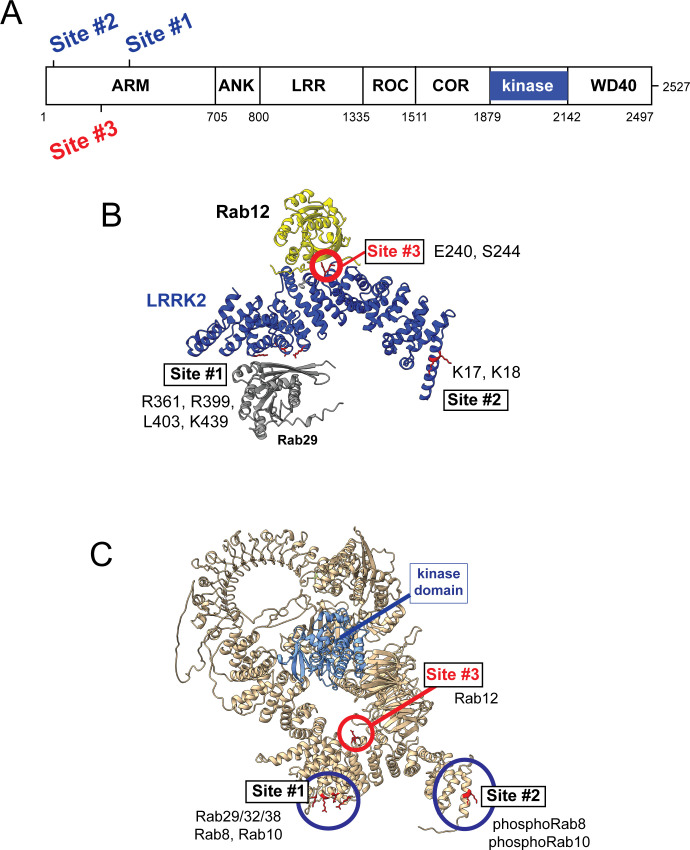
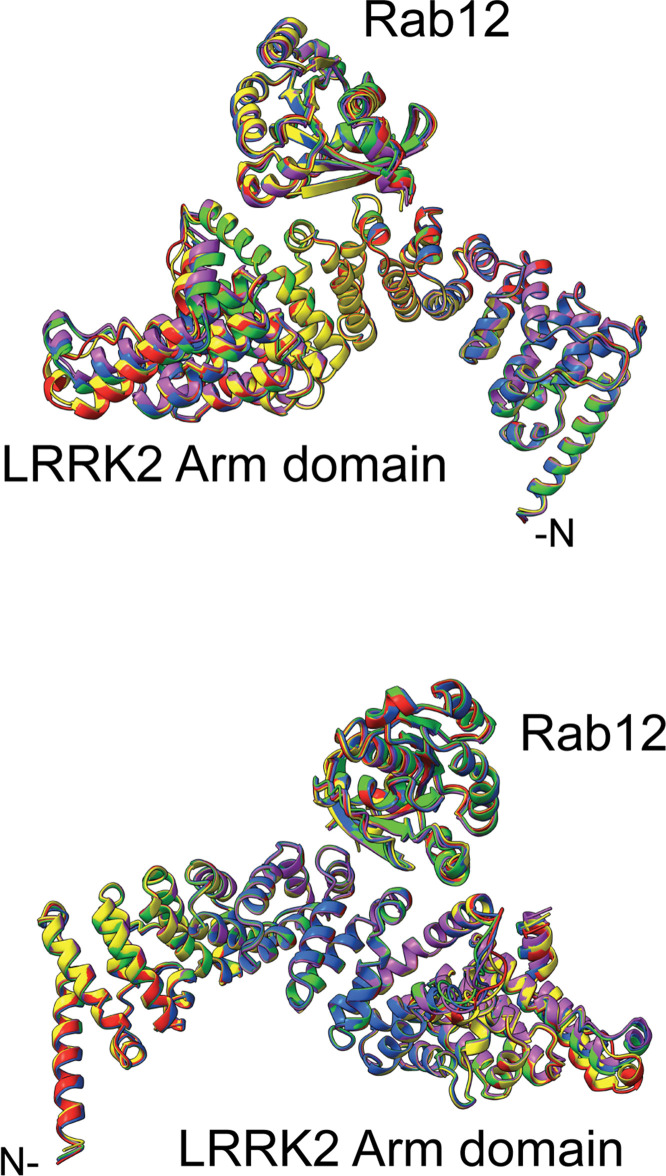
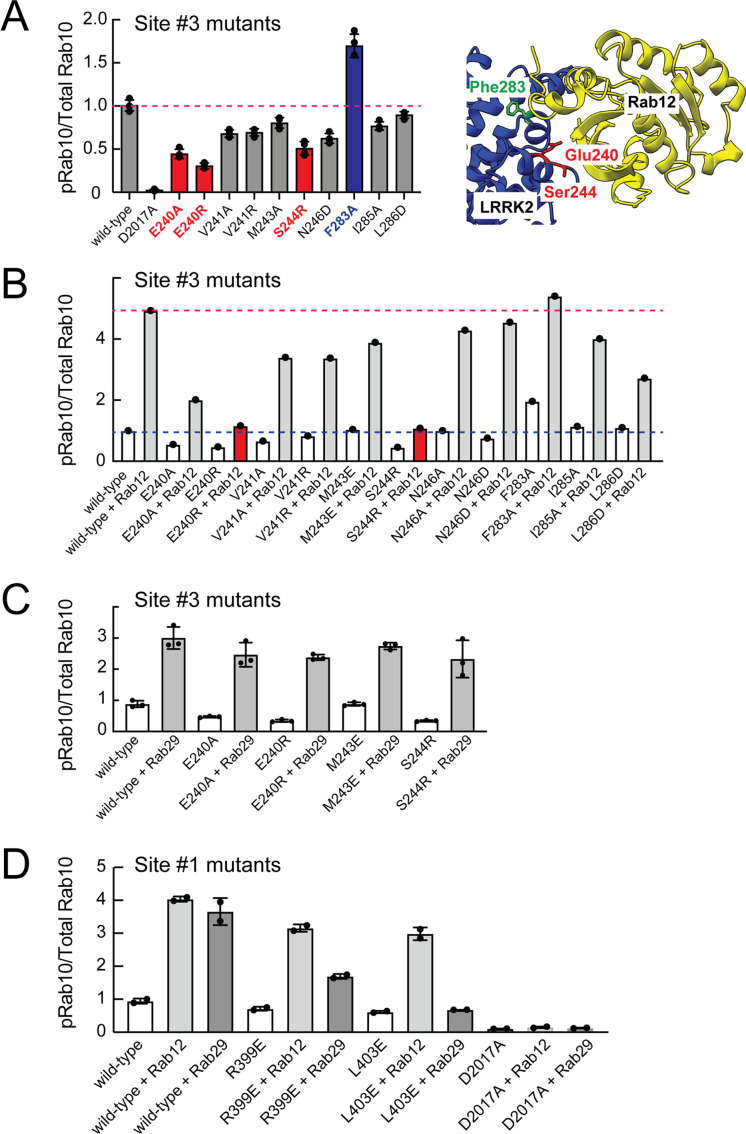
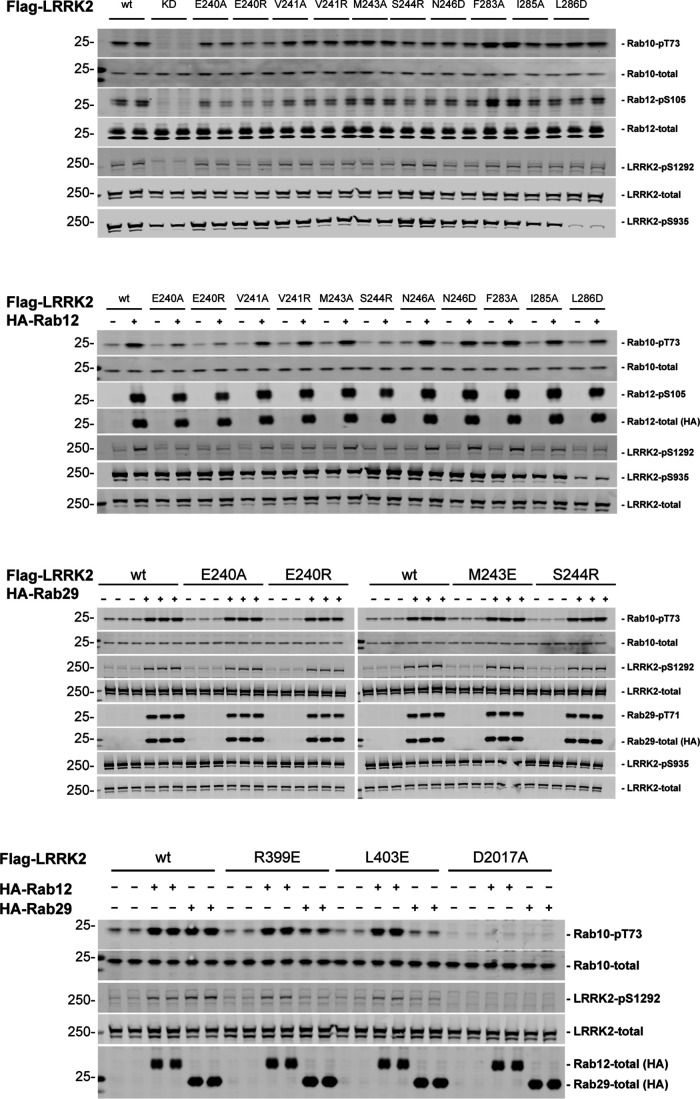
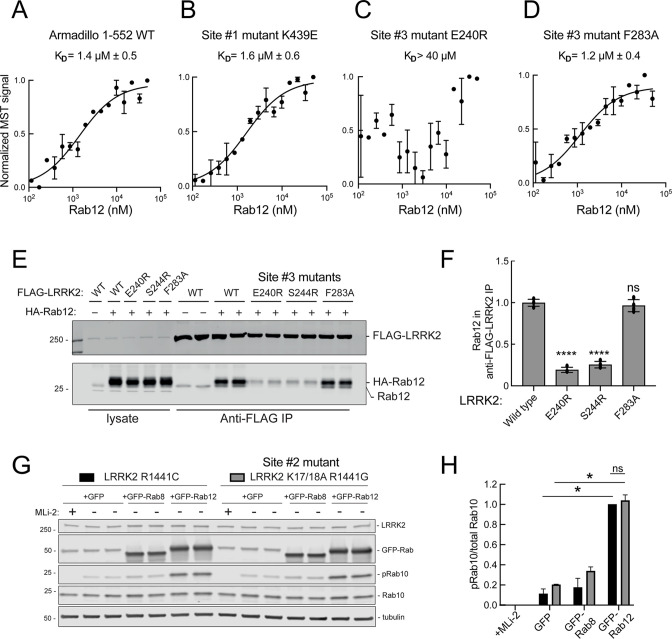
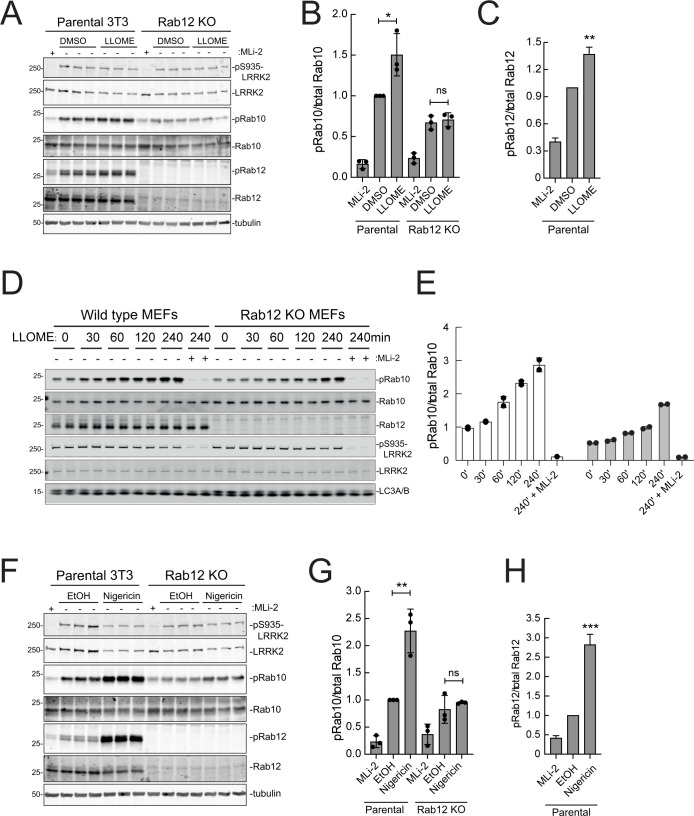
Activating mutations in the leucine-rich repeat kinase 2 (LRRK2) cause Parkinson's disease. LRRK2 phosphorylates a subset of Rab GTPases, particularly Rab10 and Rab8A, and we showed previously that these phosphoRabs play an important role in LRRK2 membrane recruitment and activation (Vides et al., 2022). To learn more about LRRK2 pathway regulation, we carried out an unbiased, CRISPR-based genome-wide screen to identify modifiers of cellular phosphoRab10 levels. A flow cytometry assay was developed to detect changes in phosphoRab10 levels in pools of mouse NIH-3T3 cells harboring unique CRISPR guide sequences. Multiple negative and positive regulators were identified; surprisingly, knockout of the Rab12 gene was especially effective in decreasing phosphoRab10 levels in multiple cell types and knockout mouse tissues. Rab-driven increases in phosphoRab10 were specific for Rab12, LRRK2-dependent and PPM1H phosphatase-reversible, and did not require Rab12 phosphorylation; they were seen with wild type and pathogenic G2019S and R1441C LRRK2. As expected for a protein that regulates LRRK2 activity, Rab12 also influenced primary cilia formation. AlphaFold modeling revealed a novel Rab12 binding site in the LRRK2 Armadillo domain, and we show that residues predicted to be essential for Rab12 interaction at this site influence phosphoRab10 and phosphoRab12 levels in a manner distinct from Rab29 activation of LRRK2. Our data show that Rab12 binding to a new site in the LRRK2 Armadillo domain activates LRRK2 kinase for Rab phosphorylation and could serve as a new therapeutic target for a novel class of LRRK2 inhibitors that do not target the kinase domain.

Keywords: LRRK2; Parkinson's disease; Rab GTPase; cell biology; kinase; lysosome stress; mouse.


Conflict of interest statement

HD, FT, WY, CC, CL, EJ, EP, DA, SP No competing interests declared

Figures

Figure 1.
Figure 1.. A flow cytometry-based, genome-wide CRISPR screen in NIH-3T3-Cas9 cells to reveal modifiers of the LRRK2-phosphoRab10 pathway.
(A) Phosphorylated Rab10 was detected by flow cytometry after staining cells using anti-phosphoRab10 antibody, either at steady state (control, blue) or in the presence of 4 µM nigericin for 3 hr (red) or 200 nM MLi-2 for 2 hr (green). 10,000 cells were analyzed under each of the indicated conditions. (B) Statistical analysis of the genome-wide screen. After infection with a lentiviral genome-wide CRISPR-Cas9 sgRNA library, genes when knocked out that reduced (left) or increased (right) phosphoRab10 intensity are indicated on the volcano plot where the X-axis is log2-fold change and Y-axis shows the false discovery rate (FDR)-corrected confidence scores. Genes highlighted are the top positive and negative regulators. (C, D) Validation of hits in NIH-3T3-Cas9 cells by immunofluorescence microscopy. (C) PhosphoRab10 was detected by immunofluorescence microscopy in early passage NIH-3T3-Cas9 cells that express lentivirus transduced sgRNAs against the indicated gene after 3 d of puromycin selection. Scale bar = 10 µm. (D, E) Quantitation of phosphoRab10 fluorescence in cells in which the indicated genes are knocked out. p-values: ****<0.0001; **0.0088; n > 100 cells counted in two independent experiments.
Figure 1—figure supplement 1.
Figure 1—figure supplement 1.. Guide RNA enrichment for CRISPR screen.
Log fold change (LFC) in representation of individual guides that target negative regulators (A) or positive regulators (B). Each dot represents a single guide; blue and red dots indicate enrichment or de-enrichment in the screen. (C) Volcano plot from the MAGeCK MLE analysis; beta score is shown as effect size.
Figure 1—figure supplement 2.
Figure 1—figure supplement 2.. Validation of hits in NIH-3T3-Cas9 cells by microscopy.
PhosphoRab10 was detected by immunofluorescence microscopy in early passage NIH-3T3-Cas9 cells. These cells express lentivirus-transduced sgRNAs against individual genes that were top hits. Three days after puromycin selection cells were stained with rabbit anti-phosphoRab10 antibody. Genes targeted are indicated. Dotted lines indicate the outline of the cells. Scale bar = 10 µm.
Figure 2.
Figure 2.. Loss of Rab12 decreases phosphoRab10.
(A, B) Loss of Rab12 decreases phosphoRab10. (A) Immunoblot analysis of NIH-3T3-Cas9 cells expressing Rab12 sgRNA (Rab12 KO) or parental cells, +/-MLi2 (200 nM for 2 hr) as indicated. (B) Quantitation of phosphoRab10 normalized to total Rab10 from immunoblots in (A). Error bars indicate SEM from two experiments carried out in duplicate. **p=0.002 by Student’s t-test. (C–H) Effect of Rab12 knockout on endogenous LRRK2 activity in mouse embryonic fibroblasts (MEFs) (C–E) and tissues (F-H) derived from Rab12 knockout mice as assessed by immunoblot analysis. The quantitation of phosphorylated Rab10 from immunoblots shown in Figure 2—figure supplements 1 and 2 normalized to respective total Rab10 levels is shown. Quantitation of the phosphorylated Rab7A normalized to respective total Rab7A levels, and total levels of Rab12 are also shown. MLi-2 was administered to MEFs at 100 nM for 1 hr and to mice at 30 mg/kg for 2 hr.
Figure 2—figure supplement 1.
Figure 2—figure supplement 1.. Immunoblots of mouse embryonic fibroblast (MEF) samples in support of Figure 2.
Figure 2—figure supplement 2.
Figure 2—figure supplement 2.. Immunoblots of tissue samples in support of Figure 2.
Figure 3.
Figure 3.. Exogenous Rab12 expression increases phosphoRab10 levels in A549 cells.
(A) Immunoblot analyses of A549 cells stably overexpressing GFP-Rab12; +/-MLi-2 (200 nM for 2 hr) as indicated. (B) Quantitation of phosphorylated Rab10 from immunoblots as in (A) normalized to total Rab10 levels; error bars indicate SEM from two experiments (***p=0.0003 by Student’s t-test). (C) Immunoblot analysis of 293T cells transfected with LRRK2 R1441C and GFP, GFP-Rab8, GFP-Rab10, GFP-Rab12, or GFP-Rab29 for 36 hr; +/-MLi2 (200 nM for 2 hr) as indicated. (D) Quantitation of phosphorylated Rab10 from immunoblots as in (C) normalized to total Rab10 levels. Error bars indicate SEM from two independent experiments; ***p=0.0004 for GFP and GFP-Rab12, *p=0.04 for GFP and GFP-Rab29 with Student’s t-test. (E) Immunoblot analysis of 293T cells transfected with LRRK2 WT, R1441C or G2019S and GFP or GFP-Rab12 for 36 hr, +/-MLi2 (200 nM for 2 hr) as indicated. (F) Quantitation of phosphorylated Rab10 from immunoblots as in (E) normalized to respective total Rab10 levels. Error bars indicate SEM from two independent experiments; ***p=0.0004 for LRRK2 WT GFP and GFP-Rab12, **p=0.005 for LRRK2 R1441C GFP and GFP-Rab12, **p=0.005 for LRRK2 G2019S GFP and GFP-Rab12 by Student’s t-test. (G) Immunoblot analysis of HEK293 cells expressing wild type FLAG-tagged LRRK2 and the indicated HA-tagged Rab12 constructs. (H) Quantitation of phosphorylated Rab10 from immunoblots as in (G) normalized to total Rab10; Error bars indicate mean with SD from three independent replicate experiments; ****p<0.0001 for Rab12 WT and Rab12 S106A, ***p=0.0007 for Rab12 S106E by one-way ANOVA relative to LRRK2.
Figure 4.
Figure 4.. PPM1H phosphatase counters phosphoRab10 generated upon Rab12 activation.
(A) A549 cells stably expressing GFP-Rab12 and PPM1H-mApple (wild type and H153D catalytically inactive mutant) were co-cultured with parental wild type A549 cells on coverslips. PhosphoRab10 was detected by immunofluorescence using rabbit anti-phosphoRab10. Red arrowheads indicate a cell with both GFP-Rab12 and wtPPM1H-mApple or PPM1H H153D. Scale bar = 10µm. (B) Quantitation of mean phosphoRab10 fluorescence intensity per cell (Arbitrary units, AU) is shown in the violin plot. Error bars indicate SEM from two independent experiments. At least 10 cells per condition were counted. ****p<0.0001 for GFP-Rab12 and GFP-Rab12+wtPPM1H, ns p=0.9944 for GFP-Rab12 and GFP-Rab12+H153D PPM1H by Student’s t-test. (C) Immunoblot analysis of parental A549 cells or A549 cells stably expressing GFP-Rab12 together with either wtPPM1H, H153D-PPM1H or D288A-PPM1H; +/-MLi2 (200 nM for 2 hr) as indicated. (D) Quantitation of phosphorylated Rab10 from immunoblots as in (A) normalized to respective total Rab10 levels. Error bars indicate SEM from two independent experiments; **p=0.007 for GFP-Rab12 and GFP-Rab12+wtPPM1H, ns p=0.5510 for GFP-Rab12 and GFP-Rab12+H153D-PPM1H by Student’s t-test.
Figure 5.
Figure 5.. Roles of LRRK2 and PPM1H in Rab12 activation of LRRK2.
(A) Immunoblot analysis of WT and LRRK2 KO A549 cells stably expressing GFP or GFP-Rab12;+/-MLi-2 (200 nM for 2 hr) as indicated. (B) Quantitation of phosphorylated Rab10 from immunoblots as in (A) normalized to respective total Rab10 levels. (C) Immunoblot analysis of WT and PPM1H KO A549 parental cells or cells stably expressing GFP-Rab12;+/-MLi-2 (200 nM for 2 hr) as indicated. (D) Quantitation of phosphorylated Rab10 from immunoblots as in (C) normalized to respective total Rab10, normalized to WT parental. Error bars indicate SEM from four independent experiments; ***p=0.0002 for both WT and PPM1H KO parental and GFP-Rab12 by Student’s t-test. (E) RPE cells stably overexpressing either GFP or GFP-Rab12 were serum starved for 24 hr to trigger ciliation. Cilia were detected using anti-Arl13b antibody and ciliation percentage was calculated by the number of cilia (by Arl13b) per cell (by DAPI). Error bars represent SEM from two independent experiments, >500 cells counted each. ****p<0.0001 by Student’s t-test. (F) WT or Rab12 KO A549 were plated at full confluency and serum starved for 24 hr to trigger ciliation. Percentage of ciliated cells was determined as in (E). ****p<0.0001 by Student’s t-test. Error bars represent SEM from two independent experiments, >500 cells counted each.
Figure 6.
Figure 6.. Models for Rab interactions with the LRRK2 Armadillo domain.
(A) Domain organization of LRRK2 with Rab binding sites #1–3 indicated. (B) AlphaFold model for LRRK2 Armadillo domain (blue) interaction with Rab12 (yellow) and Rab29 (gray). The Rab12 was docked onto Armadillo using Colabfold in ChimeraX; Rab29 was positioned manually. Site #1 binds Rab29, Site #2 binds phosphorylated Rabs (Vides et al., 2022), and Site #3 binds Rab12. The key residues for Rab12 binding are circled in red. (C) Full-length AlphaFold model of LRRK2 indicating localization of Rab binding sites; the kinase catalytic domain is highlighted in light blue.
Figure 6—figure supplement 1.
Figure 6—figure supplement 1.. Overlay of the top 5 AlphaFold models for Rab12 interaction with the LRRK2 Armadillo domain residues 1–552.
The complete overlap is consistent with high confidence in the structure prediction. A pdb file for these models is available at https://zenodo.org/deposit/8039572.
Figure 7.
Figure 7.. Rab binding Site 3 is needed for Rab12- but not Rab29-mediated LRRK2 activation.
(A) Immunoblot analysis of HEK293 cells transfected with the indicated LRRK2 Site #3 mutants. Shown is quantitation of the fraction of phosphorylated Rab10 from immunoblots as in Figure 6—figure supplement 1 normalized to respective total Rab10 levels. Shown at right is the structure model for Rab12-ARM domain interaction as in Figure 6. (B) Immunoblot analysis of Site #3 mutants with HA-empty or HA-Rab12 as in (A). (C) Immunoblot analysis of Site #3 mutants with HA-empty or HA-Rab29 as in (A). (D) Immunoblot analysis of Site #1 mutants with HA-empty, HA-Rab12, or HA-Rab29 as in (A). For all panels, the results from duplicate, independent replicate experiments are shown.
Figure 7—figure supplement 1.
Figure 7—figure supplement 1.. Immunoblots of samples quantified in Figure 7.
Figure 8.
Figure 8.. Rab12 binds directly to Site #3 and Site #2 is dispensable for Rab12-mediated LRRK2 activation.
(A–D) Microscale thermophoresis of Rab12 binding to fluorescently labeled LRRK2 Armadillo domain (residues 1–552) wild type (A) or bearing the indicated mutations at Site #1: K439E (B) or Site #3: E240R (C) and F283A (D). Purified Rab12 was serially diluted and then NHS-RED-labeled-LRRK2 Armadillo (final concentration 100 nM) was added. Graphs show mean and SEM from two independent measurements, each the average of two replicate runs. (E) Immunoblot of anti-FLAG antibody immunoprecipitation of FLAG-LRRK2 wild type or indicated Site #3 mutants with endogenous or co-expressed HA-Rab12 protein in HEK293 cells. Lysate inputs (1.5%) are shown at left; membranes were probed with anti-FLAG or anti-Rab12 antibodies. (F) Quantitation of two independent experiments carried out in duplicate as in (E). ****p<0.0001 for LRRK2 E240R and S244R relative to LRRK2 WT by one-way ANOVA. (G) Immunoblot analysis of 293T cells transfected with LRRK2 R1441C or K17/18A R1441G and GFP, GFP-Rab8, or GFP-Rab12 for 36 hr; +/-MLi2 (200 nM for 2 hr). (H) Quantitation of the fraction of phosphorylated Rab10 from immunoblots as in (G) normalized to respective total Rab10 levels, normalized to LRRK2 R1441C+GFP-Rab12. Error bars indicate SEM from two independent experiments; **p=0.003 for LRRK2 R1441C GFP and GFP-Rab12, **p=0.0044 for LRRK2 K17/18A R1441G GFP and GFP-Rab12, ns = 0.6 by Student’s t-test.
Figure 9.
Figure 9.. Rab12 contributes to LRRK2 activation by LLOME and nigericin.
(A) Immunoblot analysis of WT and Rab12 KO NIH-3T3 cells treated with 1 mM LLOME for 2 hr,+/-MLi-2 (200 nM for 2 hr) as indicated. (B) Quantitation of phosphorylated Rab10 from immunoblots as in (A) normalized to total Rab10; Error bars indicate SEM from three experiments. (C) Quantitation of phosphorylated Rab12 as in (A) normalized to total Rab12; Error bars indicate SEM from three experiments (***p=0.0002 by Student’s t-test). (D) Immunoblot analysis of WT and Rab12 KO MEFs treated with 1 mM LLOME for the indicated times, +/-MLi-2 (100 nM for 4 hr) as indicated. (E) Quantitation of phosphorylated Rab10 from immunoblots as in (D) normalized to total Rab10 levels; error bars indicate mean with SD from two independent replicate experiments. (F) Immunoblot analysis of WT and Rab12 KO NIH-3T3 cells treated with 2 µM nigericin for 2 hr, +/-MLi-2 (200 nM for 2 hr) as indicated. (G) Quantitation of phosphorylated Rab10 from immunoblots as in (F) normalized to total Rab10; error bars indicate SEM from three independent experiments; **p=0.0022 by Student’s t-test. (H) Quantitation of phosphorylated Rab12 from immunoblots as in (F) normalized to total Rab12; error bars indicate SEM from three independent experiments; **p=0.0092 by Student’s t-test.

Update of

References

    1. Alessi DR, Sammler E. LRRK2 kinase in Parkinson’s disease. Science. 2018;360:36–37. doi: 10.1126/science.aar5683. - DOI - PubMed
    1. Berndsen K, Lis P, Yeshaw WM, Wawro PS, Nirujogi RS, Wightman M, Macartney T, Dorward M, Knebel A, Tonelli F, Pfeffer SR, Alessi DR. PPM1H phosphatase counteracts LRRK2 signaling by selectively dephosphorylating Rab proteins. eLife. 2019;8:e50416. doi: 10.7554/eLife.50416. - DOI - PMC - PubMed
    1. Boecker CA, Goldsmith J, Dou D, Cajka GG, Holzbaur ELF. Increased LRRK2 kinase activity alters neuronal autophagy by disrupting the axonal transport of autophagosomes. Current Biology. 2021;31:2140–2154. doi: 10.1016/j.cub.2021.02.061. - DOI - PMC - PubMed
    1. Bonet-Ponce L, Beilina A, Williamson CD, Lindberg E, Kluss JH, Saez-Atienzar S, Landeck N, Kumaran R, Mamais A, Bleck CKE, Li Y, Cookson MR. LRRK2 mediates tubulation and vesicle sorting from lysosomes. Science Advances. 2020;6:eabb2454. doi: 10.1126/sciadv.abb2454. - DOI - PMC - PubMed
    1. Cai Y, Yang Y, Shen M, Zhou T. Inhibition of cytokinesis by overexpression of NudCL that is localized to the centrosome and midbody. Cell Research. 2009;19:1305–1308. doi: 10.1038/cr.2009.118. - DOI - PubMed

Publication types

MeSH terms

Substances