. 2023 Nov 9;186(23):5114-5134.e27.
doi: 10.1016/j.cell.2023.09.024. Epub 2023 Oct 23.

Human MCTS1-dependent translation of JAK2 is essential for IFN-γ immunity to mycobacteria

Affiliations

Human MCTS1-dependent translation of JAK2 is essential for IFN-γ immunity to mycobacteria

Jonathan Bohlen et al. Cell. .

Abstract

Human inherited disorders of interferon-gamma (IFN-γ) immunity underlie severe mycobacterial diseases. We report X-linked recessive MCTS1 deficiency in men with mycobacterial disease from kindreds of different ancestries (from China, Finland, Iran, and Saudi Arabia). Complete deficiency of this translation re-initiation factor impairs the translation of a subset of proteins, including the kinase JAK2 in all cell types tested, including T lymphocytes and phagocytes. JAK2 expression is sufficiently low to impair cellular responses to interleukin-23 (IL-23) and partially IL-12, but not other JAK2-dependent cytokines. Defective responses to IL-23 preferentially impair the production of IFN-γ by innate-like adaptive mucosal-associated invariant T cells (MAIT) and γδ T lymphocytes upon mycobacterial challenge. Surprisingly, the lack of MCTS1-dependent translation re-initiation and ribosome recycling seems to be otherwise physiologically redundant in these patients. These findings suggest that X-linked recessive human MCTS1 deficiency underlies isolated mycobacterial disease by impairing JAK2 translation in innate-like adaptive T lymphocytes, thereby impairing the IL-23-dependent induction of IFN-γ.

Keywords: IL-23; JAK2; MCTS1; MSMD; X-linked disease; inborn error of immunity; mycobacterium; translation re-initiation.


Conflict of interest statement

Declaration of interests J.-L.C. serves on the scientific advisory boards of ADMA Biologics Inc., Kymera Therapeutics, and Elixiron Immunotherapeutics.

Figures

Figure 1:
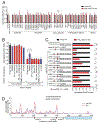
Figure 1:. Hemizygous MCTS1 mutations in patients with MSMD from five unrelated families.
(A) Family pedigrees with allele segregation. The patients in black suffer from MSMD and are hemizygous for the indicated MCTS1 alleles. The arrow indicates the proband. Other symbols; asymptomatic: black vertical line, heterozygous: blackdots, unknown genotype: “E?”, wild-type: WT. (B) Schematic representation of the MCTS1 mRNA (top) and protein (middle) structure. (Bottom) Predicted protein products of the MCTS1 variants found in MSMD patients. (C) CADD MAF plot of all the nonsynonymous, hemizygous MCTS1 variants of the gnomAD database (in black, splicing in blue), and the five MCTS1 pLOF variants of patients with MSMD (in red). (D) Schematic representation of the known molecular function of MCTS1 and its binding partner, DENR.
Figure 2:
Figure 2:. The MCTS1 mutations found in MSMD patients are loss-of-expression and loss-of-function.
(A) Western blot of wild-type (WT) and MCTS1KO HeLa cells transiently transfected with MCTS1 variants; Red: patients; blue: synthetic LOF variant; purple: gnomAD missense variants; EV: empty vector. Bold variants: hemizygous in gnomAD. Representative data from three independent experiments are shown. (B-D) Levels of MCTS1 protein in (B) primary fibroblasts from P2 and healthy controls, (C) T-cell blasts from P2, P4, P5 and P7 and healthy WT controls, and (D) neutrophils of P2, his relatives (M = mother, F= father, S = sister) and two healthy WT controls (C1, C2) as determined by western blotting. (E) Schematic representation of the reporter constructs used for the MCTS1 activity assay in (F) Activity of the MCTS1 variants used for the transient transfection of MCTS1KO HeLa cells, as assessed by the luciferase translation reinitiation assay. Bars: mean and SD of five biological replicates. Statistical significance was assessed in unpaired Welch’s t-tests corrected for multiple testing. *p<0.05
Figure 3:
Figure 3:. Defective ribosome recycling and translation reinitiation in the patients’ cells
(A-D) Metagene profiles for 40S (A, C) and 80S (B, D) ribosome footprinting showing the position of the 5’ end of the ribosome footprints relative to the stop codons of all proteins (coding ORFs) in HeLa cells (A, B) and SV40-fibroblasts (C, D). (A, B) Read counts normalized against the area indicated on the plot; (C, D) Read counts normalized by sequencing depth. (E) Penultimate codon enrichments for mORFs in the top quartile for 40S accumulation (n = 1034) relative to all detected mORF stop codons (n = 4222). Significance was assessed in binomial tests, with correction for multiple testing. (F) Volcano plot of changes in translation efficiency from 80S footprinting data for P2 SV40-fibroblasts +/− MCTS1. The p-values adjusted for multiple testing in X-tail analysis are shown on the y-axis. (G) Volcano plot of changes in translation efficiency from the 80S footprinting data of T-cell blasts from P2, P4, P5, P7 relative to four healthy controls. The p-values adjusted for multiple testing by X-tail analysis are shown on the y-axis. (H) Levels of mRNA, ribosome footprints on mRNA and translation efficiency for the JAK2 endogenous mRNA from (G).
Figure 4:
Figure 4:. JAK2 translation depends on MCTS1-mediated reinitiation.
(A) The 5’UTR translation reporters indicated were assessed in WT (black) and MCTS1KO (red) HeLa cells. Number −1, −2 indicate distinct 5’UTR isoforms. Results are shown for 3-5 biological replicates per reporter. Statistical significance was assessed in multiple, two-tailed, unpaired t-tests with correction for multiple testing (**p<0.005). (B-C) Efficiency of JAK2 reporter translation in WT and MCTS1KO cells transfected with the indicated constructs, as assessed in dual-luciferase assays. Results for three biological replicates are shown. Statistical significance was assessed in multiple, two-tailed, unpaired t-tests with correction for multiple testing (*p<0.05, **p<0.005). (D) Trace of the 40S ribosome footprints on the endogenous JAK2 5’UTR. Red: MCTS1-dependent stuORFs, pink: MCTS1-independent uORF, blue: JAK2 main ORF.
Figure 5:
Figure 5:. JAK2 is poorly expressed in cells derived from MCTS1-deficient patients.
(A-D) Western blot for JAK2, MCTS1, DENR and vinculin on total lysate from (A) MCTS1KO THP-1 clones (1 to 5) and wild-type (WT) THP-1 cells, (B) SV40-fibroblasts from P2 and a healthy control stably transduced with the indicated overexpression constructs, (C) HSV-T cells from P2, healthy controls and an IL-12Rβ1-deficient patient and (D) T-cell blasts from P2, P5 and healthy controls (C1, C2 and C3). The data shown are representative of three (A, C, D), or (B) two independent experiments.) (E) Quantification of JAK2 protein levels relative to a loading control from (A-D) (F) Gene set enrichment analysis of RNA-seq analysis of T-cell blasts from heathy controls (n = 9), MCTS1-deficient (n = 4), TYK2-deficient (n = 1), IL-12Rβ1-deficient (n = 1), IRAK4-deficient (n = 1) and TYK2 P1104A-homozygous (n = 2) patients were stimulated with IL-1β (24 h) and with IL-12 and IL-23 (6 h). Dot heatmaps are shown for the 10 gene sets for the healthy controls most strongly affected by stimulation with IL-23 + IL-1β relative to IL-1β alone. (G, I) Western blots of the indicated HEK-Blue cell lines stably transduced with the indicated lentiviral vectors. The data shown are representative of three biological replicates. (H, J) HEK-Blue colorimetric activity of the indicated cell lines stimulated with the indicated cytokines for 20 hours. Data are shown for three biological replicates and statistical significance was assessed in unpaired, two-tailed t-tests, *p<0.05, **p<0.005. (K) The effect of gandotinib on the response to IL-23 + IL1-β or IL-12 in NK cells and to IFN-γ or IFN-α in monocytes. Summary plot, see Figure S7O–R for details. The data shown are the means of six biological replicates performed on NK cells and monocytes from two heathy donors each.
Figure 6:
Figure 6:. Defective IL-23-dependent IFN-γ induction in the patients’ primary immune cells
(A-B) Fresh PBMCs were stimulated with 50 ng/ml IL-12 or 100 ng/ml IL-23 for 48 hours or with PMA plus ionomycin for 24 hours. IFN-γ levels in the supernatant were assessed by LEGENDplex multiplex ELISA (A) and IFNG mRNA induction was assessed by qPCR (B). Statistical significance was assessed in unpaired Mann-Whitney U tests (*p<0.05). (C) RNA-seq analysis. Log2 fold-change in mRNA levels upon stimulation with IL-23 (100 ng/ml IL-23 for 48 hours) for transcripts differentially expressed in healthy controls, for the healthy controls and patients. (D) Heatmap showing the proportions of transcripts with changes in expression for indicated modules for the various individuals compared (controls versus P2, P4, P5) relative to baseline values in the absence of stimulation. Red: transcripts at higher levels than baseline, blue: decrease in transcript levels relative to baseline. (E) Cryopreserved PBMCs of the indicated genotypes were stimulated with 50 ng/ml IL-12, 100 ng/ml IL-23, 2.5 ng/ml IL-1β, or a combination of these cytokines for 48 hours, or with PMA + ionomycin for 24 hours. IFN-γ levels in the supernatant were assessed by LEGENDplex multiplex ELISA. Bars indicate the mean and SD.
Figure 7:
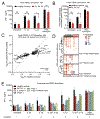
Figure 7:. Patients’ Vδ2+ γδ T and MAIT cells have impaired IFNG induction upon IL-23 stimulation and BCG infection.
(A-D) Single-cell RNA sequencing (scRNA-seq) analysis. PBMCs were either left non-stimulated or were stimulated with IL-23 for 6 hours, and single-cell capture was then performed. (A) Clustering analysis identifying 17 major leukocyte subsets. (B) The fold-change in IFNG mRNA levels following stimulation in MCTS1 patients relative to controls is shown on the x-axis. The y-axis shows the same parameter for IL-23R−/− patients as a comparison. The size of the circles indicates the median change (IL-23 versus NS) in normalized IFNG mRNA levels in controls for the corresponding subset. (C) Pathway analysis of the transcriptional response to IL-23 in IL-12Rβ1−/−, IL-23R−/− and MCTS1-deficient PBMCs relative to healthy control PBMCs, using the 50 Hallmark gene sets. Results are shown for selected immune-related gene sets. NES, normalized enrichment score. (D) Leading-edge genes for the Hallmark IFN-γ response gene set common to IL-12Rβ1-, IL-23R-and MCTS1-deficient patients relative to controls are shown. (E-G) Induction of IFN-γ in MCTS1-deficient Vδ2+ γδ T (E), MAIT (F) and NK (G) cells upon IL-23 stimulation and mycobacterial infection. Frequency of IFN-β-positive Vδ2+ γδ T cells following stimulation with cytokine, BCG or PMA plus ionomycin.

References

    1. Casanova JL, and Abel L (2021). Lethal Infectious Diseases as Inborn Errors of Immunity: Toward a Synthesis of the Germ and Genetic Theories. Annu Rev Pathol 16, 23–50. 10.1146/annurev-pathol-031920-101429. - DOI - PMC - PubMed
    1. Casanova JL, and Abel L (2022). From rare disorders of immunity to common determinants of infection: Following the mechanistic thread. Cell 185, 3086–3103. 10.1016/j.cell.2022.07.004. - DOI - PMC - PubMed
    1. Furin J, Cox H, and Pai M (2019). Tuberculosis. Lancet 393, 1642–1656. 10.1016/S0140-6736(19)30308-3. - DOI - PubMed
    1. Jouanguy E, Altare F, Lamhamedi S, Revy P, Emile JF, Newport M, Levin M, Blanche S, Seboun E, Fischer A, and Casanova JL (1996). Interferon-gamma-receptor deficiency in an infant with fatal bacille Calmette-Guerin infection. N Engl J Med 335, 1956–1961. 10.1056/NEJM199612263352604. - DOI - PubMed
    1. Newport MJ, Huxley CM, Huston S, Hawrylowicz CM, Oostra BA, Williamson R, and Levin M (1996). A mutation in the interferon-gamma-receptor gene and susceptibility to mycobacterial infection. N Engl J Med 335, 1941–1949. 10.1056/NEJM199612263352602. - DOI - PubMed

Publication types