. 2023 Nov 9;186(23):5151-5164.e13.
doi: 10.1016/j.cell.2023.09.022. Epub 2023 Oct 23.

Population immunity predicts evolutionary trajectories of SARS-CoV-2

Affiliations

Population immunity predicts evolutionary trajectories of SARS-CoV-2

Matthijs Meijers et al. Cell. .

Abstract

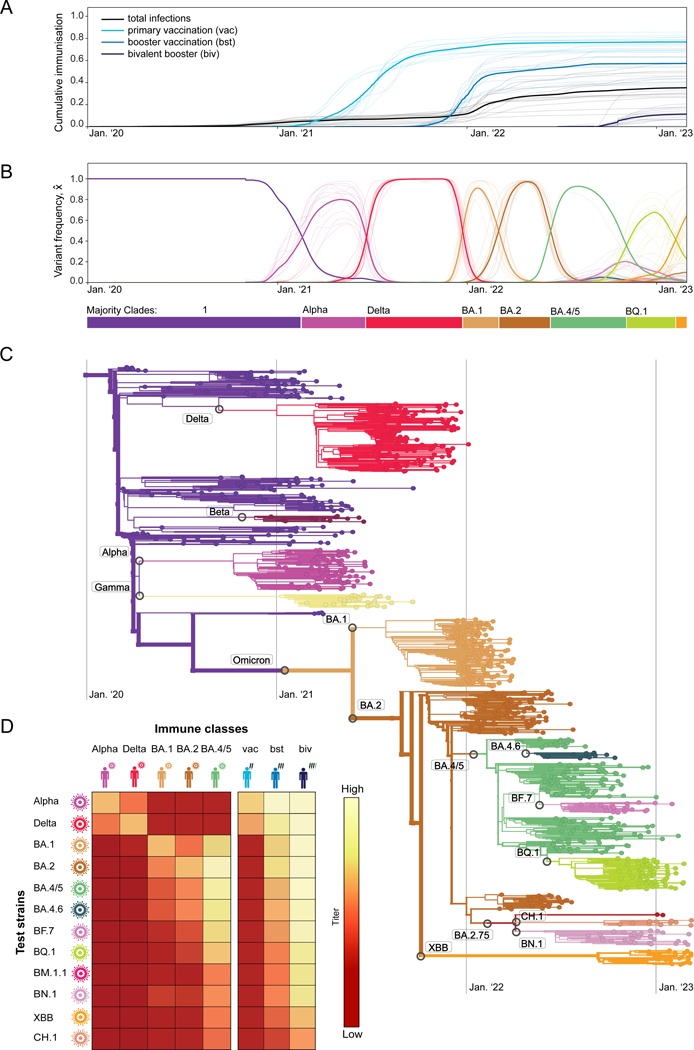
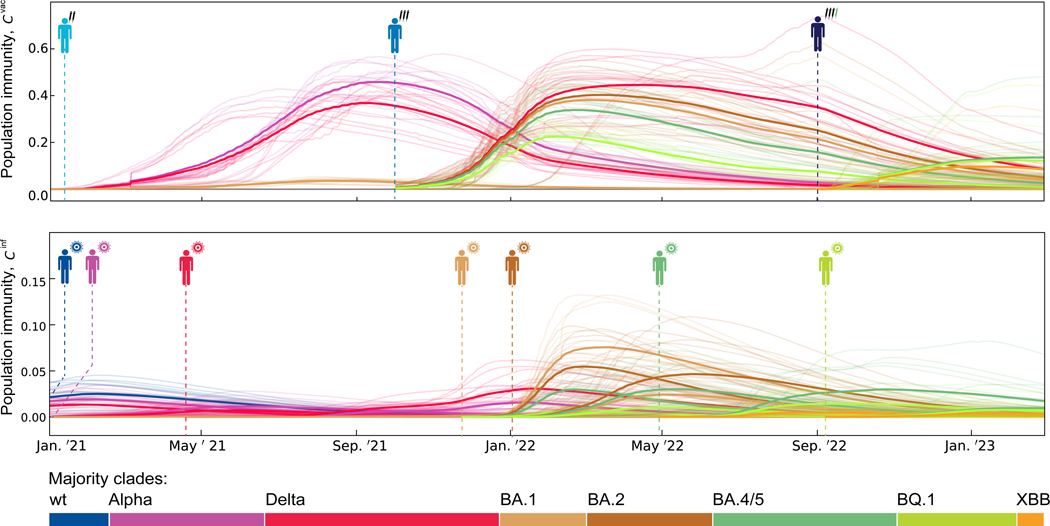
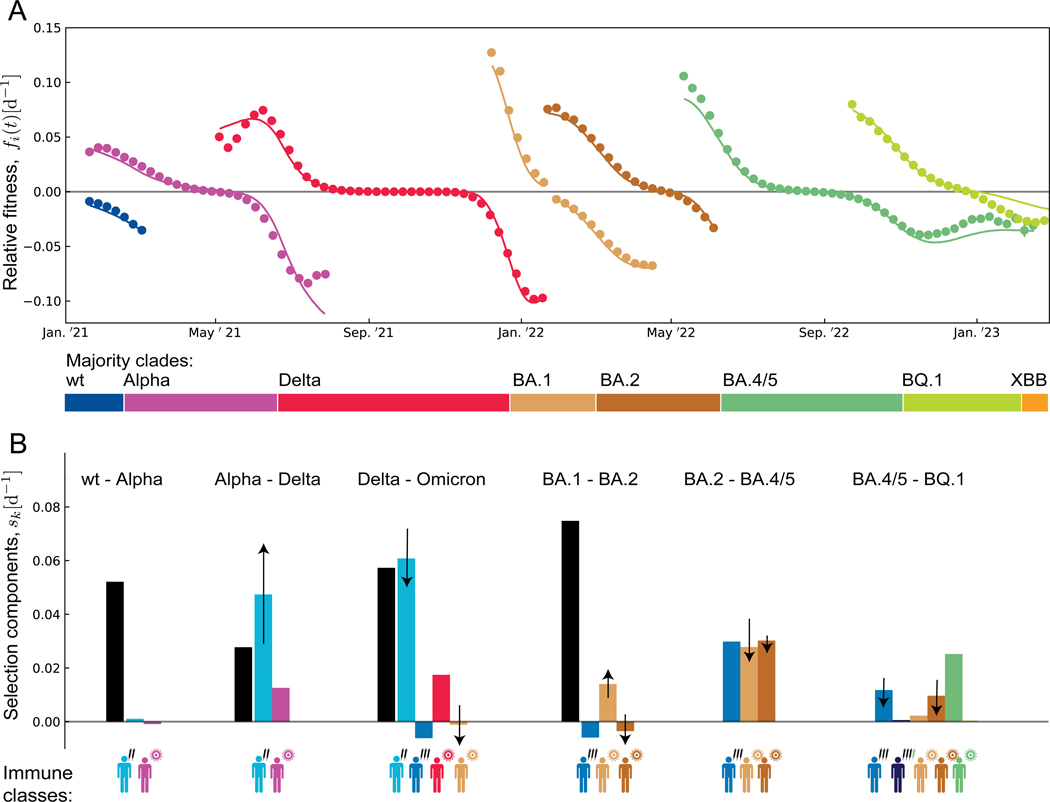
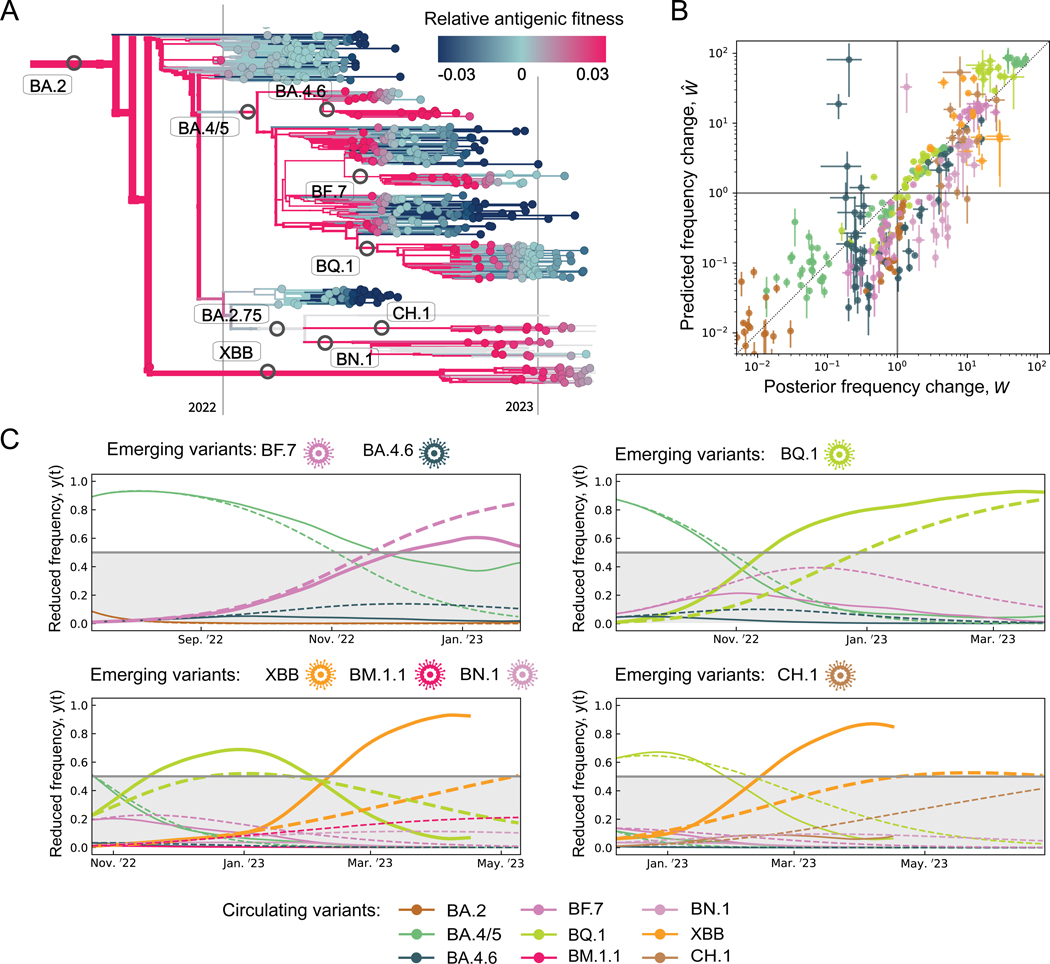
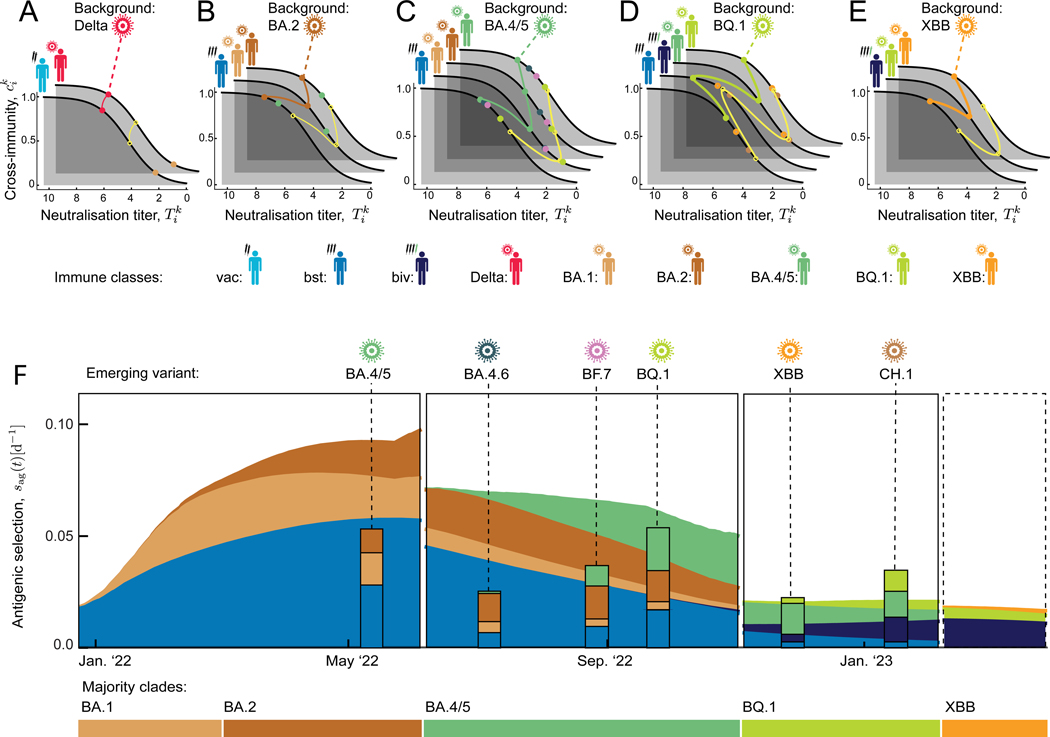
The large-scale evolution of the SARS-CoV-2 virus has been marked by rapid turnover of genetic clades. New variants show intrinsic changes, notably increased transmissibility, and antigenic changes that reduce cross-immunity induced by previous infections or vaccinations. How this functional variation shapes global evolution has remained unclear. Here, we establish a predictive fitness model for SARS-CoV-2 that integrates antigenic and intrinsic selection. The model is informed by tracking of time-resolved sequence data, epidemiological records, and cross-neutralization data of viral variants. Our inference shows that immune pressure, including contributions of vaccinations and previous infections, has become the dominant force driving the recent evolution of SARS-CoV-2. The fitness model can serve continued surveillance in two ways. First, it successfully predicts the short-term evolution of circulating strains and flags emerging variants likely to displace the previously predominant variant. Second, it predicts likely antigenic profiles of successful escape variants prior to their emergence.

Keywords: Evolution; Fitness model; Population immunity; SARS-CoV-2.


Conflict of interest statement

Declaration of interests The authors declare no competing interests.

Figures

Figure 1.
Figure 1.. Evolutionary, epidemiological, and immune tracking of SARS-CoV-2.
(A) Cumulative population fractions of infections and of primary, booster, and bivalent booster vaccinations; data from all longitudinally tracked regions of this study (thin lines) and region-averaged trajectories (thick lines). A list of regions and selection criteria are given in Methods. (B) Frequency trajectories for the ancestral clade (1), 7 major variant clades (Alpha, Delta, BA.1, BA.2, BA.4/5, BQ.1, XBB), and 5 global minor variant clades (BA.4.6, BA.7, BM.1.1, BN.1, CH.1); regional data (thin lines) and region-averaged trajectories (thick lines). Color bars mark the succession of major variants. (C) Timed, global strain tree of SARS-CoV-2 with strains colored by variant. Variants are annotated at the inferred time of their emergence. (D) Neutralisation titers, Tik, for test strains of different variants (i=Alpha,,CH.1) assayed in different immune classes of infection (k=Alpha,...BA.4/5) and vaccination (k=vac,bst,biv). Numerical values are given in Table S1; the inference procedure is described in Methods.
Figure 2.
Figure 2.. Population immunity trajectories.
The time-dependent population immunity, Cik(t), is shown for the major variants, i (coloured lines), and the immune classes, k (indicated by pictograms), relevant for this study. Trajectories for each immune class start at the dashed line (top: vaccination-derived immune classes, k=vac, bst, biv; bottom: infection-derived immune classes, k=Alpha,Delta,.,BQ.1). Thin lines show region-specific, thick lines region-averaged trajectories.
Figure 3.
Figure 3.. Fitness trajectories and selection breakdown for major clade shifts.
(A) Relative fitness of successive major variants in 7 completed clade shifts (1–Alpha, ... BA.4/5–BQ.1). Model-based trajectories for each variant, fi(t) (lines) are shown in the time interval between origination and loss; empirical fitness values, fi(t) (dots) are inferred from the frequency trajectories of Figure 1B. All trajectories are averaged over 13 regions; see Figure S1 for regional trajectories. Color bars mark the succession of major variants. (B) Breakdown of selection for each clade shift. Intrinsic selection coefficients, s0 (black), and antigenic selection coefficients in marked immune classs, sk (coloured), as inferred from the ML fitness model (bars: region- and time-averaged value for each crossover; arrows: region-averaged rms temporal change, (Δsk)21/2, with marked direction; confidence intervals are given in Table S3).
Figure 4.
Figure 4.. Predicting short-term evolution.
(A) Strain tree of BA.2 and descendent variants; strains are colored by model-based, clade- and time-dependent relative fitness, fi(t). (B) Short-term frequency change. We compare predicted changes, Wi(t,t+τ)=xi(t+τ)/x^i(t), with posterior empirical changes, W^i(t,t+τ)=x^i(t+τ)/x^i(t), over periods τ=60d in all longitudinally tracked regions for 8 variants i with initial frequencies x^i=0.01,0.2,0.4 (ascending segments), x^i/x^i,max=1,0.5,0.25 (descending segments). (C) Predominance shifts. We compare predicted and posterior trajectories of reduced fitness, yi(t) (dashed) and y^i(t) (solid), over periods τ=200d, starting from the emergence of new variants (marked above each panel); see text. Bold lines highlight variants predicted to outcompete all other variants co-existing at their time of emergence (i.e., to reach reduced frequencies y>0.5).
Figure 5.
Figure 5.. Antigenic selection profiles constrain emerging variants.
(A–E) Antigenic landscapes. Each family of landscapes shows neutralisation titers and cross-immunity factors, (Tik,cik) (dots), for a given majority variant as antigenic background and competing minority variants, in all immune classes relevant for the next clade shift. Yellow circles mark a “standard” mutant, as described in the text; data of the background variant and the standard mutant are joined by lines. (F) Antigenic selection profiles. Predicted antigenic selection trajectories of the standard variant against the background majority variant and their breakdown into immune classes, sag(t)=ksk(t) (stacked areas), are shown for successive background variants (horizontal color bars). Posterior selection profiles of observed variants are shown at their time of emergence (stacked bars). The last panel shows the predicted profile for the future clade shift away from XBB.

References

    1. Ozono S, Zhang Y, Ode H, Sano K, Tan TS, Imai K, Miyoshi K, Kishigami S, Ueno T, Iwatani Y, et al. (2021). SARS-CoV-2 D614G spike mutation increases entry efficiency with enhanced ACE2-binding affinity. Nature Communications 12, 848. doi:10.1038/s41467-021-21118-2. - DOI - PMC - PubMed
    1. Meng B, Kemp SA, Papa G, Datir R, Ferreira IA, Marelli S, Harvey WT, Lytras S, Mohamed A, Gallo G, et al. (2021). Recurrent emergence of SARS-CoV-2 spike deletion H69/V70 and its role in the Alpha variant B.1.1.7. Cell Reports 35, 109292. doi:10.1016/j.celrep.2021.109292. - DOI - PMC - PubMed
    1. Mlcochova P, Kemp S, Dhar MS, Papa G, Meng B, Ferreira IA, Datir R, Collier DA, Albecka A, Singh S, et al. (2021). SARS-CoV-2 B.1.617.2 Delta variant replication and immune evasion. Nature 599, 114–119. doi:10.1038/s41586-021-03944-y. - DOI - PMC - PubMed
    1. Wrobel AG, Benton DJ, Xu P, Roustan C, Martin SR, Rosenthal PB, Skehel JJ, and Gamblin SJ (2020). SARS-CoV-2 and bat RaTG13 spike glycoprotein structures inform on virus evolution and furincleavage effects. Nature Structural and Molecular Biology 27, 763–767. doi:10.1038/s41594-020-0468-7. - DOI - PMC - PubMed
    1. Gobeil SM-C, Henderson R, Stalls V, Janowska K, Huang X, May A, Speakman M, Beaudoin E, Manne K, Li D, et al. (2022). Structural diversity of the sars-cov-2 omicron spike. Molecular Cell 82, 2050–2068. doi:10.1016/j.molcel.2022.03.028. - DOI - PMC - PubMed

Publication types

Supplementary concepts

LinkOut - more resources