. 2023 Dec 4;58(23):2666-2683.e9.
doi: 10.1016/j.devcel.2023.10.002. Epub 2023 Oct 23.

The anaphase-promoting complex controls a ubiquitination-phosphoprotein axis in chromatin during neurodevelopment

Affiliations

The anaphase-promoting complex controls a ubiquitination-phosphoprotein axis in chromatin during neurodevelopment

Leya Ledvin et al. Dev Cell. .

Abstract

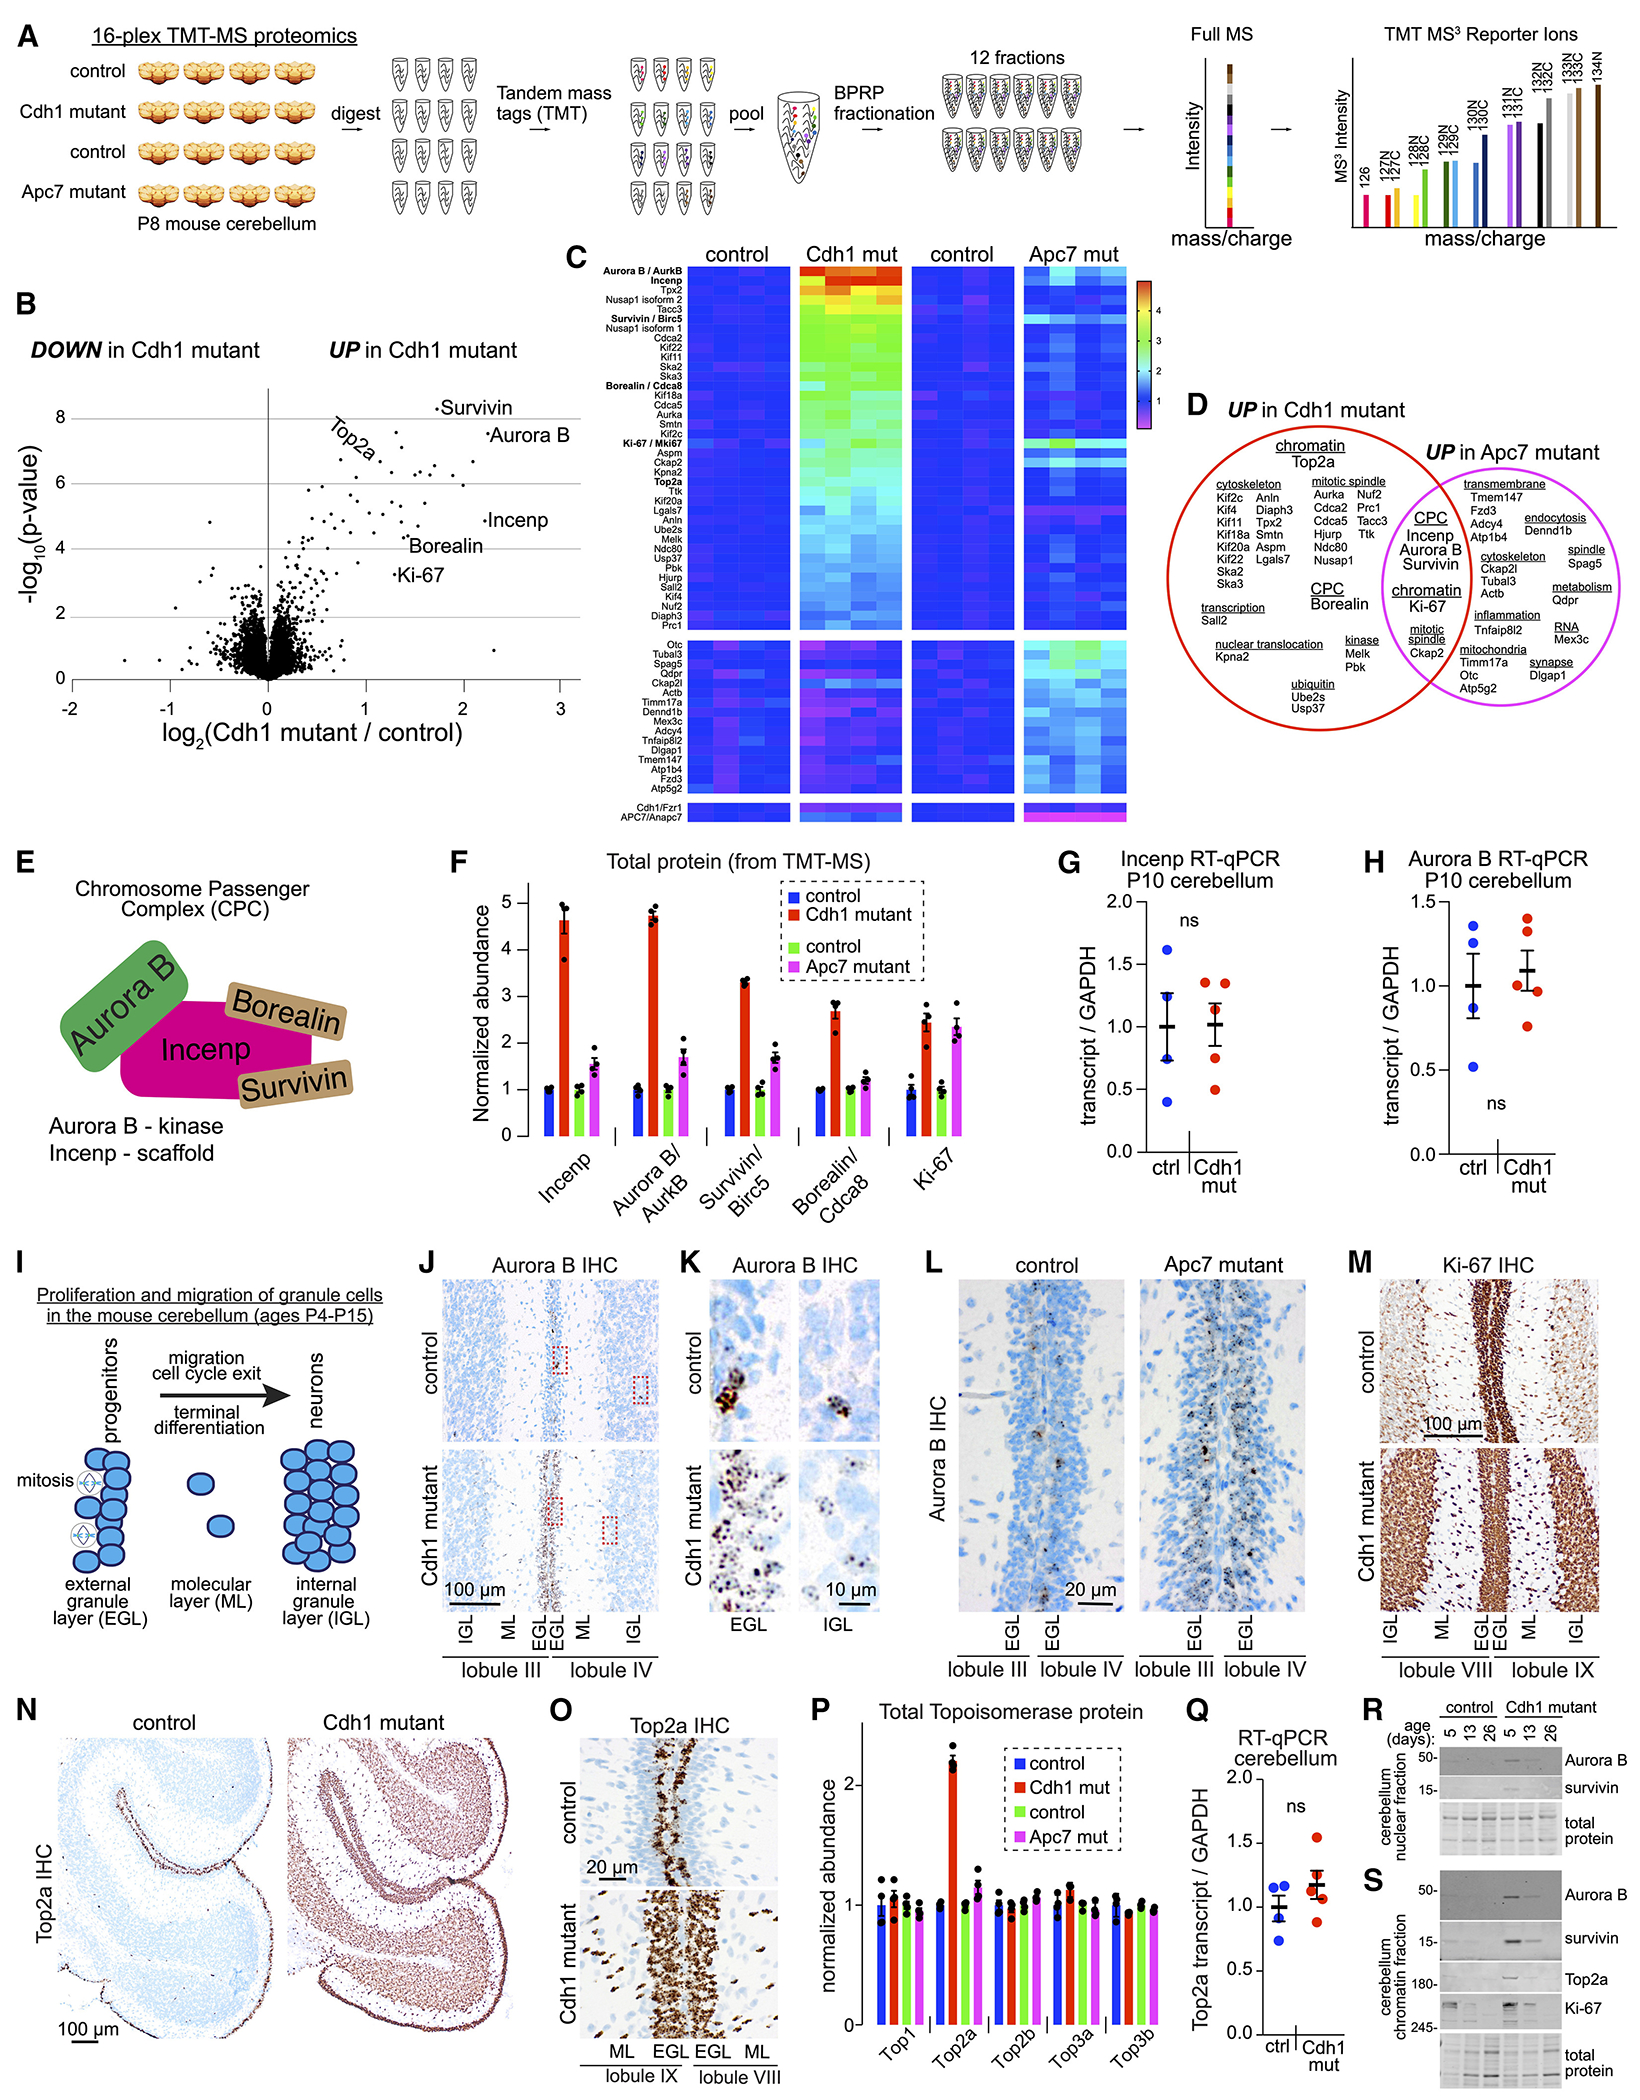
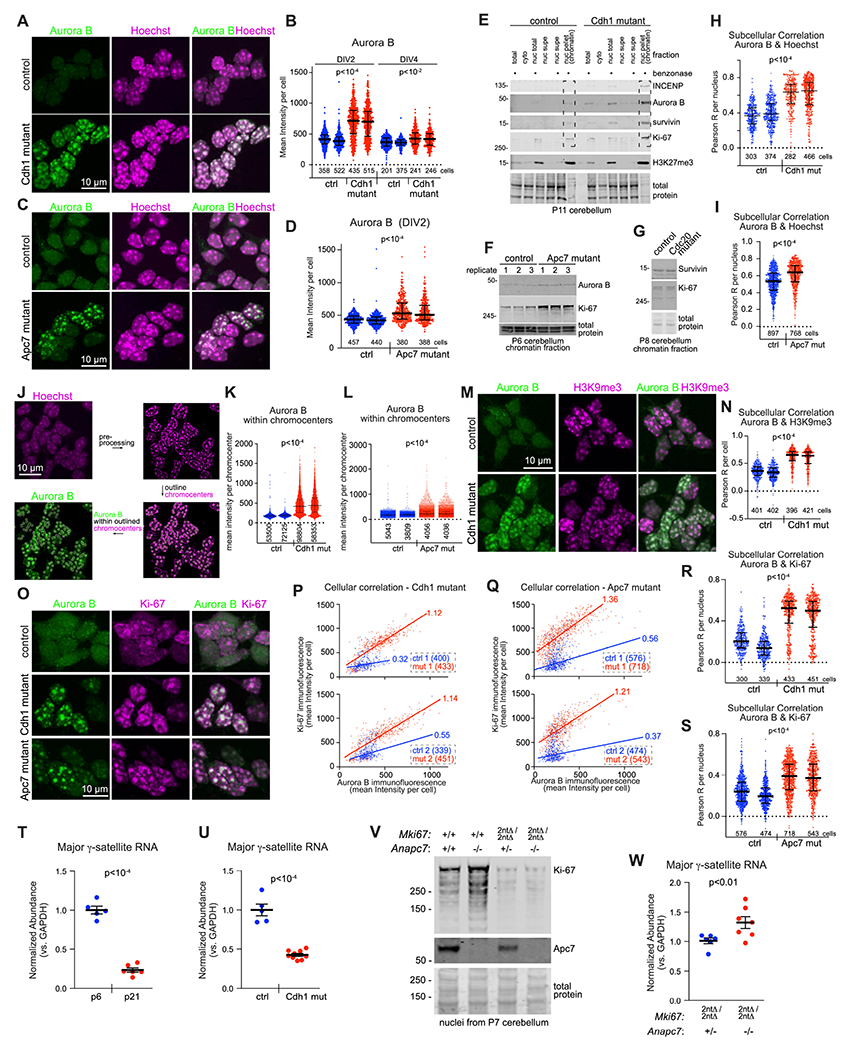
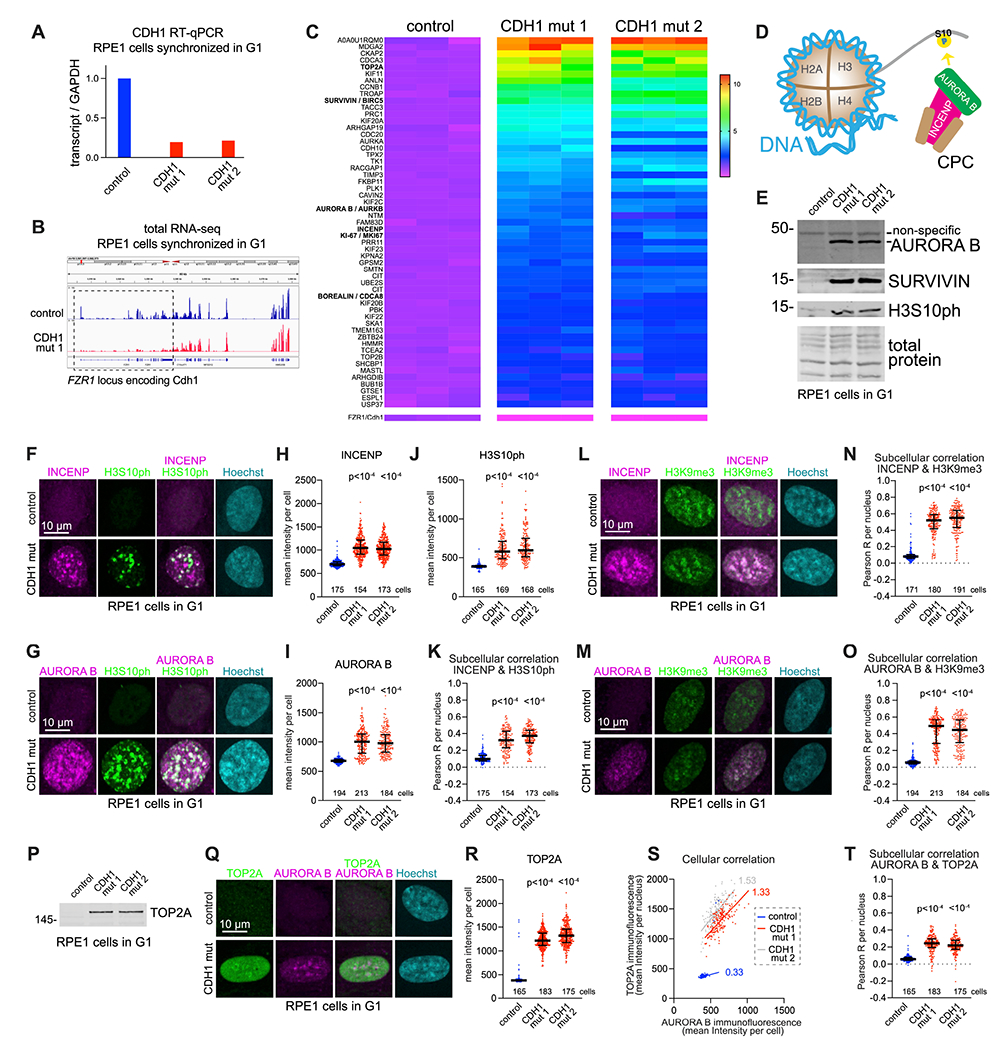
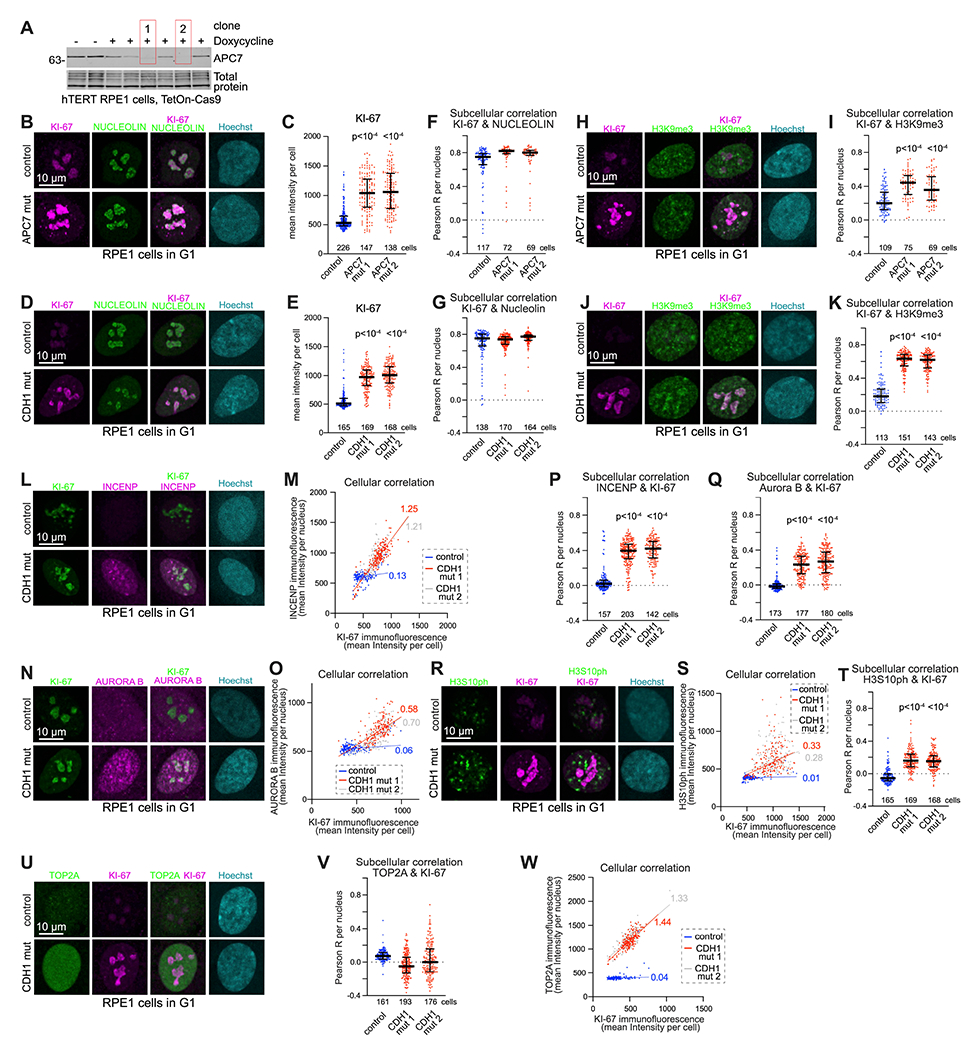
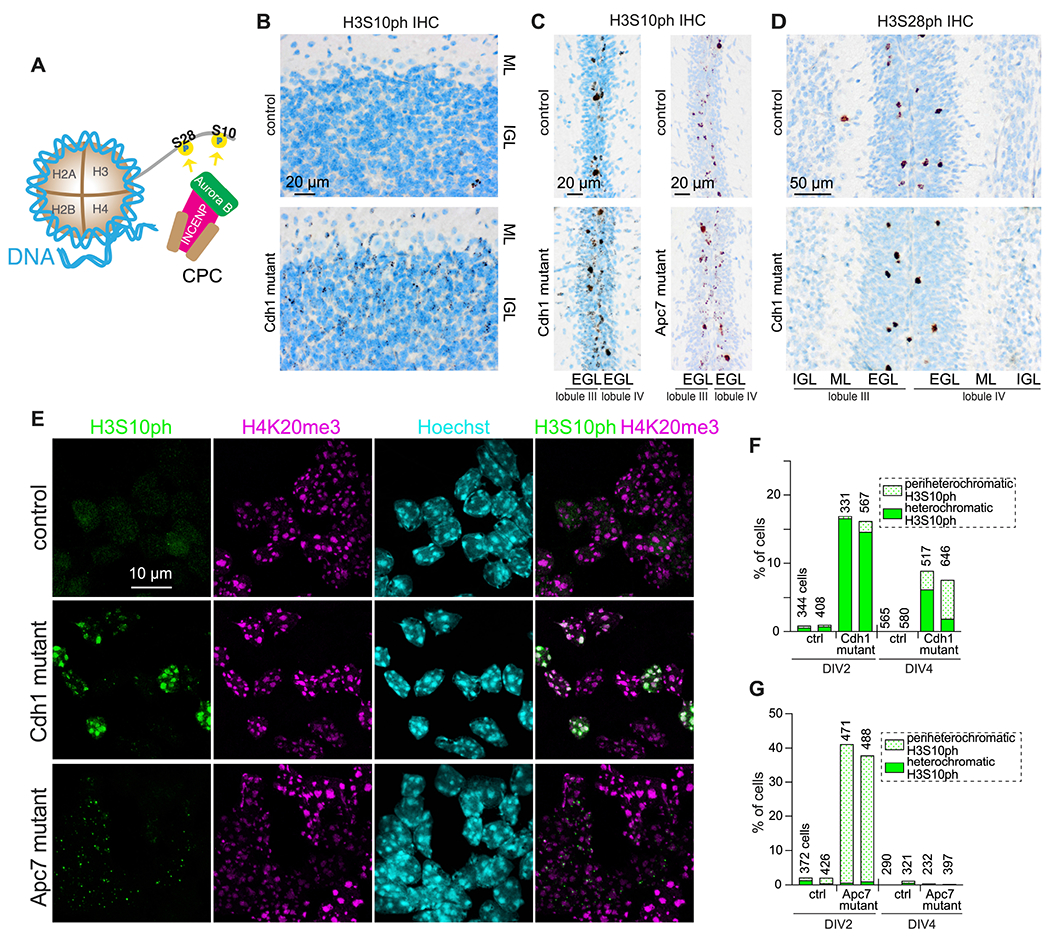
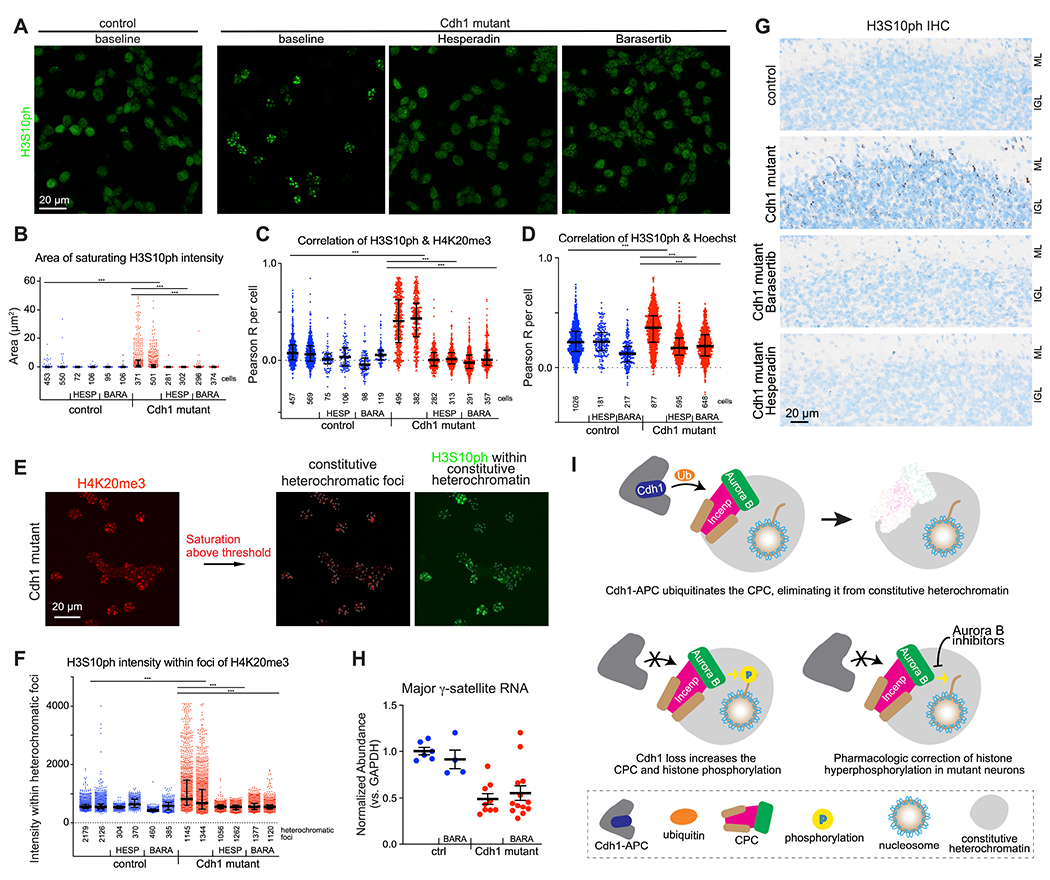
Mutations in the degradative ubiquitin ligase anaphase-promoting complex (APC) alter neurodevelopment by impairing proteasomal protein clearance, but our understanding of their molecular and cellular pathogenesis remains limited. Here, we employ the proteomic-based discovery of APC substrates in APC mutant mouse brain and human cell lines and identify the chromosome-passenger complex (CPC), topoisomerase 2a (Top2a), and Ki-67 as major chromatin factors targeted by the APC during neuronal differentiation. These substrates accumulate in phosphorylated form, suggesting that they fail to be eliminated after mitosis during terminal differentiation. The accumulation of the CPC kinase Aurora B within constitutive heterochromatin and hyperphosphorylation of its target histone 3 are corrected in the mutant brain by pharmacologic Aurora B inhibition. Surprisingly, the reduction of Ki-67, but not H3S10ph, rescued the function of constitutive heterochromatin in APC mutant neurons. These results expand our understanding of how ubiquitin signaling regulates chromatin during neurodevelopment and identify potential therapeutic targets in APC-related disorders.

Keywords: H3S10ph; Ki-67; anaphase-promoting complex; chromatin; chromosome-passenger complex; heterochromatin; neurodevelopment; proteomics/phosphoproteomics; topoisomerase; ubiquitin ligase.


Conflict of interest statement

Declaration of interests The authors declare no competing interests.

Figures

Figure 1:
Figure 1:. Proteomic identification of chromatin regulators as candidate APC substrates in the developing mouse cerebellum.
(A) Schematic of 16-plex Tandem Mass Tag (TMT) quantitative mass spectrometry (MS)-based proteomic evaluation of mouse cerebellum. (B) Volcano plot of relative protein abundance in P8 Cdh1 mutant cerebellum. (C) Heatmap showing the relative abundance of dysregulated proteins in Cdh1 and Apc7 mutant cerebellum. Significant hits were increased by >50% with p-value <0.01 by unpaired two-tailed t-test. (D) Venn diagram of dysregulated proteins in Cdh1 and Apc7 mutant cerebellum. (E) Subunits of the Chromosome Passenger Complex (CPC). (F) Normalized abundance of the CPC and Ki-67 in the Apc7 and Cdh1 mutant cerebellum. Data from TMT-MS proteomics. Error bars, SEM. (G) RT-qPCR analysis of Incenp normalized to GAPDH in nuclear RNA isolated from P10 mouse cerebellum. Error bars, SEM (n = 4 control, n = 5 Cdh1 mutant). Not significant by unpaired two-tailed t-test. (H) RT-qPCR analysis of Aurora B. Error bars, SEM (n = 4 control, n = 5 Cdh1 mutant). Not significant by unpaired two-tailed t-test. (I) Post-mitotic migration of cerebellar granule neurons. (J) Immunohistochemistry (IHC) detection of Aurora B in the cerebellum of P10 mice. (K) Higher magnification of Aurora B IHC. (L) Aurora B IHC in P8 cerebellum. (M) Ki-67 IHC in P10 cerebellum. (N) Top2a IHC in P10 cerebellum. (O) Top2a IHC in the EGL at P10. (P) TMT-MS data for Topoisomerase enzymes in mouse cerebellum. Error bars, SEM. (Q) RT-qPCR analysis of Top2a in nuclear RNA isolated from P10 mouse cerebellum. Error bars, SEM (n = 4 control, n = 5 Cdh1 mutant). Not significant by unpaired two-tailed t-test. (R) Immunoblot (IB) of nuclear lysates isolated from the cerebellum at different ages. (S) IB of cerebellar chromatin fraction at different ages.
Figure 2:
Figure 2:. Aurora B accumulates in association with Ki-67 in APC mutant neurons and Ki-67 controls heterochromatin function.
(A) Immunofluorescence (IF) detection of Aurora B and confocal microscopy of primary mouse cerebellar granule neuron cultures at day 2 in vitro (DIV2). (B) Quantitation of the mean fluorescence intensity for Aurora B on the indicated DIV. Error bars, interquartile range (IQR) (p-values by Kruskal-Wallis [K-W] test with Dunn test). (C) IF detection of Aurora B and Hoechst in Apc7 mutant cultured cerebellar granule neurons (CGN). (D) Quantitation of Aurora B intensity in Apc7 mutant CGN on DIV2 (number of cells shown). Error bars, IQR (p-values by K-W test with Dunn test). (E) IB of CPC components and Ki-67 in biochemical fractions of mouse cerebellum. The endonuclease Benzonase digests chromatin. H3K27me3 is a modified histone protein. Total protein stained with the Revert reagent. (F) IB of chromatin from Apc7 mutant cerebellum. (G) IB of chromatin from Cdc20 mutant cerebellum. (H) Subcellular correlation between Aurora B and Hoechst in Cdh1 mutant CGN on DIV2. The pixel-by-pixel Pearson correlation coefficient (R) was calculated within individual nuclei. Error bars, IQR (p-values by K-W test with Dunn test). (I) Subcellular correlation between Aurora B and Hoechst in Apc7 mutant CGN on DIV2. Error bars, IQR (p-values by K-W test with Dunn test). (J) Isolation of Hoechst-labeled chromocenters in confocal micrographs. (K) Aurora B intensity within chromocenters of Cdh1 mutant CGN on DIV2 (number of chromocenters shown). Error bars, IQR (p-values by K-W test with Dunn test). (L) Aurora B intensity within chromocenters of Apc7 mutant CGN on DIV2. Error bars, IQR (p-values by K-W test with Dunn test). (M) IF Aurora B and H3K9me3 on DIV2. (N) Subcellular correlation of Aurora B and H3K9me3 in DIV2 neurons. Error bars, IQR (p-values by K-W test with Dunn test). (O) IF detection of Aurora B and Ki-67 in CGN on DIV2. (P) Quantitation of cellular correlation by plotting the mean intensity of Ki-67 versus Aurora B in DIV2 CGN. Each data point represents a cell. Linear fit by robust regression, values indicate slope. (Q) Cellular correlation of Ki-67 versus Aurora B in Apc7 mutant CGN on DIV2. Linear fit by robust regression. (R) Subcellular correlation of Aurora B and Ki-67 in Cdh1 mutant CGN. Error bars, IQR (p-values by K-W test with Dunn test). (S) Subcellular correlation of Aurora B and Ki-67 in Apc 7 mutant CGN. Error bars, IQR (p-values by K-W test with Dunn test). (T) RT-qPCR detection of the major γ-satellite repeat RNA in mouse cerebellum. Total cerebellar RNA was treated with DNAse prior to cDNA synthesis, RT-qPCR and normalization to GAPDH. Error bars, SEM (p-values by Kolmogorov–Smirnov [K-S] test). (U) RT-qPCR detection of the major γ-satellite RNA in nuclear RNA isolated from P10 mouse cerebellum. Error bars, SEM (p-values by K-S test). (V) IB analysis of Ki-67 and Apc7 in nuclear lysates from P7 mouse cerebellum. (W) RT-qPCR detection of the major γ-satellite repeat RNA in mouse cerebellum. Mki67 encodes Ki-67. Error bars, SEM (p-values by K-S test).
Figure 3:
Figure 3:. Elevation of neuronal APC substrates in G1-synchronized CDH1 mutant human RPE1 cells.
(T) CDH1 mutant cell lines were generated using two different guide RNAs (gRNAs) targeting FZR1 in RPE1 cells expressing doxycycline-inducible Cas9. Stable lines were derived from isolated clones. Cells were synchronized in G1 by overnight application of 1 μM Palbociclib. (A) CDH1 expression detected by RT-qPCR and normalized to GAPDH. (B) RNA-seq analysis of the FZR1 locus. (C) TMT-MS proteomic analysis CDH1 mutant RPE1 cells. Heatmap depicts the normalized relative abundance of dysregulated proteins. Significantly elevated proteins were increased by >50% with p-value <0.01 by unpaired two-tailed t-test. (D) Schematic diagram showing the enzymatic activity of the CPC kinase AURORA B and its product H3S10ph (histone 3 phosphorylated at Ser10). (E) IB analysis of CPC components and H3S10ph. (F) IF detection of INCENP and H3S10ph. (G) IF detection of KI-67 and H3S10ph. (H) INCENP fluorescence intensity. Error bars, IQR (p-values by K-W test with Dunn test). (I) KI-67 fluorescence intensity. Error bars, IQR (p-values by K-W test with Dunn test). (J) H3S10ph fluorescence intensity. Error bars, IQR (p-values by K-W test with Dunn test). (K) Subcellular correlation of INCENP and H3S10ph. Error bars, IQR (p-values by K-W test with Dunn test). (L) IF detection of INCENP and H3K9me3. (M) IF detection of KI-67 and H3K9me3. (N) Subcellular correlation of INCENP and H3K9me3. Error bars, IQR (p-values by K-W test with Dunn test). (O) Subcellular correlation of KI-67 and H3K9me3. Error bars, IQR (p-values by K-W test with Dunn test). (P) IB of TOP2A. (Q) IF detection of TOP2A and KI-67. (R) TOP2A fluorescence intensity. Error bars, IQR (p-values by K-W test with Dunn test). (S) Cellular correlation of TOP2A versus KI-67. Linear fit by robust regression. (T) Subcellular correlation of TOP2A and KI-67. Error bars, IQR (p-values by K-W test with Dunn test).
Figure 4:
Figure 4:. KI-67 accumulates within nucleoli and constitutive heterochromatin of APC mutant RPE1 cells.
(A) IB of APC7 in mutant RPE1 cell clones. Stable lines were derived from isolated clones after CRISPR targeting of ANAPC7. (B) IF detection of KI-67 and NUCLEOLIN. (C) KI-67 fluorescence intensity. Error bars, IQR (p-values by K-W test with Dunn test). (D) IF detection of KI-67 and NUCLEOLIN. (E) KI-67 fluorescence intensity. Error bars, IQR (p-values by K-W test with Dunn test). (F) Subcellular correlation of KI-67 and NUCLEOLIN. Error bars, IQR (p-values by K-W test with Dunn test). (G) Subcellular correlation of KI-67 and NUCLEOLIN. Error bars, IQR (p-values by K-W test with Dunn test). (H) IF detection of KI-67 and H3K9me3. (I) Subcellular correlation of KI-67 and H3K9me3. Error bars, IQR (p-values by K-W test with Dunn test). (J) IF detection of KI-67 and H3K9me3. (K) Subcellular correlation of KI-67 and H3K9me3. Error bars, IQR (p-values by K-W test with Dunn test). (L) IF detection of INCENP and KI-67. (M) Cellular correlation of INCENP versus KI-67. Linear fit by robust regression. (N) IF detection of AURORA B and KI-67. (O) Cellular correlation of AURORA B versus KI-67. Linear fit by robust regression. (P) Subcellular correlation of INCENP and KI-67. Error bars, IQR (p-values by K-W test with Dunn test). (Q) Subcellular correlation of AURORA B and KI-67. Error bars, IQR (p-values by K-W test with Dunn test). (R) IF detection of H3S10ph and KI-67. (S) Cellular correlation of H3S10ph intensity versus KI-67. Linear fit by robust regression. (T) Subcellular correlation of H3S10ph and KI-67. Error bars, IQR (p-values by K-W test with Dunn test). (U) IF detection of TOP2A and KI-67. (V) Subcellular correlation of TOP2A and KI-67. Error bars, IQR (p-values by K-W test with Dunn test). (W) Cellular correlation of TOP2A intensity versus KI-67. Linear fit by robust regression.
Figure 5:
Figure 5:. Phosphorylation of APC substrates is Aurora B independent.
(A) Schematic of 16-plex TMT-MS–based phosphoproteomic analysis of mouse cerebellum. (B) Volcano plot showing the relative abundance of phosphoproteins in P8 mouse cerebellum. (C) Scaled abundance of phosphorylation sites in ph-Top2a (phosphorylated Top2a) as quantified by TMT phosphoproteomics. Error bars, SEM. (D) Percentile rank of phosphorylation sites in Top2a in control versus Cdh1 mutant. Phosphorylation sites were ordered by scaled abundance before determining their rank within the cerebellar phosphoproteome of each genotype. (E) Scaled abundance of phosphorylation sites in ph-Incenp as quantified by TMT phosphoproteomics. Error bars, SEM. (F) Percentile rank of phosphorylation sites in ph-Incenp. (G) Scaled abundance of phosphorylation sites in ph-Ki-67 as quantified by TMT phosphoproteomics. Error bars, SEM. (H) Percentile rank of phosphorylation sites in ph-Ki-67. (I) Scatter plot showing the change in phosphoproteins versus the underlying proteins in the cerebellum. The x-axis shows the fold change of each underlying protein (Cdh1 mutant/control). The y-axis shows the fold change for each phosphorylation site (Cdh1 mutant/control). (J) Scatter plot showing the change in phosphoproteins versus the underlying proteins in the Apc7 mutant cerebellum. (K) Percentile rank of scaled abundance of ph-TOP2A, ph-INCENP and ph-KI-67 within the phosphoproteome of G1-synchronized Cdh1 mutant RPE1 cells. Multiplexed TMT-MS phosphoproteomic analysis was performed on 3 replicates from each lines. Phosphorylation sites were ordered by scaled abundance. (L) IB of H3S10ph in RPE1 cells under baseline conditions versus Barasertib treatment. Synchronized RPE1 cells were treated with 1 μM Barasertib for 2 hours prior to cell lysis. (M) TMT-MS phosphoproteomic analysis showing scaled abundance of phosphorylation sites in RPE1 cells under baseline conditions versus Barasertib treatment. Synchronized cells were treated with 1 μM Barasertib for 4 hours prior to lysis. Error bars, SEM. (N) TMT-MS phosphoproteomic analysis showing scaled abundance of phosphorylation sites in DIV2 mouse CGN under baseline conditions versus Barasertib treatment. Error bars, SEM.
Figure 6:
Figure 6:. Histone 3 is hyperphosphorylated in post-mitotic APC mutant neurons.
(A) Schematic depiction of the CPC kinase Aurora B and its products H3S10ph and H3S28ph. (B) IHC detection of H3S10ph in P10 mouse cerebellum. (C) IHC of H3S10ph in the EGL of Cdh1 and Apc7 mutants. (D) IHC of H3S28ph in P10 mouse cerebellum. (E) IF detection of H3S10ph and H4K20me3, a modification associated with constitutive heterochromatin, in DIV2 CGN. (F) Fraction of Cdh1 mutant CGN containing H3S10ph foci in a heterochromatic versus periheterochromatic pattern. (G) Analysis of the pattern of H3S10ph foci in Apc7 mutant CGN.
Figure 7:
Figure 7:. Aurora B inhibitors partially rescue chromatin dysregulation in APC mutant neurons.
(A) IF detection of H3S10ph in DIV2 Cdh1 mutant CGN under baseline conditions versus 2 hour treatment with 0.5 μM Hesperadin or 1 μM Barasertib. (B) Saturating area of H3S10ph signal in nuclei under baseline conditions versus drug treatment. Error bars, IQR (p-values by K-W test with Dunn test). *** indicates p-value <10−4. (C) Subcellular correlation of H3S10ph and H4K20me3 in DIV2 CGN under baseline conditions versus drug treated. Error bars, IQR (p-values by K-W test with Dunn test). *** indicates p-value <10−4. (D) Subcellular correlation of H3S10ph and Hoechst in DIV2 CGN. Error bars, IQR (p-values by K-W test with Dunn test). *** indicates p-value <10−4. (E) Isolation of H4K20me3-labeled constitutive heterochromatic foci in confocal photomicrographs. (F) H3S10ph fluorescence intensity within heterochromatic foci. Error bars, IQR (p-values by K-W test with Dunn test) (G) H3S10ph IHC in the Cdh1 mutant cerebellum. P10 mice received subcutaneously injections of either 5 mg/kg Hesperadin or 25 mg/kg Barasertib 4 hours before tissue collection. (H) RT-qPCR detection of the major γ-satellite RNA in mouse cerebellum. Treated mice received 30 mg/kg Barasertib daily from P8 to P11 before collecting tissue 4 hours later on P11. (I) Schematic depiction showing the regulation of H3S10ph by Cdh1-APC and the potential therapeutic role for Aurora B inhibitors upon CPC dysregulation.

References

    1. Dikic I. (2017). Proteasomal and autophagic degradation systems. Annu. Rev. Biochem 86, 193–224. - PubMed
    1. Pohl C & Dikic I (2019). Cellular quality control by the ubiquitin-proteasome system and autophagy. Science. 366, 818–822. - PubMed
    1. Deshaies RJ & Joazeiro CAP (2009). RING domain E3 ubiquitin ligases. Annu. Rev. Biochem 78, 399–434. - PubMed
    1. Chiurazzi P & Pirozzi F (2016). Advances in understanding – genetic basis of intellectual disability. F1000Research 5, 599. - PMC - PubMed
    1. Buiting K, Williams C & Horsthemke B (2016). Angelman syndrome-insights into a rare neurogenetic disorder. Nat. Rev. Neurol 12, 584–593. - PubMed

Publication types