

Molecular geometric deep learning
- PMID: 37875121
- PMCID: PMC10694498
- DOI: 10.1016/j.crmeth.2023.100621
Molecular geometric deep learning
Abstract
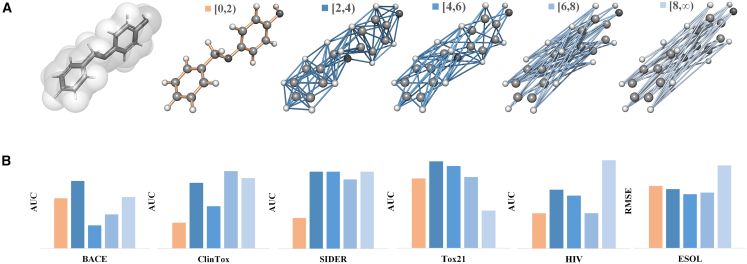
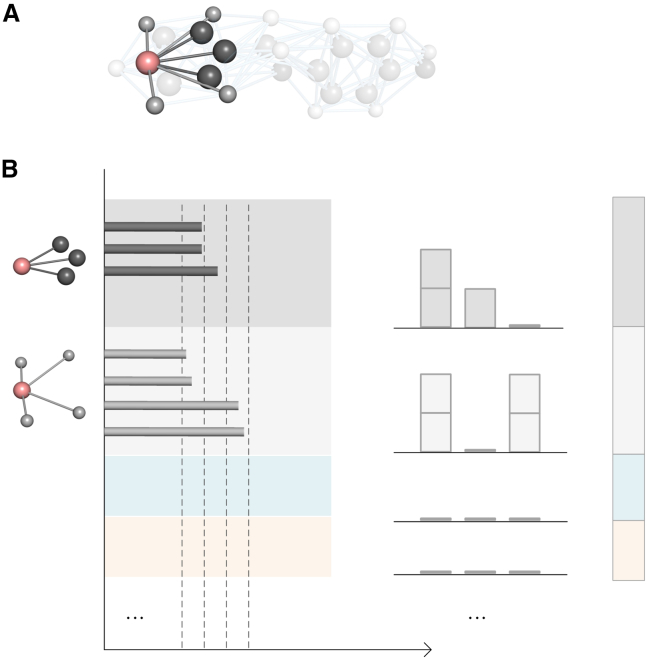
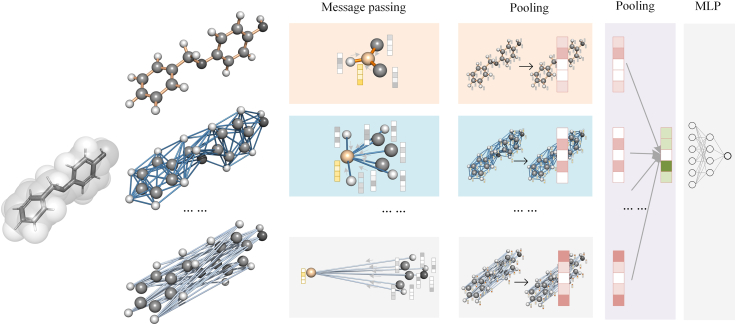
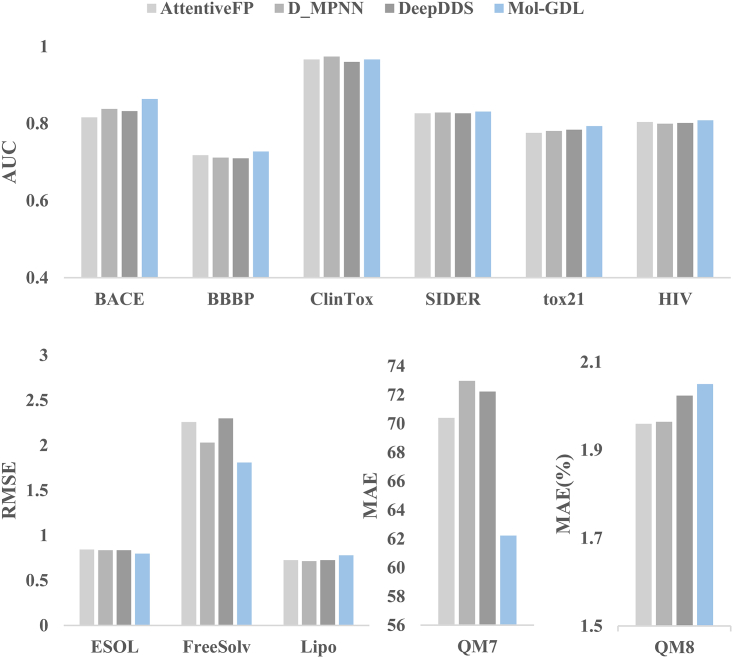
Molecular representation learning plays an important role in molecular property prediction. Existing molecular property prediction models rely on the de facto standard of covalent-bond-based molecular graphs for representing molecular topology at the atomic level and totally ignore the non-covalent interactions within the molecule. In this study, we propose a molecular geometric deep learning model to predict the properties of molecules that aims to comprehensively consider the information of covalent and non-covalent interactions of molecules. The essential idea is to incorporate a more general molecular representation into geometric deep learning (GDL) models. We systematically test molecular GDL (Mol-GDL) on fourteen commonly used benchmark datasets. The results show that Mol-GDL can achieve a better performance than state-of-the-art (SOTA) methods. Extensive tests have demonstrated the important role of non-covalent interactions in molecular property prediction and the effectiveness of Mol-GDL models.
Keywords: CP: Molecular biology; CP: Systems biology; geometric deep learning; graph neural network; molecular property prediction.
Copyright © 2023 The Author(s). Published by Elsevier Inc. All rights reserved.
Conflict of interest statement
Declaration of interests The authors declare no competing interests.
Figures

Similar articles
-
Geometric Molecular Graph Representation Learning Model for Drug-Drug Interactions Prediction.IEEE J Biomed Health Inform. 2024 Dec;28(12):7623-7632. doi: 10.1109/JBHI.2024.3453956. Epub 2024 Dec 5. IEEE J Biomed Health Inform. 2024. PMID: 39226203
-
Geometry-Augmented Molecular Representation Learning for Property Prediction.IEEE/ACM Trans Comput Biol Bioinform. 2024 Sep-Oct;21(5):1518-1528. doi: 10.1109/TCBB.2024.3402337. Epub 2024 Oct 9. IEEE/ACM Trans Comput Biol Bioinform. 2024. PMID: 38758624
-
LGGA-MPP: Local Geometry-Guided Graph Attention for Molecular Property Prediction.J Chem Inf Model. 2024 Apr 22;64(8):3105-3113. doi: 10.1021/acs.jcim.3c02058. Epub 2024 Mar 22. J Chem Inf Model. 2024. PMID: 38516950
-
Data Integration Using Advances in Machine Learning in Drug Discovery and Molecular Biology.Methods Mol Biol. 2021;2190:167-184. doi: 10.1007/978-1-0716-0826-5_7. Methods Mol Biol. 2021. PMID: 32804365 Review.
-
A Comprehensive Survey on Deep Graph Representation Learning.Neural Netw. 2024 May;173:106207. doi: 10.1016/j.neunet.2024.106207. Epub 2024 Feb 27. Neural Netw. 2024. PMID: 38442651 Review.
Cited by
-
GraphADT: empowering interpretable predictions of acute dermal toxicity with multi-view graph pooling and structure remapping.Bioinformatics. 2024 Jul 1;40(7):btae438. doi: 10.1093/bioinformatics/btae438. Bioinformatics. 2024. PMID: 38967119 Free PMC article.
-
Multi-Cover Persistence (MCP)-based machine learning for polymer property prediction.Brief Bioinform. 2024 Sep 23;25(6):bbae465. doi: 10.1093/bib/bbae465. Brief Bioinform. 2024. PMID: 39323091 Free PMC article.
References
-
- Zhang L., Tan J., Han D., Zhu H. From machine learning to deep learning: progress in machine intelligence for rational drug discovery. Drug Discov. Today. 2017;22:1680–1685. - PubMed
-
- Chen H., Engkvist O., Wang Y., Olivecrona M., Blaschke T. The rise of deep learning in drug discovery. Drug Discov. Today. 2018;23:1241–1250. - PubMed
-
- Mak K.K., Pichika M.R. Artificial intelligence in drug development: present status and future prospects. Drug Discov. Today. 2019;24:773–780. - PubMed
-
- Chan H.C.S., Shan H., Dahoun T., Vogel H., Yuan S. Advancing drug discovery via artificial intelligence. Trends Pharmacol. Sci. 2019;40 801–604. - PubMed
-
- Puzyn T., Leszczynski J., Cronin M.T., editors. Recent Advances in QSAR Studies: Methods and Applications. vol. 8. Springer Science & Business Media; 2010.
Publication types
MeSH terms
LinkOut - more resources
Full Text Sources
Miscellaneous
