. 2023 Oct 24;14(1):6756.
doi: 10.1038/s41467-023-41820-7.

Integrated radiogenomics models predict response to neoadjuvant chemotherapy in high grade serous ovarian cancer

Affiliations

Integrated radiogenomics models predict response to neoadjuvant chemotherapy in high grade serous ovarian cancer

Mireia Crispin-Ortuzar et al. Nat Commun. .

Abstract

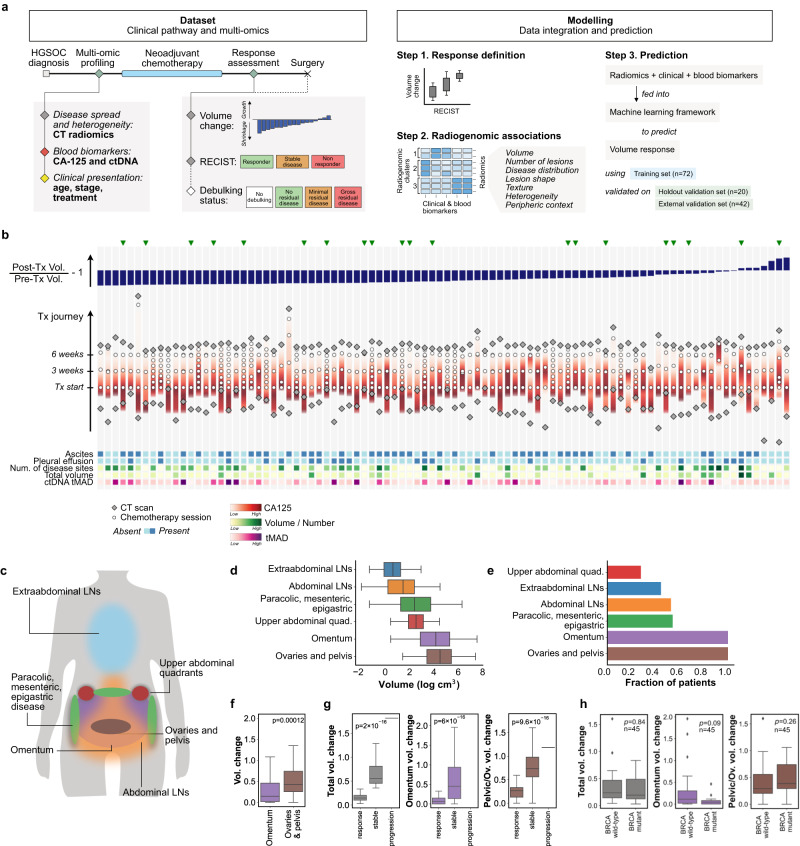
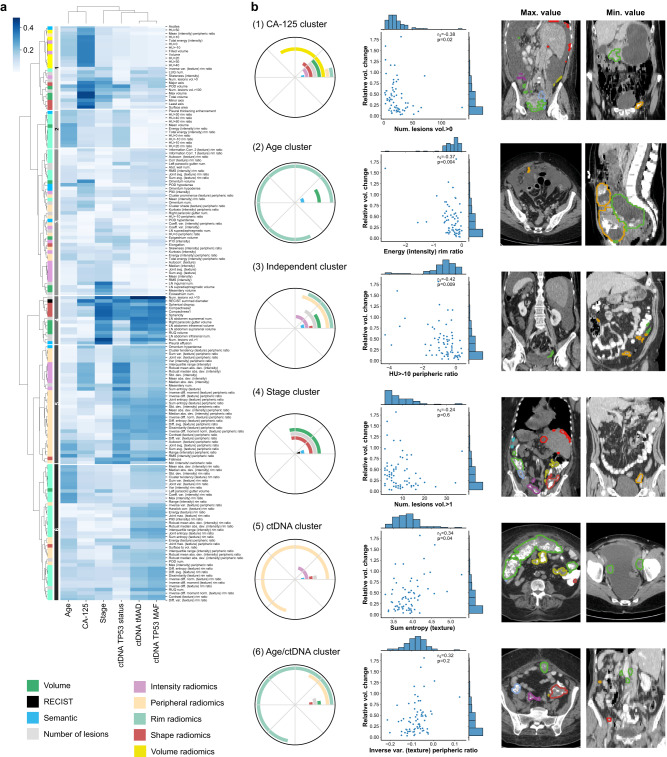
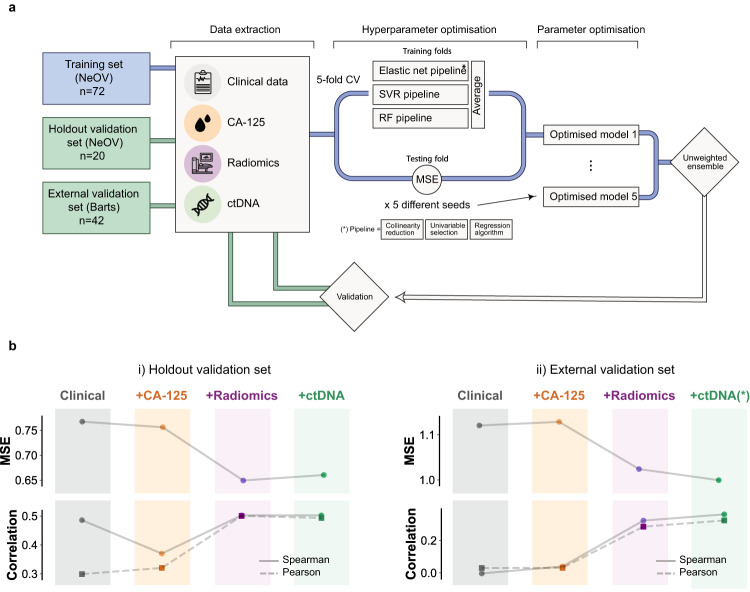
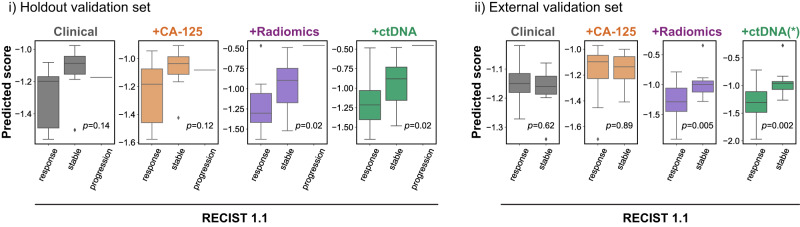
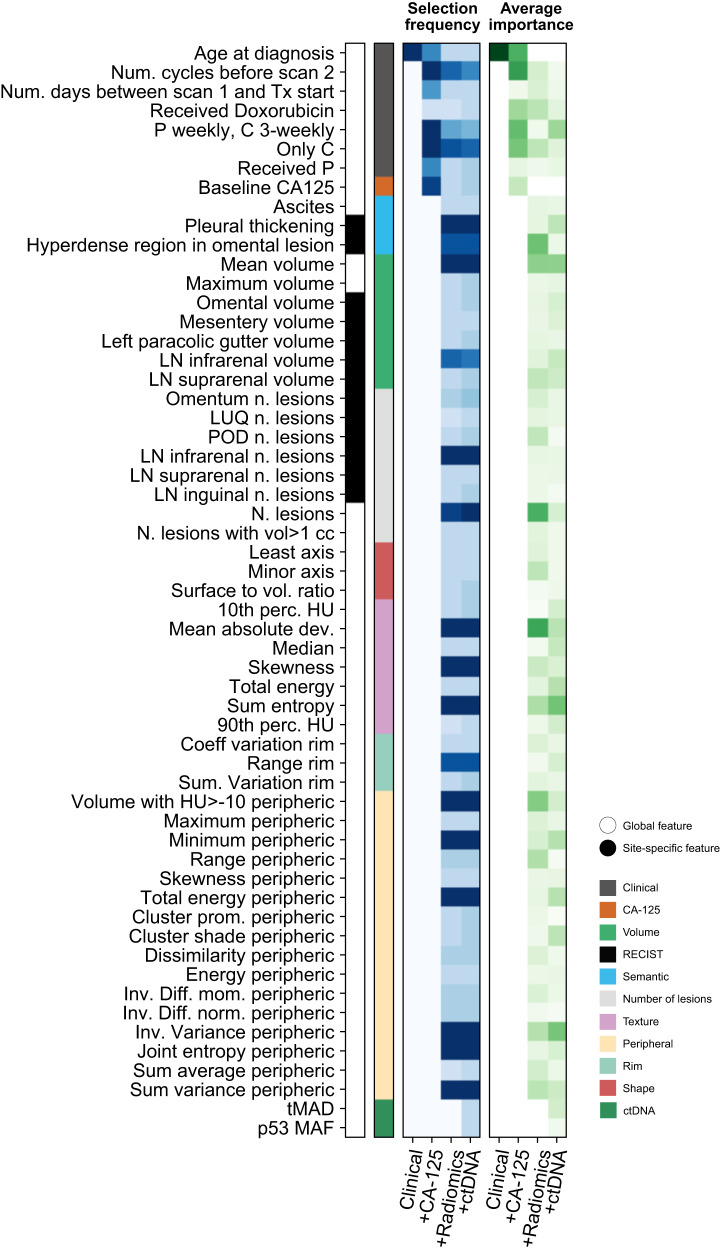
High grade serous ovarian carcinoma (HGSOC) is a highly heterogeneous disease that typically presents at an advanced, metastatic state. The multi-scale complexity of HGSOC is a major obstacle to predicting response to neoadjuvant chemotherapy (NACT) and understanding critical determinants of response. Here we present a framework to predict the response of HGSOC patients to NACT integrating baseline clinical, blood-based, and radiomic biomarkers extracted from all primary and metastatic lesions. We use an ensemble machine learning model trained to predict the change in total disease volume using data obtained at diagnosis (n = 72). The model is validated in an internal hold-out cohort (n = 20) and an independent external patient cohort (n = 42). In the external cohort the integrated radiomics model reduces the prediction error by 8% with respect to the clinical model, achieving an AUC of 0.78 for RECIST 1.1 classification compared to 0.47 for the clinical model. Our results emphasize the value of including radiomics data in integrative models of treatment response and provide methods for developing new biomarker-based clinical trials of NACT in HGSOC.


Conflict of interest statement

F.Mo., D.C., A.P., J.D.B. and N.R. are inventors of the patent “Enhanced detection of target DNA by fragment size analysis” (WO/2020/094775). N.R. and J.D.B. are inventors of the patent “TAm-Seq v2 method for ctDNA estimation” (WO 2016/009224A1). T.G. is an employee of and owns shares from AstraZeneca. F.Ma. and J.D.B. are founders and directors of Tailor Bio Ltd and own shares in Tailor Bio Ltd. J.D.B. has received honoraria and personal payments from AstraZeneca, GSK and Clovis Oncology. M.C.O. has received honoraria from GSK. E.S. is co-founder and shareholder of Lucida Medical Ltd. L.R. has received consulting fees from Lucida Medical Ltd. The remaining authors declare no competing interests.

Figures

Fig. 1
Fig. 1. Structure of the study and main characteristics of the training cohort.
a Key time points and variables in the dataset (left) and steps of the modelling strategy (right). See also Supplementary Fig. S1 for additional information. b Treatment courses of all 92 patients in the NeOV cohort, ordered by decreasing volumetric tumour response following NACT. Patients analysed in the hold-out validation set were randomly selected and are indicated with a green triangle. Treatment journeys progress vertically (bottom to top) and are aligned at the time of the first chemotherapy cycle. Additional biomarkers obtained at baseline are depicted in the bottom heatmap. c Sites of primary and metastatic disease in HGSOC. d Distribution of tumour volumes by site for patients in the training cohort. e Distribution of tumour sites by patient. f Volume changes of the omental and pelvic/ovarian disease for all patients in the training cohort. p value obtained from the two-sided Mann-Whitney U test. g Total and site-specific volume change stratified by RECIST 1.1 response status for the training cohort. p value obtained from the point biserial correlation coefficient, two-tailed. h Total and site-specific volume change stratified by BRCA mutation status. These figures are restricted to the n = 45 patients in the training cohort for whom the BRCA mutation status was known. p value obtained from the two-sided Mann-Whitney U test. Boxes indicate the upper and lower quartiles, with a line at the median. Outliers are shown as circles and identified via the interquantile range rule. Source data are provided as a Source Data file.
Fig. 2
Fig. 2. Analysis of the correlations between radiomics and non-imaging features.
a Spearman correlation coefficients between imaging (rows) and clinical and biological features (columns), both clustered using a hierarchical approach, using the training cohort. b Composition and characteristics of the six identified imaging feature clusters. Polar plots indicate the relative contribution of the different classes of imaging features. Scatter plots show the feature of each cluster with the highest Spearman correlation with volumetric treatment response. Each features is illustrated by displaying one slice from the patient with the maximum value (left), and one from the patient with the minimum value (right). Source data are provided as a Source Data file. p values are two-sided and corrected for multiple comparisons.
Fig. 3
Fig. 3. Training scheme and validation results for the IRON machine learning framework.
a Schematic of the machine learning framework for model training and validation. b Validation of the discriminative power of predictive models in the hold-out (left) and external validation cohorts (right), for models containing, from left to right, clinical, clinical+CA-125, clinical+CA-125+radiomics, and clinical+CA-125+radiomics+ctDNA features, respectively. The metrics are mean square error (MSE, top) and Spearman (continuous) or Pearson (dashed) correlation (bottom). The magnitude of the mean squared error (MSE) is comparable to the standard deviation of the volumetric response (Supplementary Table S9). ctDNA values in the external validation cohort were imputed using training set averages. Source data are provided as a Source Data file.
Fig. 4
Fig. 4. Using the IRON framework to predict responding, stable and progressive disease according to RECIST 1.1.
Validation of the ability of predictive models to describe RECIST 1.1 response in the hold-out (left, n = 20) and external (right, n = 42) validation cohorts, for models containing, respectively, clinical, clinical+CA-125, clinical+CA-125+radiomics, and clinical+CA-125+radiomics+ctDNA features. Boxes indicate the upper and lower quartiles, with a line at the median. Outliers are shown as circles and identified via the interquantile range rule. p values are obtained using the point biserial coefficient and are two-tailed. ctDNA values in the external validation cohort were imputed using training set averages. Source data are provided as a Source Data file.
Fig. 5
Fig. 5. Feature importances in the fully integrated IRON radiogenomic model.
Importances of the features used by the predictive models. The first (blue) heatmap illustrates the selection frequency. The heatmap shows the number of times that a given feature was selected in a model. The different columns correspond to different models with increasing, cumulative numbers of input features. As the optimisation is repeated five times, the range of the selection frequency is 0–15 (three algorithms in the ensemble times five repetitions). The first (green) heatmap illustrates the averaged, normalised feature importances for the elastic net and random forest components of the models. Importances are defined from the feature coefficients for the elastic net regression, and from impurity-based Gini importances for random forest. Source data are provided as a Source Data file.

References

    1. Vergote I, et al. Neoadjuvant chemotherapy or primary surgery in stage IIIC or IV ovarian cancer. N. Engl. J. Med. 2010;363:943–953. - PubMed
    1. Kehoe S, et al. Primary chemotherapy versus primary surgery for newly diagnosed advanced ovarian cancer (CHORUS): An open-label, randomised, controlled, non-inferiority trial. Lancet. 2015;386:249–257. - PubMed
    1. Clamp AR, et al. Weekly dose-dense chemotherapy in first-line epithelial ovarian, fallopian tube, or primary peritoneal carcinoma treatment (ICON8): primary progression free survival analysis results from a GCIG phase 3 randomised controlled trial. Lancet. 2019;394:2084–2095. - PMC - PubMed
    1. Van Meurs HS, et al. Which patients benefit most from primary surgery or neoadjuvant chemotherapy in stage IIIC or IV ovarian cancer? An exploratory analysis of the European Organisation for Research and Treatment of Cancer 55971 randomised trial. Eur. J. Cancer. 2013;49:3191–3201. - PubMed
    1. Meyer LA, et al. Use and effectiveness of neoadjuvant chemotherapy for treatment of ovarian cancer. J. Clin. Oncol. 2016;34:3854–3863. - PMC - PubMed

Publication types

Substances