Clinical Trial
. 2023 Oct 24;14(1):6761.
doi: 10.1038/s41467-023-42400-5.

Nivolumab and ipilimumab in recurrent or refractory cancer of unknown primary: a phase II trial

Affiliations
Clinical Trial

Nivolumab and ipilimumab in recurrent or refractory cancer of unknown primary: a phase II trial

Maria Pouyiourou et al. Nat Commun. .

Abstract

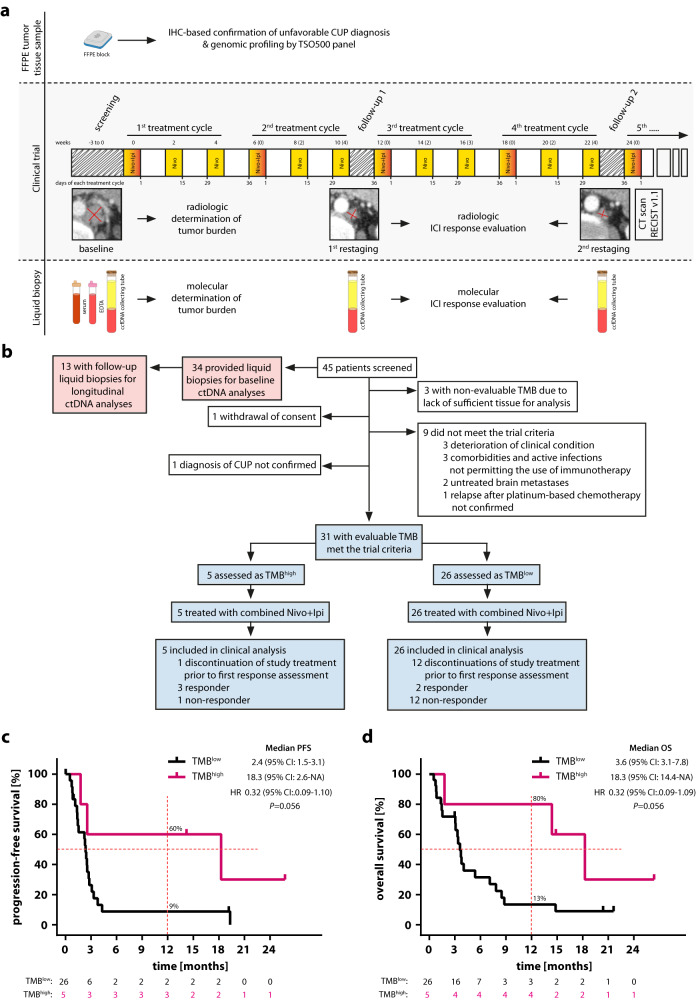
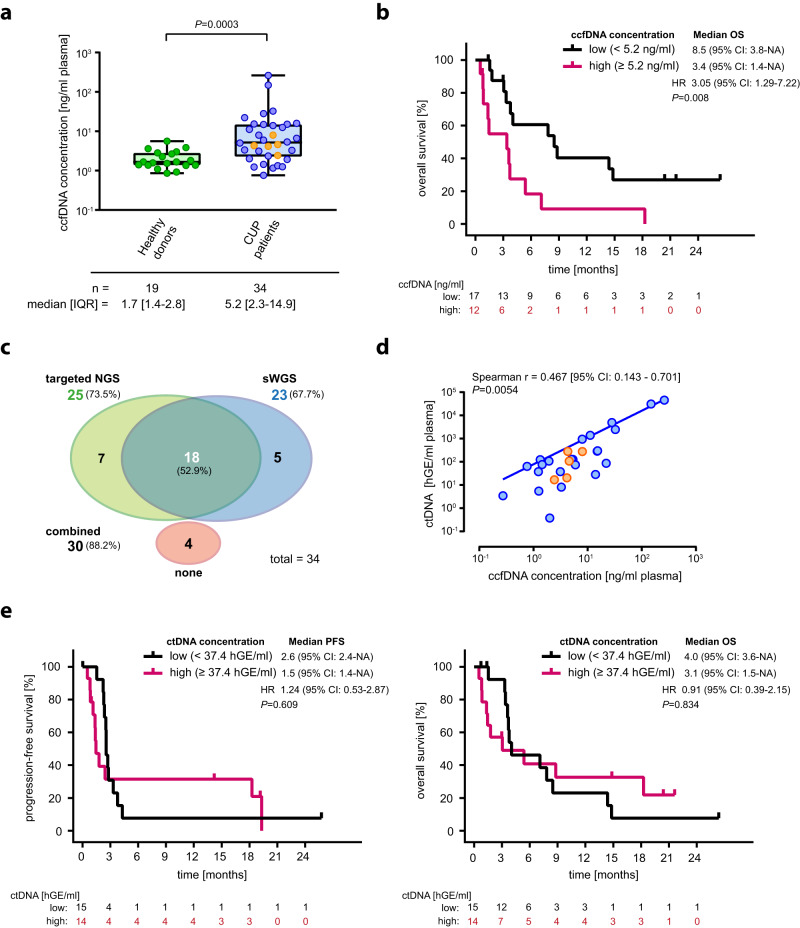
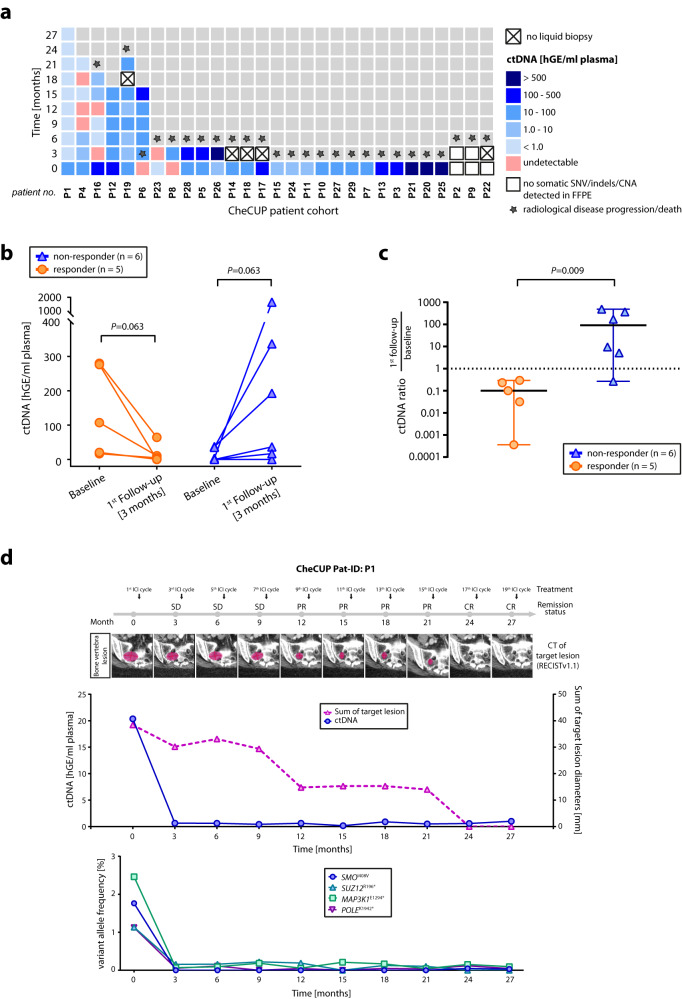
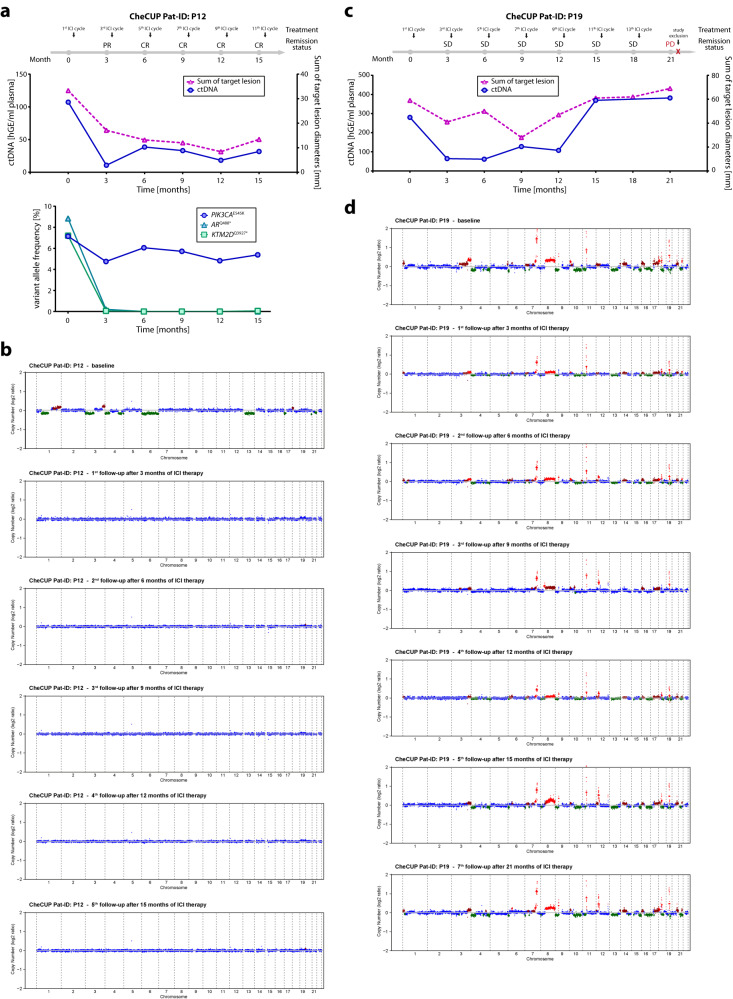
Cancer of unknown primary has a dismal prognosis, especially following failure of platinum-based chemotherapy. 10-20% of patients have a high tumor mutational burden (TMB), which predicts response to immunotherapy in many cancer types. In this prospective, non-randomized, open-label, multicenter Phase II trial (EudraCT 2018-004562-33; NCT04131621), patients relapsed or refractory after platinum-based chemotherapy received nivolumab and ipilimumab following TMBhigh vs. TMBlow stratification. Progression-free survival (PFS) represented the primary endpoint; overall survival (OS), response rates, duration of clinical benefit and safety were the secondary endpoints. The trial was prematurely terminated in March 2021 before reaching the preplanned sample size (n = 194). Among 31 evaluable patients, 16% had a high TMB ( > 12 mutations/Mb). Overall response rate was 16% (95% CI 6-34%), with 7.7% (95% CI 1-25%) vs. 60% (95% CI 15-95%) in TMBlow and TMBhigh, respectively. Although the primary endpoint was not met, high TMB was associated with better median PFS (18.3 vs. 2.4 months) and OS (18.3 vs. 3.6 months). Severe immune-related adverse events were reported in 29% of cases. Assessing on-treatment dynamics of circulating tumor DNA using combined targeted hotspot mutation and shallow whole genome sequencing as part of a predefined exploratory analysis identified patients benefiting from immunotherapy irrespective of initial radiologic response.


Conflict of interest statement

M.S. received consultation fees and honoraria from BMS. B.K. received grants/research support from Roche, Morphosys, MSD and Hexal, and honoraria from Roche. U.T.H. received grants/research support from Celgene and Roche, and honoraria from Roche, Servier, Novartis and Merck Serono. G.H. received consultation fees from Roche and AstraZeneca, and honoraria from Roche, Amgen, Pierre-Fabre, AstraZeneca, Alexion, Servier, Octapharma, Abbvie, GSK and Beigene. L.W. received honoraria from Roche and Servier and travel support from Amgen. M.B. received consultation fees from Roche, Incyte, Bayer, MSD and Ipsen. A.S. received grants/research support from Bayer, BMS, Chugai and Incyte, and consultation fees/honoraria from Aignostics, Amgen, Astra Zeneca, Bayer, BMS, Eli Lilly, Illumina, Incyte, Janssen, MSD, Novartis, Pfizer, Qlucore, Roche, Seattle Genetics, Takeda and Thermo Fisher. T.B. has worked as a study oncologist for the CUPISCO trial, which is sponsored by Roche and has received reimbursement for study-related travels as well as remuneration for his work as a study oncologist for the benefit of his employer. A.K. received consultation fees and honoraria from Roche and grants/research support from BMS and Molecular Health. All remaining authors declare no competing interests.

Figures

Fig. 1
Fig. 1. High TMB is predictive of clinical outcome after combined administration of nivolumab and ipilimumab in patients with recurrent or refractory unfavorable CUP.
a CheCUP trial design. Patients with recurrent or refractory unfavorable CUP provided tumor samples to specify TMB by comprehensive genomic profiling and underwent baseline CT scan of the neck, chest and abdomen. Patients enrolled in the CheCUP trial had at least one measurable lesion according to RECIST v1.1. All patients who met study criteria received nivolumab (240 mg) every two weeks and ipilimumab (1 mg/kg) every six weeks until disease progression. Response to ICI treatment was evaluated by the trial radiologists according to RECIST v1.1 at follow-up visits every second treatment cycle. If patients consented to translational research, liquid biopsy samples (serum, whole blood for PBMNCs and plasma isolation) suitable for ctDNA analyses were collected in parallel with radiological assessment. b Schematic outlining of patient enrollment and specimens involved in this study. The CheCUP trial cohort (blue) was stratified as either TMBhigh or TMBlow based on a TMB cut-off of 12 mutations/Mb following comprehensive genomic profiling of tumor tissue. The translational research cohort (red) provided liquid biopsy samples for on-treatment ctDNA analyses. Kaplan-Meier estimates of (c) PFS and (d) OS, stratified according to patient’s TMB status: TMBhigh (n = 5) and TMBlow (n = 26). Crosses denote censored observations, and for each time interval the number of patients at risk are indicated below the plots. Comparisons were made using a two-sided log-rank test, Cox proportional hazard regression modeling was used to calculate hazard ratio. The horizontal dashed lines mark the median values, the vertical dashed lines the one-year values. 95% CI, 95% confidence interval; HR, hazard ratio. Source data are provided as a Source Data file.
Fig. 2
Fig. 2. High metastasis burden and high ECOG status were associated with increasing risk for progression and death.
Kaplan-Meier estimates of (a) PFS and (b) OS, classified according to low (n = 10), intermediate (n = 10) and high (n = 11) metastasis burden score. Kaplan-Meier estimates of (c) PFS and (d) OS, classified according to ECOG performance status: 0 (n = 12), 1 (n = 16) and 2 (n = 3). Kaplan-Meier estimates of (e) PFS and (f) OS, classified according to number of previous chemotherapy lines: 1 (n = 14) versus 2–5 (n = 17). Comparisons are made using a two-sided log-rank test, Cox proportional hazard regression modeling was used to calculate hazard ratio. 95% CI, 95% confidence interval; HR, hazard ratio; ECOG Eastern Cooperative Oncology Group. Source data are provided as a Source Data file.
Fig. 3
Fig. 3. Baseline genomic landscape of the CheCUP cohort revealed that patients with activated Ras signaling and/or functionally deleterious TP53 did not benefit from ICI treatment.
a Oncoplot showing potentially clinically relevant tumor gene alterations (SNVs/indels, gene deletions and amplifications) as assessed by comprehensive genomic profiling of baseline biopsy samples. Curated pathways and selected genes altered in 10% or more patients are shown. A column represents a patient and is grouped by the best response (indicated by vertical dashed lines) and related clinicopathologic features (n = 29); gray shaped columns indicate patients where an unambiguous CNA profile statement was impossible. Top bar chart represents tumor mutational burden (TMB). Percentages listed right represent the proportion of patients harboring an alteration in the gene listed left. Bottom bars show radiological response assessment, heatmaps of PFS and OS (both in months, censored patients marked with dots), CUP histology, ECOG status, number of therapy lines prior to ICI treatment, number of organs with metastases, heatmap of metastasis burden score (MBS), and PD-L1 expression status. b Kaplan-Meier estimates of PFS and OS, stratified according to activating RAS alterations: activated (n = 9) and wild-type (n = 20). c Kaplan-Meier estimates of PFS and OS, stratified according to functionally deleterious TP53 alterations: deleterious (n = 11) and wild-type (n = 18). d Kaplan-Meier estimates of PFS and OS, stratified according to low (n = 11) or high (n = 8) aneuploidy score (AS) of baseline FFPE tumor tissue, based on the median cohort AS value of 9. In (b-d), comparisons are made using a two-sided log-rank test, Cox proportional hazard regression modeling was used to calculate hazard ratio. 95% CI 95% confidence interval, HR hazard ratio, CR complete response, PR partial response, SD stable disease, PD progressive disease, FFPE formalin-fixed paraffin-embedded, AS aneuploidy score, NE not evaluable, ND not determined. Source data are provided as a Source Data file.
Fig. 4
Fig. 4. Elevated baseline ccfDNA but not ctDNA is prognostic for inferior overall survival and ICI response in patients with recurrent/refractory unfavorable CUP.
a Baseline ccfDNA concentrations of healthy individuals (n = 19) and patients with recurrent or relapsed unfavorable CUP (n = 34). Each dot represents a single healthy individual or CUP patient, respectively; orange dots indicate CUP patients who radiologically respond to ICI treatment. The box contains the 25th to 75th percentiles of the dataset, a vertical line denotes the median value. The whiskers go from first or third quartile to the minimum or maximum values, respectively. An exact p-value (p = 0.0003) was calculated using a two-tailed Mann–Whitney U test. Of note, the y-axis is in log-scale for display purpose only. b Kaplan-Meier estimate of OS, stratified according to high (n = 12) or low (n = 17) ccfDNA based on a ccfDNA concentration cut-off of 5.2 ng/ml plasma. c The efficiency of the combined targeted/sWGS sequencing strategy in detecting ctDNA in blood samples of CUP patients. d Scatter plot of baseline ccfDNA concentration versus baseline ctDNA content of unfavorable CUP patients (n = 34). Each dot represents a single patient; orange dots indicate CUP patients who radiologically respond to ICI treatment. Correlation analyses were performed based on Spearman’s correlation coefficient; a regression line was fitted. Of note, the log-log axes are for display purpose only. e Kaplan-Meier estimates of PFS and OS, according to high (n = 14) or low (n = 15) ctDNA based on a ctDNA level cut-off of 37.4 hGE/ml plasma. In (b, e), crosses denote censored observations, and for each time interval the number of patients at risk are indicated below the plots. Comparisons are made using a two-sided log-rank test, Cox proportional hazard regression modeling was used to calculate hazard ratio. 95% CI 95% confidence interval, HR hazard ratio, IQR interquartile range, hGE haploid genome equivalent. Source data are provided as a Source Data file.
Fig. 5
Fig. 5. The benefit of longitudinal ctDNA monitoring parallel to radiological assessment in patients with recurrent/refractory unfavorable CUP.
a Time-measured ctDNA content of each CheCUP patient determined by combined ultra-deep targeted NGS of patient-specific hotspot mutations and sWGS-based CNA profiling in serially collected plasma samples during ICI treatment. b Change in ctDNA level in paired baseline and first follow-up plasma samples after three months of ICI treatment of responding (orange, n = 5) and non-responding (blue, n = 6) patients, respectively. Each dot/triangle represents a single CUP patient. Comparisons between baseline and first follow-up samples of the same patient were made using a two-tailed Wilcoxon matched-pairs signed rank test. All p-values are exact. c Comparison between the molecular response of radiologically responding (orange, n = 5) and non-responding patients (blue, n = 6). The molecular response was calculated as ratio of first follow-up to baseline ctDNA content. Each dot/triangle represents the molecular response of a single patient; bold horizontal bars indicate the median values ±95% confidence interval; a dashed horizontal line indicates the cut-off predicting response and outcome. The comparison between the median of radiologically responding and non-responding was made using a two-tailed Mann–Whitney U test. Of note, the y-axis is in log-scale for display purpose only. d Representative case (CheCUP patient P1) exemplifying the utility of ctDNA analyses in monitoring ICI response in parallel to radiological assessment. Upper graph: Comparison of ctDNA level in serial collected plasma sample with the measured sum of target lesion diameters by RECIST v1.1. during combined nivolumab/ipilimumab administration. Lower graph: Dynamic tracking of VAF from single somatic tumor mutations in ctDNA. hGE haploid genome equivalent. Source data are provided as a Source Data file.
Fig. 6
Fig. 6. Both targeted NGS of patient-specific hotspot mutations and tumor-specific CNA profiling by sWGS predicted ICI resistance/disease progression several months prior to radiological relapse.
a, b Monitoring of tumor burden and ctDNA changes in a case (CheCUP patient P12) with a stable detected PIK3CA p.E545K ICI-associated resistance mutation by targeted NGS. a Upper graph: Comparison of ctDNA level in serial collected plasma samples with the measured sum of target lesion diameters by RECIST v1.1. Despite radiological complete response, on-treatment ctDNA analyses by targeted NGS detected subliminal amount of ctDNA. hGE, haploid genome equivalent. Lower graph: Detection of a subclonal PIK3CA-p.E545K ICI-associated resistance mutation by dynamic tracking of VAF from single somatic tumor mutations. b Genome-wide CNA profiles inferred from sWGS were consistent with radiological response assessment. Chromosome regions in shades of red indicate CNA gains, regions in green CNA losses. c, d Monitoring of tumor burden and ctDNA changes in a case (CheCUP patient P19) with an unique heterozygous germline mutation CHEK2 p.T476M. c Comparison of ctDNA level, measured by sWGS-based CNA profiling, with the sum of target lesion diameters, measured by RECIST v1.1. ctDNA changes preceded clinical progression, while the disease was still radiologically stable. d Genome-wide CNA profiles showed that after initiation of ICI therapy, CNA changes became less evident in the initial phase of stable disease but increased significantly six months before radiological disease progression. Chromosome regions in shades of red indicate CNA gains, regions in green CNA losses; hGE haploid genome equivalent. Source data are provided as a Source Data file.

References

    1. Krämer, A. et al. Cancer of unknown primary: ESMO clinical practice guideline for diagnosis, treatment and follow-up. Ann. Oncol.34, 228–246 (2023). - PubMed
    1. Culine S, et al. Cisplatin in combination with either gemcitabine or irinotecan in carcinomas of unknown primary site: Results of a randomized phase II study-trial for the French Study Group on Carcinomas of Unknown Primary (GEFCAPI 01) J. Clin. Oncol. 2003;21:3479–3482. - PubMed
    1. Fizazi, K. et al. A phase III trial of empiric chemotherapy with cisplatin and gemcitabine or systemic treatment tailored by molecular gene expression analysis in patients with carcinomas of an unknown primary (CUP) site (GEFCAPI 04). Ann. Oncol.10.1093/annonc/mdz394 (2019).
    1. Folprecht G, et al. Adding cetuximab to paclitaxel and carboplatin for first-line treatment of carcinoma of unknown primary (CUP): results of the Phase 2 AIO trial PACET-CUP. Br. J. Cancer. 2021;124:721–727. - PMC - PubMed
    1. Gross-Goupil M, et al. Cisplatin alone or combined with gemcitabine in carcinomas of unknown primary: Results of the randomised GEFCAPI 02 trial. Eur. J. Cancer. 2012;48:721–727. - PubMed

Publication types

MeSH terms