

Obstetric operating room staffing and operating efficiency using queueing theory
- PMID: 37875897
- PMCID: PMC10599054
- DOI: 10.1186/s12913-023-10143-0
Obstetric operating room staffing and operating efficiency using queueing theory
Abstract
Introduction: Strategies to achieve efficiency in non-operating room locations have been described, but emergencies and competing priorities in a birth unit can make setting optimal staffing and operation benchmarks challenging. This study used Queuing Theory Analysis (QTA) to identify optimal birth center operating room (OR) and staffing resources using real-world data.
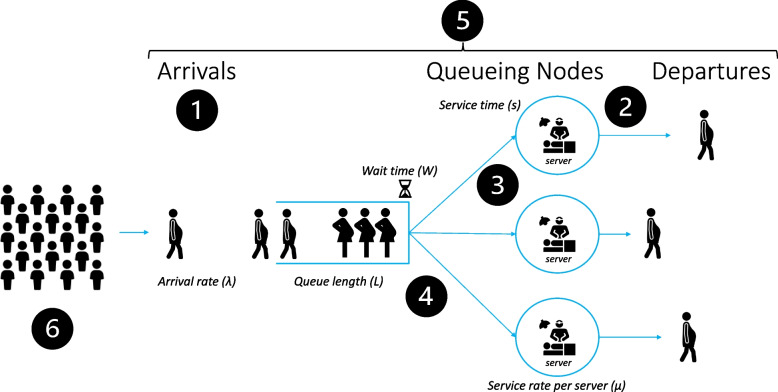
Methods: Data from a Level 4 Maternity Center (9,626 births/year, cesarean delivery (CD) rate 32%) were abstracted for all labor and delivery operating room activity from July 2019-June 2020. QTA has two variables: Mean Arrival Rate, λ and Mean Service Rate µ. QTA formulas computed probabilities: P0 = 1-(λ/ µ) and Pn = P0 (λ/µ)n where n = number of patients. P0…n is the probability there are zero patients in the queue at a given time. Multiphase multichannel analysis was used to gain insights on optimal staff and space utilization assuming a priori safety parameters (i.e., 30 min decision to incision in unscheduled CD; ≤ 5 min for emergent CD; no greater than 8 h for nil per os time). To achieve these safety targets, a < 0.5% probability that a patient would need to wait was assumed.
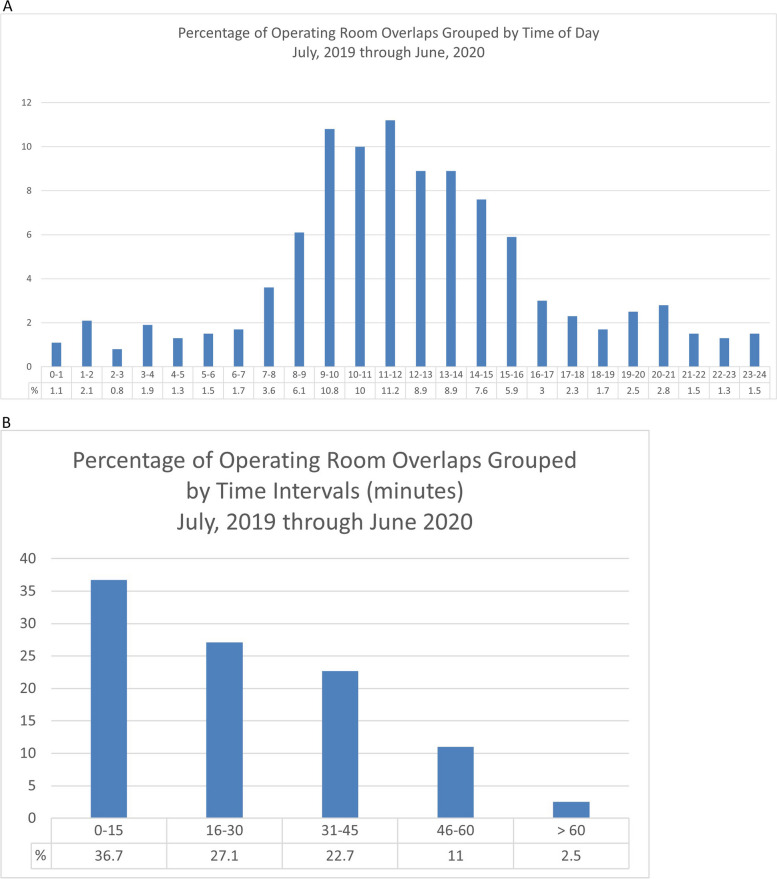
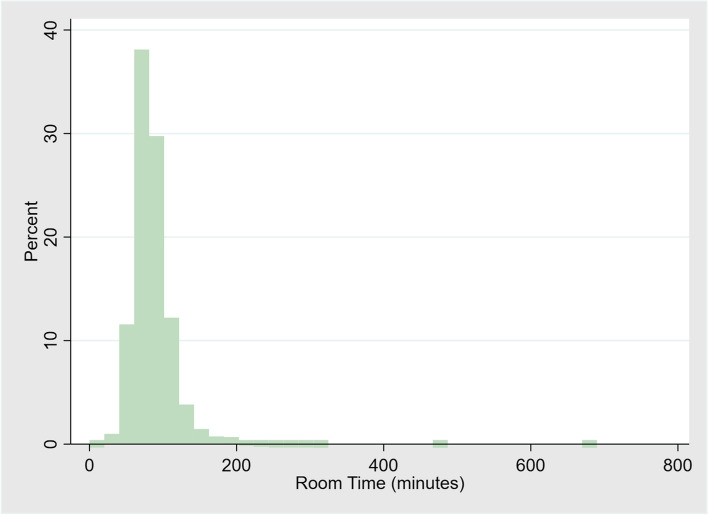
Results: There were 4,017 total activities in the operating room and 3,092 CD in the study period. Arrival rate λ was 0.45 (patients per hour) at peak hours 07:00-19:00 while λ was 0.34 over all 24 h. The service rate per OR team (µ) was 0.87 (patients per hour) regardless of peak or overall hours. The number of server teams (s) dedicated to OR activity was varied between two and five. Over 24 h, the probability of no patients in the system was P0 = 0.61, while the probability of 1 patient in the system was P1 = 0.23, and the probability of 2 or more patients in the system was P≥2 = 0.05 (P3 = 0.006). However, between peak hours 07:00-19:00, λ was 0.45, µ was 0.87, s was 3, P0 was 0.48; P1 was 0.25; and P≥2 was 0.07 (P3 = 0.01, P4 = 0.002, P5 = 0.0003).
Conclusion: QTA is a useful tool to inform birth center OR efficiency while upholding assumed safety standards and factoring peaks and troughs of daily activity. Our findings suggest QTA is feasible to guide staffing for maternity centers of all volumes through varying model parameters. QTA can inform individual hospital-level decisions in setting staffing and space requirements to achieve safe and efficient maternity perioperative care.
Keywords: Anesthesia; Efficiency; Obstetric; Operating room; Queueing; Staffing.
© 2023. BioMed Central Ltd., part of Springer Nature.
Conflict of interest statement
The authors declare no competing interests.
Figures
References
-
- Ely DM, Driscoll AK. Infant mortality in the United States, 2019: Data from the period linked birth/infant death file. National Vital Statistics Reports. Hyattsville: Natl Center Health Stat. 2021;70(14). 10.15620/cdc:111053. - PubMed
MeSH terms
LinkOut - more resources
Full Text Sources
Medical
Miscellaneous
