. 2023 Oct 5:34:102045.
doi: 10.1016/j.omtn.2023.102045. eCollection 2023 Dec 12.

Reducing cell intrinsic immunity to mRNA vaccine alters adaptive immune responses in mice

Affiliations

Reducing cell intrinsic immunity to mRNA vaccine alters adaptive immune responses in mice

Ziyin Wang et al. Mol Ther Nucleic Acids. .

Abstract

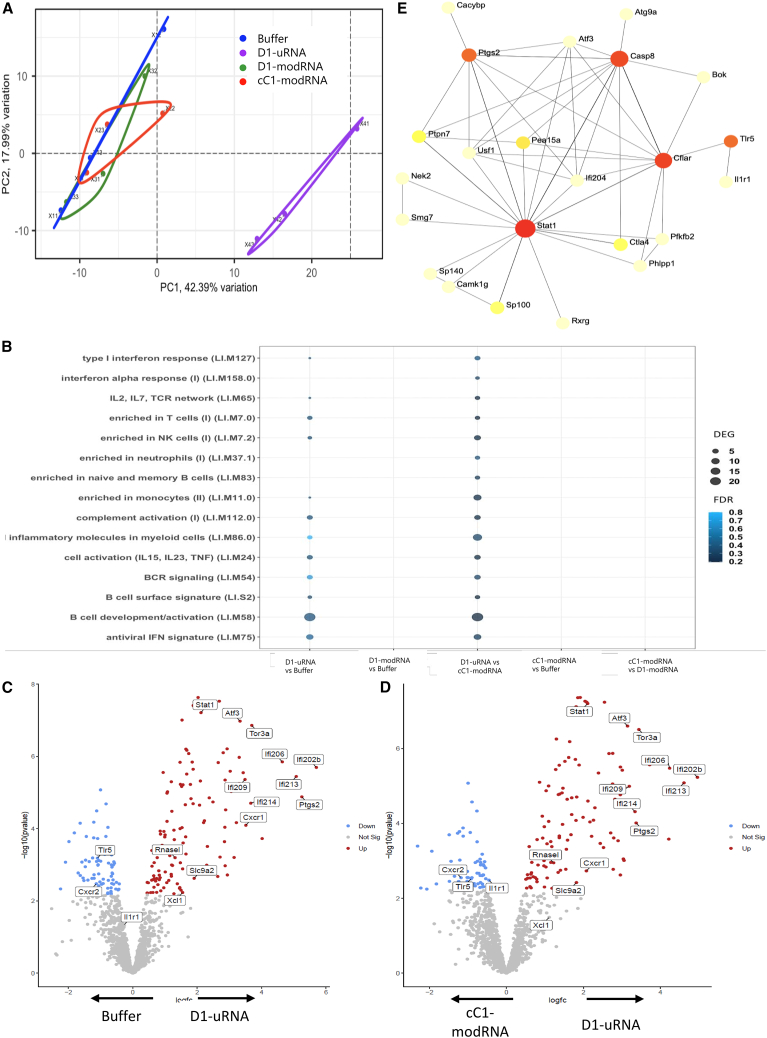
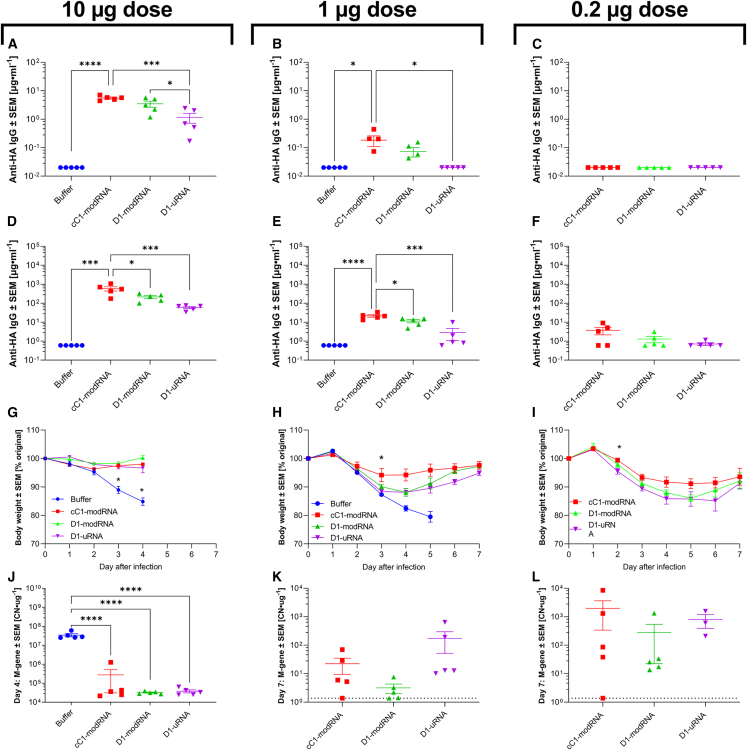
The response to mRNA vaccines needs to be sufficient for immune cell activation and recruitment, but moderate enough to ensure efficacious antigen expression. The choice of the cap structure and use of N1-methylpseudouridine (m1Ψ) instead of uridine, which have been shown to reduce RNA sensing by the cellular innate immune system, has led to improved efficacy of mRNA vaccine platforms. Understanding how RNA modifications influence the cell intrinsic immune response may help in the development of more effective mRNA vaccines. In the current study, we compared mRNA vaccines in mice against influenza virus using three different mRNA formats: uridine-containing mRNA (D1-uRNA), m1Ψ-modified mRNA (D1-modRNA), and D1-modRNA with a cap1 structure (cC1-modRNA). D1-uRNA vaccine induced a significantly different gene expression profile to the modified mRNA vaccines, with an up-regulation of Stat1 and RnaseL, and increased systemic inflammation. This result correlated with significantly reduced antigen-specific antibody responses and reduced protection against influenza virus infection compared with D1-modRNA and cC1-modRNA. Incorporation of m1Ψ alone without cap1 improved antibodies, but both modifications were required for the optimum response. Therefore, the incorporation of m1Ψ and cap1 alters protective immunity from mRNA vaccines by altering the innate immune response to the vaccine material.

Keywords: MT: Bioinformatics; RNA vaccine; cell intrinsic; inflammation; influenza; innate; sensing.


Conflict of interest statement

E.J.J., S.K., J.M., L.A.S., A.B.V., K.K., U.S., and S.E. are employees at BioNTech SE (Mainz, Germany). U.S. is cofounder and management board member of BioNTech SE (Mainz, Germany). A.B.V., K.K., U.S., and S.E. are inventors on patents and patent applications related to RNA technology. A.B.V., K.K., U.S., and S.E. hold securities from BioNTech SE.

Figures

None
Graphical abstract
Figure 1
Figure 1
Modifications of the mRNA format influence expression in vitro (A–D) HEK293T (A, B) and MEF (C, D) cells were either transfected with different mRNA formats encoding H1 influenza HA, or mock transfected. Eighteen hours after transfection, cells were stained with ant-HA primary antibody or isotype control (IgG2a kappa), and analyzed by flow cytometry. Expression was assessed by displaying the frequency of HA-positive cells (A, D) and their mean fluorescence intensity (MFI, B, E) as mean and standard deviation and overlay plots represent one representative sample (C and F). One-way ANOVA with Tukey's multiple comparison was performed between transfected groups, n = 4 for HEK293T cells and n = 3 for MEFs. ∗p < 0.05, ∗∗∗∗p < 0.0001. ns, not significant.
Figure 2
Figure 2
Immunization with unmodified mRNA induces a significantly different transcriptomic response in the lymph node to m1Ψ containing mRNA (A–D) BALB/c mice were immunised intramuscularly with 10 µg mRNA encoding HA from H1 influenza. The mRNA was either D1-uRNA, cC1-modRNA or D1-modRNA; responses were compared to buffer only. Lymph nodes were collected at 6 hours after immunisation and processed for RNA-Seq. Principal component analysis (PCA) of RNA changes (A). Grouping of responses as blood transcription modules (BTM, B). Individual significant differentially expressed genes (DEG), shown between buffer and D1-uRNA (C) and cc1-modRNA and D1-uRNA (D). Gene-gene interactions for DEG in D1-uRNA group (E). N=3 mice per group. FDR, false discovery rate.
Figure 3
Figure 3
Immunization with unmodified mRNA induces a significantly greater systemic inflammatory response 6 h after immunization (A–C) BALB/c mice were immunized intramuscularly with 10 μg mRNA encoding HA from H1 influenza. The mRNA was either D1-uRNA, cC1-modRNA or D1-modRNA. Weight change after immunization (A). Blood was collected at 6 h (B) and 24 h (C) after immunization and measured for cytokines by MSD. N = 5 mice per group. ∗on heatmap p < 0.05 compared with D1-uRNA group by one-way ANOVA with Tukey’s post hoc test.
Figure 4
Figure 4
Immunization with unmodified mRNA leads to different cell recruitment into the muscle and lymph node (A–J) BALB/c mice were immunized intramuscularly with 10 μg mRNA encoding HA from H1 influenza; the mRNA was either D1-uRNA, cC1-modRNA, or D1-modRNA. Muscles and lymph nodes were harvested at 24 h after immunization and processed for flow cytometry. Total live leukocyte cell count in recovered tissue (A and B), dendritic cells (C and D), macrophages (E and F), neutrophils (G and H), and T cells (I and J) assessed by flow cytometry and presented as a percentage of the live leukocytes in the tissue sample. The mean is indicated by horizontal line, N = 5 mice per group, each dot represents one animal, ∗p < 0.05 by one-way ANOVA and Dunnet’s post hoc test.
Figure 5
Figure 5
Inflammation after immunization with unmodified mRNA is associated with dampened adaptive immune responses (A-J) BALB/c mice were immunized at day 0 and day 21 intramuscularly with 1 μg mRNA encoding HA from H1 influenza; the mRNA was either D1-uRNA, cC1-modRNA, or D1-modRNA. Heatmap of mean cytokine responses in blood 24 h after immunization (A). Blood was collected for analysis of HA specific antibody 21 days (B) and 42 days (C) after study start; 42 days after the study, spleens were collected and assessed for HA specific T cells by ELISPOT (D). Heatmap of correlation between antibody, T cells, and cytokines after prime, values are Pearson r (E), black boxes indicate significance p < 0.05. Correlation antibody with KC (F), TNF (G), IFN-γ (H), IL-6 (I), and IL-5 (J). N = 5 mice per group; ∗p < 0.05, ∗∗∗∗p < 0.0001 as indicated by one-way ANOVA with Tukey’s post hoc test. WT, wild type.
Figure 6
Figure 6
Blocking IFN signaling alters the inflammatory profile after immunization and the T cell response (A–G) C57BL/6 mice treated with IFNAR blocking antibody (αIFNAR: 1 mg MAR1 intraperitoneally 24 h before immunization), or an isotype control (wild type [WT]/Iso), or Ifnar−/− mice were immunized intramuscularly with 1 μg cC1-modRNA or D1-uRNA at 0 and 28 days responses compared with a no vaccine control (naive); 6 h after immunization sera were collected to measure cytokines by MSD (A): individual cytokines IP-10 (B), TNF (C), IL5 (D), and IL-6 (E). At 14 days after the second dose, mice were culled and sera collected for anti-HA IgG (F) and spleens for HA specific ELISPOT (G). IP-10 24 h after immunization was compared HA-specific ELISPOT responses (H). N = 6 per group, except cC1-modRNA and control where N = 3. ∗p < 0.05, ∗∗p < 0.001, ∗∗∗p < 0.001, ∗∗∗∗p < 0.0001 as indicated by one-way ANOVA with Tukey’s post hoc test.
Figure 7
Figure 7
Differences in induced antibody levels between different mRNA vaccine formulations (A–L) BALB/c mice were immunized intramuscularly at day 0 and days 21 with 10, 1, or 0.2 μg mRNA expressing HA from H1 influenza; the mRNA was either D1-uRNA, D1-modRNA, or cC1-modRNA. Blood was collected to measure anti-HA antibody responses at 4 (A– C) and 8 weeks (D–F). Mice were infected intranasally with influenza virus at 8 weeks, weight loss was measured after infection (G–I). Viral load after infection was measured by absolute RT-qPCR quantification taken on day 4 (J) or day 7 (K, L), copy number (CN) per microgram RNA extracted from lung tissue is shown. Dotted line represents lower limit of detection. N = 5 mice per group; ∗p < 0.05, ∗∗∗p < 0.001, ∗∗∗∗p < 0.0001 as indicated by one-way ANOVA with Tukey’s post hoc test. In (G–I) ∗ vs. buffer control.

References

    1. Tregoning J.S., Brown E.S., Cheeseman H.M., Flight K.E., Higham S.L., Lemm N.M., Pierce B.F., Stirling D.C., Wang Z., Pollock K.M. Vaccines for COVID-19. Clin. Exp. Immunol. 2020;202:162–192. - PMC - PubMed
    1. Tregoning J.S., Flight K.E., Higham S.L., Wang Z., Pierce B.F. Progress of the COVID-19 vaccine effort: viruses, vaccines and variants versus efficacy, effectiveness and escape. Nat. Rev. Immunol. 2021;21:626–636. - PMC - PubMed
    1. Sahin U., Muik A., Vogler I., Derhovanessian E., Kranz L.M., Vormehr M., Quandt J., Bidmon N., Ulges A., Baum A., et al. BNT162b2 vaccine induces neutralizing antibodies and poly-specific T cells in humans. Nature. 2021;595:572–577. - PubMed
    1. Baden L.R., El Sahly H.M., Essink B., Kotloff K., Frey S., Novak R., Diemert D., Spector S.A., Rouphael N., Creech C.B., et al. Efficacy and Safety of the mRNA-1273 SARS-CoV-2 Vaccine. N. Engl. J. Med. Overseas. Ed. 2021;384:403–416. - PMC - PubMed
    1. Karikó K., Buckstein M., Ni H., Weissman D. Suppression of RNA recognition by Toll-like receptors: the impact of nucleoside modification and the evolutionary origin of RNA. Immunity. 2005;23:165–175. - PubMed