. 2023 Sep 29;26(11):108098.
doi: 10.1016/j.isci.2023.108098. eCollection 2023 Nov 17.

The role of HIF-1α/HO-1 pathway in hippocampal neuronal ferroptosis in epilepsy

Affiliations

The role of HIF-1α/HO-1 pathway in hippocampal neuronal ferroptosis in epilepsy

Zhen Liang et al. iScience. .

Abstract

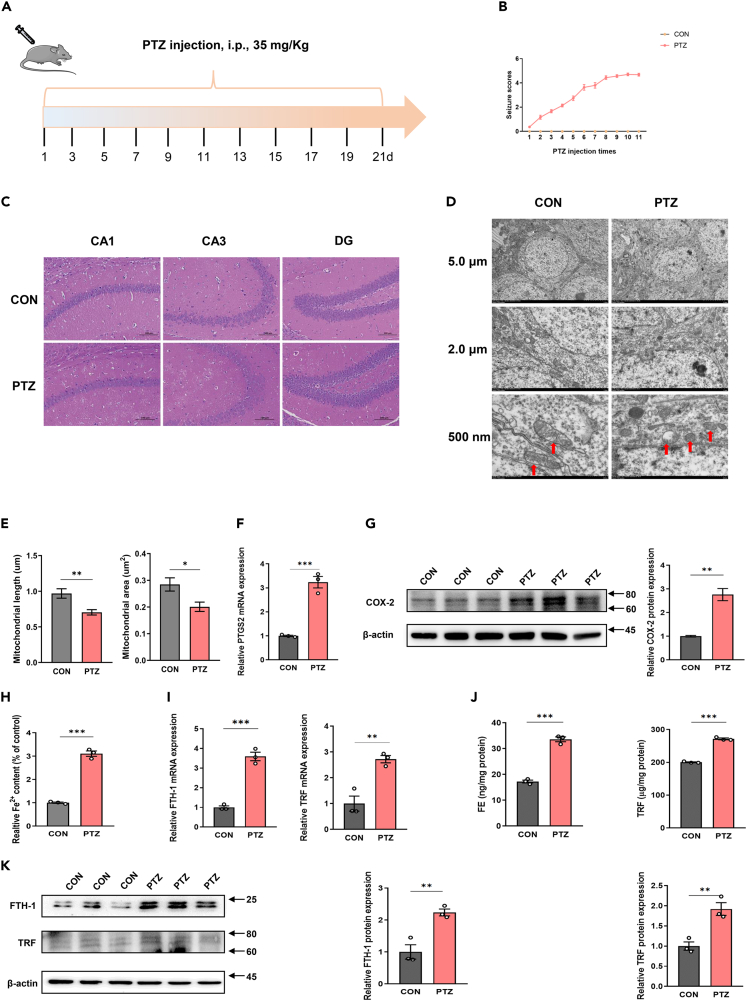
Epilepsy, a common central nervous system disorder, remains an enigma in pathogenesis. Emerging consensus designates hippocampal neuronal injury as a cornerstone for epileptogenic foci, pivotal in epileptic genesis and progression. Ferroptosis, a regulated cell death modality hinging on iron, catalyzes lipid reactive oxygen species formation through iron and membrane polyunsaturated fatty acid interplay, culminating in oxidative cell death. This research investigates the role of hypoxia-inducible factor (HIF)-1α/heme oxygenase (HO)-1 in hippocampal neuron ferroptosis during epilepsy. Untargeted metabolomics exposes metabolite discrepancies between epilepsy patients and healthy individuals, unveiling escalated oxidative stress, heightened bilirubin, and augmented iron metabolism in epileptic blood. Enrichment analyses unveil active HIF-1 pathway in epileptic pathogenesis, reinforced by HIF-1α signaling perturbations in DisGeNET database. PTZ-kindled mice model confirms increased ferroptotic markers, oxidative stress, HIF-1α, and HO-1 in epilepsy. Study implicates HIF-1α/HO-1 potentially regulates hippocampal neuronal ferroptosis, iron metabolism, and oxidative stress, thereby promoting the propagation of epilepsy.

Keywords: Cell biology; Health sciences; Metabolomics; Molecular biology; Neuroscience.


Conflict of interest statement

The authors declare no competing interests.

Figures

None
Graphical abstract
Figure 1
Figure 1
Untargeted metabolomic differential metabolites analysis among NC, IS, and FS groups (A) OPLS-DA score in positive and negative ion mode. (B) HMDB classification ring maps in positive and negative ion mode. (C‒E) Relative abundance of several representative differential metabolites. One-way ANOVA was used to compare three groups, followed by conducting pairwise comparisons between groups using Welch’s T-test. The data are presented as mean ± SEM. ∗p < 0.05, ∗∗p < 0.01, ∗∗∗p < 0.001, and ns for no significance.
Figure 2
Figure 2
KEGG pathway enrichment analysis of differential metabolites in positive and negative ion mode
Figure 3
Figure 3
Screening and functional enrichment analysis of epilepsy-associated genes based on DisGeNET database (A) PPI network for epilepsy-associated genes. (B) GO analysis. (C) KEGG analysis.
Figure 4
Figure 4
Validation of hippocampal neurons ferroptosis in PTZ kindling epilepsy mice models (A) Flow schematic depiction of study design. (B) Statistical chart of seizure score changes after each PTZ injection in epileptic model group. (C) HE staining of CA1, CA3, and DG regions in hippocampus of PTZ and CON group. (D) TEM results of hippocampus in PTZ and CON group with 5.0 μm, 2.0 μm, and 500 nm scale. (E) The quantification of mitochondrial length and area in hippocampus. (F and G) RT-qPCR and western blot results for PTGS2/COX-2 in hippocampus. (H) Relative Fe2+ accumulation in hippocampus. (I‒K) RT-qPCR, ELISA and western blot results for FTH-1 and TRF in hippocampus. Unpaired two-tailed Student’s t-test was used to compare two groups. The data are presented as mean ± SEM. ∗p < 0.05, ∗∗p < 0.01, and ∗∗∗p < 0.001.
Figure 5
Figure 5
Validation of excessive oxidative stress of hippocampus in PTZ kindling epilepsy mice models (A) Relative activity of antioxidant enzymes in hippocampus, including SOD, CAT, and GSH-Px. (B and C) western blot and RT-qPCR results for GPX4 in hippocampus. (D) ROS staining of CA1, CA3, and DG regions in hippocampus. (E) Relative MDA content hippocampus. Unpaired two-tailed Student’s t-test was used to compare two groups. The data are presented as mean ± SEM. ∗p < 0.05, ∗∗p < 0.01, and ∗∗∗p < 0.001.
Figure 6
Figure 6
Validation of the activation of HIF-1α/HO-1 pathway in hippocampus in PTZ kindling epilepsy mice models (A and B) RT-qPCR and western blot results for HIF-1α and HO-1 in hippocampus. Unpaired two-tailed Student’s t-test was used to compare two groups. The data are presented as mean ± SEM. ∗p < 0.05, ∗∗p < 0.01, and ∗∗∗p < 0.001.

Similar articles

Cited by

References

    1. Devinsky O., Vezzani A., O'Brien T.J., Jette N., Scheffer I.E., de Curtis M., Perucca P. Epilepsy. Nat. Rev. Dis. Primers. 2018;4 doi: 10.1038/nrdp.2018.24. - DOI - PubMed
    1. Scheffer I.E., Berkovic S., Capovilla G., Connolly M.B., French J., Guilhoto L., Hirsch E., Jain S., Mathern G.W., Moshé S.L., et al. ILAE classification of the epilepsies: Position paper of the ILAE Commission for Classification and Terminology. Epilepsia. 2017;58:512–521. doi: 10.1111/epi.13709. - DOI - PMC - PubMed
    1. Gan J., Qu Y., Li J., Zhao F., Mu D. An evaluation of the links between microRNA, autophagy, and epilepsy. Rev. Neurosci. 2015;26:225–237. doi: 10.1515/revneuro-2014-0062. - DOI - PubMed
    1. Cai Y., Yang Z. Ferroptosis and Its Role in Epilepsy. Front. Cell. Neurosci. 2021;15 doi: 10.3389/fncel.2021.696889. - DOI - PMC - PubMed
    1. Chen S., Chen Y., Zhang Y., Kuang X., Liu Y., Guo M., Ma L., Zhang D., Li Q. Iron Metabolism and Ferroptosis in Epilepsy. Front. Neurosci. 2020;14 doi: 10.3389/fnins.2020.601193. - DOI - PMC - PubMed

LinkOut - more resources