. 2023 Oct 9:15:1266859.
doi: 10.3389/fnagi.2023.1266859. eCollection 2023.

Early-stage mapping of macromolecular content in APPNL-F mouse model of Alzheimer's disease using nuclear Overhauser effect MRI

Affiliations

Early-stage mapping of macromolecular content in APPNL-F mouse model of Alzheimer's disease using nuclear Overhauser effect MRI

Anshuman Swain et al. Front Aging Neurosci. .

Abstract

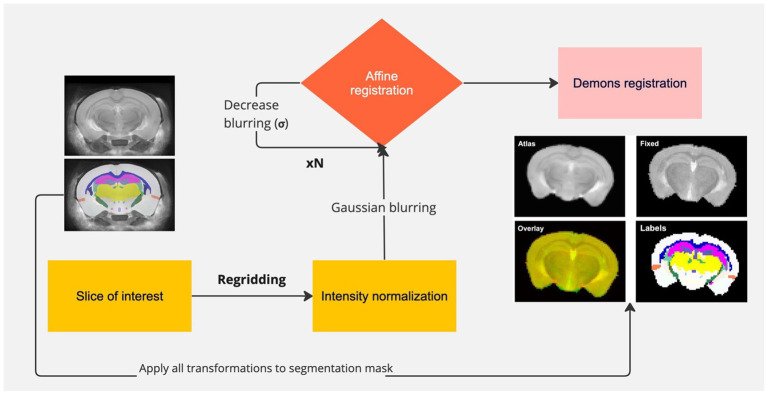
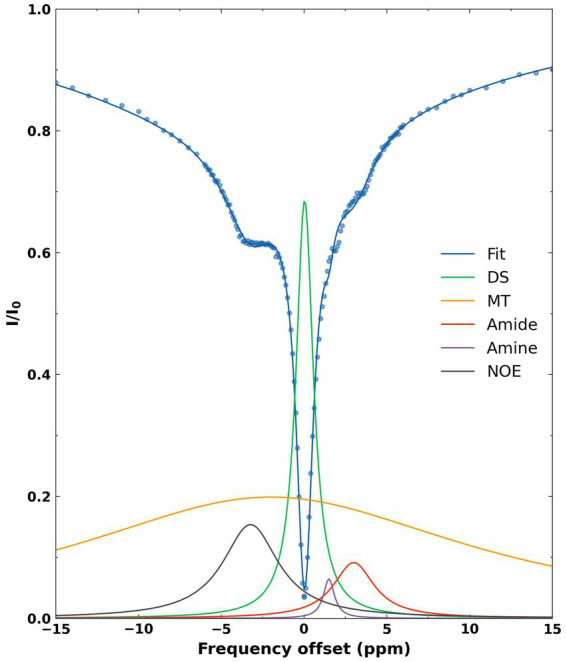
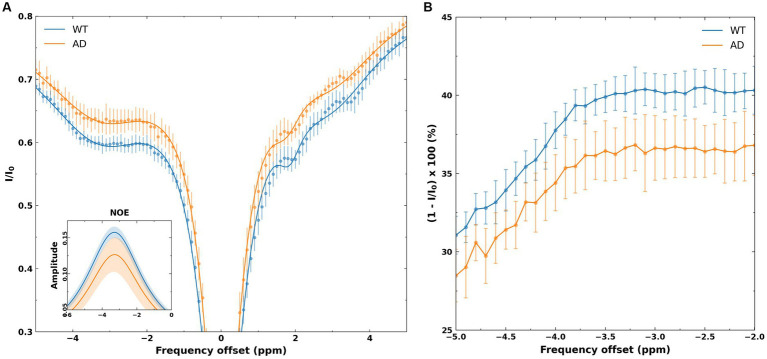
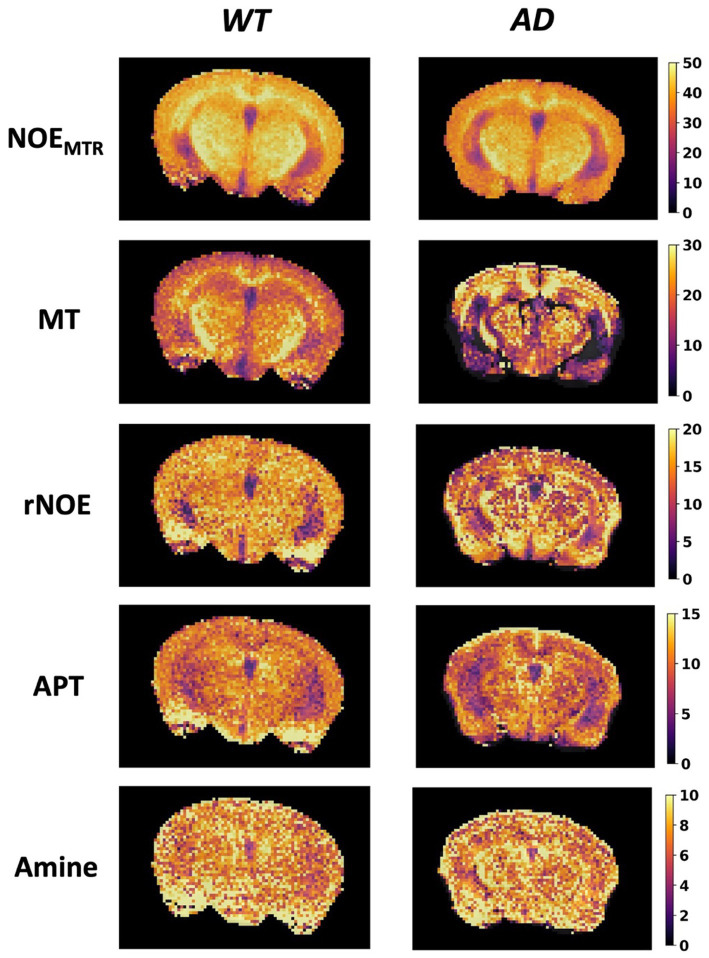
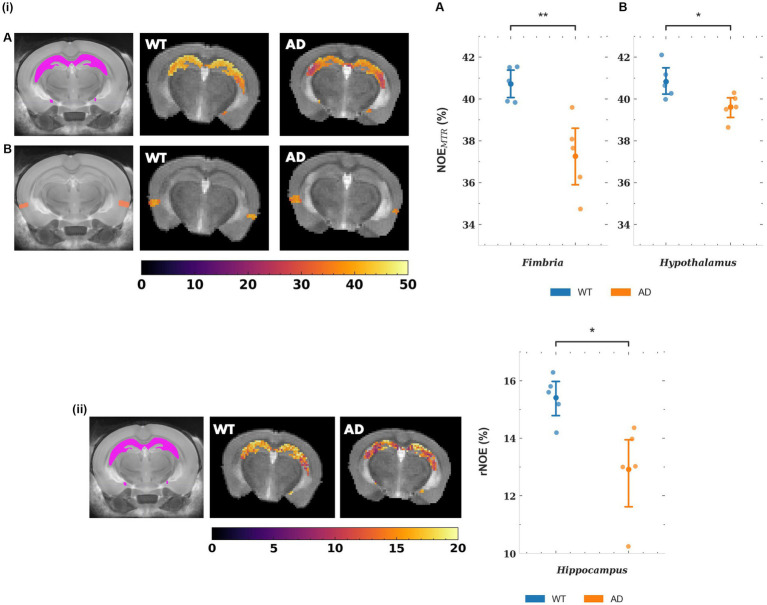
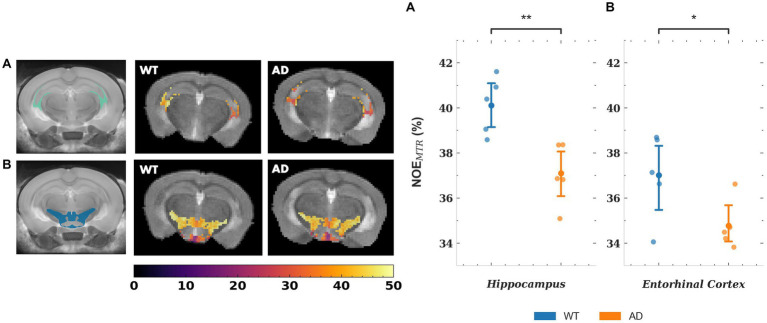
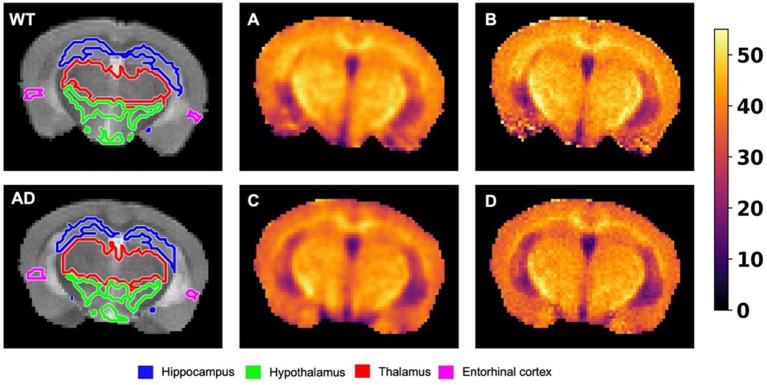
Non-invasive methods of detecting early-stage Alzheimer's disease (AD) can provide valuable insight into disease pathology, improving the diagnosis and treatment of AD. Nuclear Overhauser enhancement (NOE) MRI is a technique that provides image contrast sensitive to lipid and protein content in the brain. These macromolecules have been shown to be altered in Alzheimer's pathology, with early disruptions in cell membrane integrity and signaling pathways leading to the buildup of amyloid-beta plaques and neurofibrillary tangles. We used template-based analyzes of NOE MRI data and the characteristic Z-spectrum, with parameters optimized for increase specificity to NOE, to detect changes in lipids and proteins in an AD mouse model that recapitulates features of human AD. We find changes in NOE contrast in the hippocampus, hypothalamus, entorhinal cortex, and fimbria, with these changes likely attributed to disruptions in the phospholipid bilayer of cell membranes in both gray and white matter regions. This study suggests that NOE MRI may be a useful tool for monitoring early-stage changes in lipid-mediated metabolism in AD and other disorders with high spatial resolution.

Keywords: Alzheimer’s disease; CEST; NOE; lipid dyshomeostasis; multipool fitting.


Conflict of interest statement

The authors declare that the research was conducted in the absence of any commercial or financial relationships that could be construed as a potential conflict of interest.

Figures

Figure 1
Figure 1
Pipeline of registration and segmentation of a mouse brain. The slice of interest is selected from the atlas, re-gridded to match the size of the fixed image, and intensity normalized to the intensity of the fixed image. Gaussian blurring is used to find a coarse affine transformation of the atlas to the fixed image, followed by subsequent iterations in which blurring is reduced to achieve finer transformations. The last transformation involves non-linear registration of the atlas to the fixed image. All transformations are applied to the segmentation with nearest-neighbor interpolation. Representative registered atlas and labels are shown.
Figure 2
Figure 2
Representative fitted Z-spectrum (blue curve) from the whole brain of a WT mouse. The blue scatter points represent mean normalized intensity values at each offset. The five fitted metabolite pools are as follows: DS (green), MT (yellow), amide (red), amine (purple), NOE (black).
Figure 3
Figure 3
(A) Z-spectra from the hippocampus of WT and AD mice. The points represent mean normalized intensity values for each group for offsets of −5 to 5 ppm, with error bars representing the standard deviation for each offset. The inset shows the fitted NOE amplitudes derived from the multi-pool fitting, with the WT group showing a higher amplitude than the AD group. The shaded regions in the inset represents the standard deviations of the fits in each group. (B) The MTRasym spectra from the hippocampus of WT and AD mice. As shown, −2 to −3.5 ppm shows a flat profile, likely reflecting the broad line shape of macromolecules that undergo cross-relaxation. The shift of-3.5 ppm is chosen for NOE metrics as this corresponds to macromolecular shifts observed in high-resolution 1H NMR at 3.5 ppm upfield of water.
Figure 4
Figure 4
Representative global maps from a WT and AD mouse. The first row shows the NOEMTR contrast generated using Equation (1), while the subsequent rows are generated from pixelwise multi-pool fitting of Z-spectra as described by Equation (2). The colormaps are in units of %.
Figure 5
Figure 5
(i) Representative NOEMTR maps from the segmented hippocampus (A) and entorhinal cortex (B) of a WT and AD mouse. There is a statistically significant decrease in NOEMTR observed in the hippocampus and entorhinal cortex of the AD mouse. The point plots show the average NOEMTR from each region for WT and AD mice. (ii) Representative relayed NOE maps from the hippocampus of a WT and AD mouse. Similar to NOEMTR, there is an observable decrease in relayed NOE contrast in the hippocampus of the AD mouse which shows statistical significance as seen in the point plot to the right. The colormaps are in units of %. ** = p < 0.01, * = p < 0.05.
Figure 6
Figure 6
Representative NOEMTR maps from the fimbria (A) and hypothalamus (B). A statistically significant drop is observed in AD mice compared to WT mice, as shown by the point plots to the right. The point plots represent the average NOEMTR in each region for WT and AD mice, with an n = 5 in both groups. In addition, the representative maps show observable changes in contrast, with the fimbria showing a strikingly lower contrast in the AD mouse. The colormaps are in units of %. ** = p < 0.01, * = p < 0.05.
Figure 7
Figure 7
The leftmost image of the top and bottom rows shows representative T2w images from a WT and AD mouse brain, respectively. The images are overlaid with their respective segmentations, with the colors of the regions corresponding to the labels listed on the bottom. (A) The B0 uncorrected NOEMTR map from the corresponding WT mouse brain following a Gaussian blurring with σ = 0.75. (B) The B0 corrected NOEMTR map with no filtering applied. (C) and (D) correspond to (A) and (B) respectively, but for the corresponding AD mouse brain. The regions affected by B0 correction are the thalamus and entorhinal cortex, while the hippocampus and hypothalamus remained unaffected. The thalamus showed statistically significant differences between WT v. AD but lost its statistical significance post-B0 correction, while the entorhinal cortex showed the opposite effect. The colormaps are in units of %.

Similar articles

Cited by

References

    1. Alzheimer’s disease (2023). 2023 Alzheimer's disease facts and figures. Alzheimers Dement. 19, 1598–1695. doi: 10.1002/alz.13016, PMID: - DOI - PubMed
    1. Au C. K. F., Abrigo J., Liu C., Liu W., Lee J., Au L. W. C., et al. . (2021). Quantitative susceptibility mapping of the hippocampal Fimbria in Alzheimer's disease. J. Magn. Reson. Imaging 53, 1823–1832. doi: 10.1002/jmri.27464, PMID: - DOI - PubMed
    1. Bao Y. W., Chau A. C. M., Chiu P. K., Shea Y. F., Kwan J. S. K., Chan F. H. W., et al. . (2021). Heterogeneity of amyloid binding in cognitively impaired patients consecutively recruited from a memory clinic: evaluating the utility of quantitative 18F-Flutemetamol PET-CT in discrimination of mild cognitive impairment from Alzheimer's disease and other dementias. J. Alzheimers Dis. 79, 819–832. doi: 10.3233/JAD-200890, PMID: - DOI - PMC - PubMed
    1. Benseny-Cases N., Klementieva O., Cotte M., Ferrer I., Cladera J. (2014). Microspectroscopy (muFTIR) reveals co-localization of lipid oxidation and amyloid plaques in human Alzheimer disease brains. Anal. Chem. 86, 12047–12054. doi: 10.1021/ac502667b, PMID: - DOI - PubMed
    1. Benyard B., Nanga R. P. R., Wilson N. E., Thakuri D., Jacobs P. S., Swain A., et al. . (2023). In vivo reproducibility of 3D relayed NOE in the healthy human brain at 7 T. Magn. Reson. Med. 89, 2295–2304. doi: 10.1002/mrm.29600, PMID: - DOI - PMC - PubMed

LinkOut - more resources