. 2023 Oct 9:5:1237146.
doi: 10.3389/fdgth.2023.1237146. eCollection 2023.

A data-driven framework for clinical decision support applied to pneumonia management

Affiliations

A data-driven framework for clinical decision support applied to pneumonia management

Robert C Free et al. Front Digit Health. .

Abstract

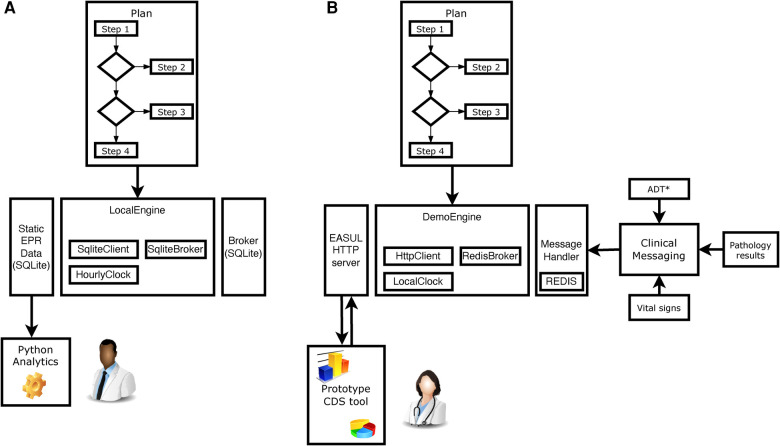
Despite their long history, it can still be difficult to embed clinical decision support into existing health information systems, particularly if they utilise machine learning and artificial intelligence models. Moreover, when such tools are made available to healthcare workers, it is important that the users can understand and visualise the reasons for the decision support predictions. Plausibility can be hard to achieve for complex pathways and models and perceived "black-box" functionality often leads to a lack of trust. Here, we describe and evaluate a data-driven framework which moderates some of these issues and demonstrate its applicability to the in-hospital management of community acquired pneumonia, an acute respiratory disease which is a leading cause of in-hospital mortality world-wide. We use the framework to develop and test a clinical decision support tool based on local guideline aligned management of the disease and show how it could be used to effectively prioritise patients using retrospective analysis. Furthermore, we show how this tool can be embedded into a prototype clinical system for disease management by integrating metrics and visualisations. This will assist decision makers to examine complex patient journeys, risk scores and predictions from embedded machine learning and artificial intelligence models. Our results show the potential of this approach for developing, testing and evaluating workflow based clinical decision support tools which include complex models and embedding them into clinical systems.

Keywords: artificial intelligence; clinical decision support; data-driven; machine learning; pneumonia.


Conflict of interest statement

The authors declare that the research was conducted in the absence of any commercial or financial relationships that could be construed as a potential conflict of interest.

Figures

Figure 1
Figure 1
Schematic showing how EASUL-based tools were configured and utilised in two different ways. (A) For research, quality and service improvement using static data sets and Python scripting and analytics. (B) Creation of a prototype CDS tool through integration of outputs/results into a clinical information system. *ADT = hospital admissions, discharges and transfers. In all cases, a Plan is initially defined using Python classes. These plans act as containers for available re-usable components including DataSource, Algorithm, State and Visual classes. The main logic is encompassed within determinative Steps, which support algorithms of different modalities—varying from simple clinical risk scores and logical (if/then) comparisons to advanced ML and AI models. Data received by steps at particular points determine the specific patient journey undertaken. Once a Plan has been defined, it is executed using an Engine - which encompasses a Client, Broker and Clock. The client handles the local storage of states and results, the broker provides/receives data to drive the plan and the clock handles the temporal aspects of flows. For example, in (A) the client was a SQLite database which stored information for later analysis, the broker was a static SQLite database which provided input data and the clock was setup to increment forward hourly within each CAP admission to simulate progression. Clipart is from draw.io.
Figure 2
Figure 2
Example components in data-driven algorithm steps. Steps act upon the results of algorithms. This figure shows steps containing (A) a “Score algorithm” for CURB65 severity and (B) a “Predictive algorithm” for mortality prediction, and while many of the components utilised are the same there are also differences. All algorithms use “Data Schemas” to define the input and output fields which are supported by an “Algorithm” and “Data Input.” This allows data to be validated and/or converted before it is used for prediction and prevents a data set being used to make predictions using an algorithm with an incorrect schema. The “Data Input” is collected through collating different sources into a single “Data Source” according to their availability and the system setup. Which step is next in the patient journey is then determined by the results of the “Algorithm” and the “Decision.” Decision types are algorithm agnostic, although in (A) there are three possible decisions (Low, moderate or high severity), whereas in (B) there are two (Likely survival or Likely mortality). There is also flexibility in the event driven actions, which can be set to occur at particular points within the step. For example, one type of action stores a new state value once a decision has been made but before it has been actioned. The main differences between the two steps lie in how the algorithm is defined and, in the visualisations, available. The “Score algorithm” in (A) (essentially a risk score) is built from “Risk factor” expressions, whereas the “Predictive algorithm” in (B) comprises a previously trained and serialized machine learning/AI model—both powered by “Data Inputs.”
Figure 3
Figure 3
Number of admissions dichotomised into those seen/not seen by SPIN showing calculated severity levels. (A) Cross-comparison of severity automatically calculated by EASUL with those manually calculated by the SPIN team. (B) Severity automatically calculated by EASUL. Underlined values match in severity. *CURB65 was only recorded for 227 admissions seen by SPIN. Severity level is based on: Low = CURB65 0–1; Moderate = CURB65 2; High = CURB65 3–5.
Figure 4
Figure 4
High-level architecture of the proof-of-concept CDS system incorporating simulated real-time data.
Figure 5
Figure 5
Screenshots of the prototype clinical frontend showing the features provided by EASUL. Admissions are added automatically to the system once a patient is identified as having CAP according to presence of specific clinical codes (see Methods). The resulting dashboard contains links to several visualisation options to provide support to the user: (A) results from CURB65 (severity) and CRP level stratification, along with an ML model to predict likelihood of mortality; (B) visualisation of the journey so far for the selected admission, showing key decision points driven by the data. This can be customised to include data sources and/or only show the direct route; (C) breakdown of the CURB65 severity score into individual risk factors; (D) explainable visualisations to further explain the model predictions with a bar plot showing the prediction probabilities and outputs such as LIME plots showing the variables and values which influence the prediction; (E) interpretable metrics in a model overview which provides key model performance indicators including area under the curve, accuracy, predictive power, sensitivity and specificity.

Similar articles

References

    1. Warner HR, Toronto AF, Veasey LG, Stephenson R. A mathematical approach to medical diagnosis: application to congenital heart disease. JAMA. (1961) 177:177–83. 10.1001/jama.1961.03040290005002 - DOI - PubMed
    1. Sutton RT, Pincock D, Baumgart DC, Sadowski DC, Fedorak RN, Kroeker KI. An overview of clinical decision support systems: benefits, risks,, strategies for success. npj Digit Med. (2020) 3:1–10. 10.1038/s41746-020-0221-y - DOI - PMC - PubMed
    1. Berner ES, La Lande TJ. Overview of clinical decision support systems. In: Berner ES, editor. Clinical decision support systems: theory, practice (health informatics). New York, NY: Springer (2007). p. 3–22. Available from: 10.1007/978-0-387-38319-4_1 - DOI
    1. Bishop CM. Pattern recognition, machine learning. Information Science and Statistics. New York: Springer; (2006).
    1. Rasheed K, Qayyum A, Ghaly M, Al-Fuqaha A, Razi A, Qadir J. Explainable, trustworthy, and ethical machine learning for healthcare: a survey. Comput Biol Med. (2022) 149:106043. 10.1016/j.compbiomed.2022.106043 - DOI - PubMed

LinkOut - more resources