. 2024 Jan 30;36(2):346-366.
doi: 10.1093/plcell/koad271.

The nuclear pore Y-complex functions as a platform for transcriptional regulation of FLOWERING LOCUS C in Arabidopsis

Affiliations

The nuclear pore Y-complex functions as a platform for transcriptional regulation of FLOWERING LOCUS C in Arabidopsis

Penghui Huang et al. Plant Cell. .

Abstract

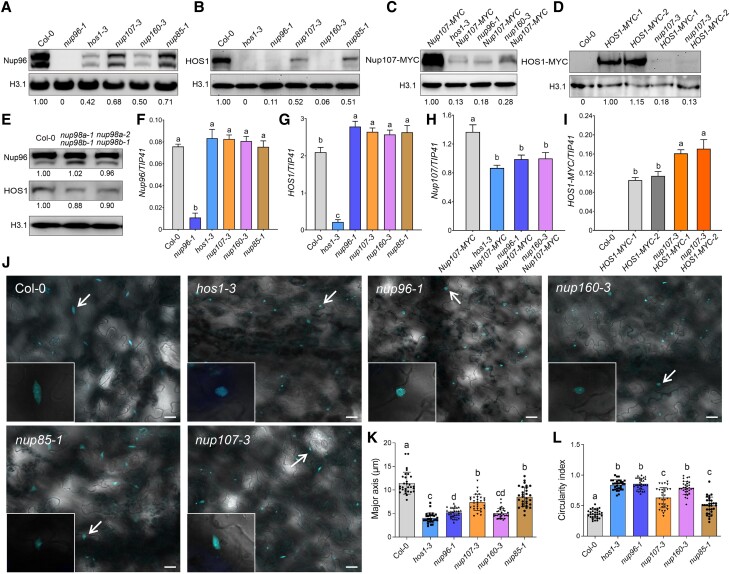
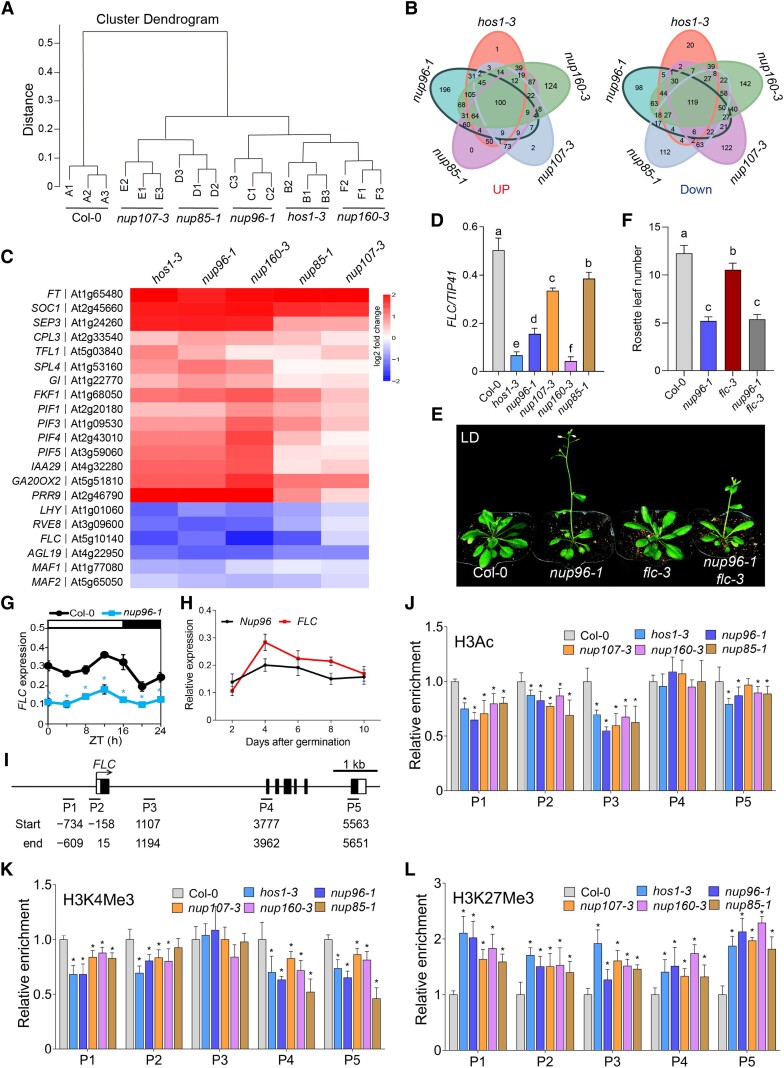
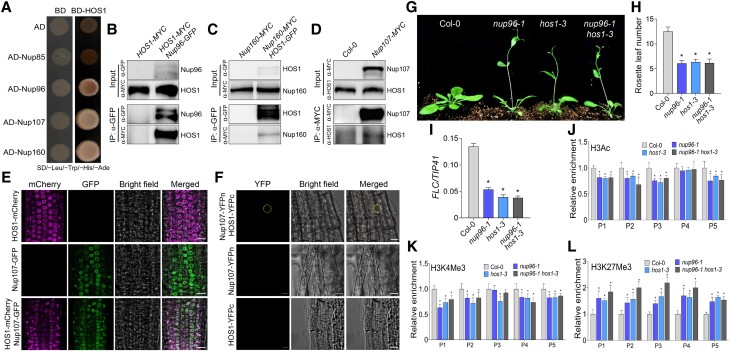
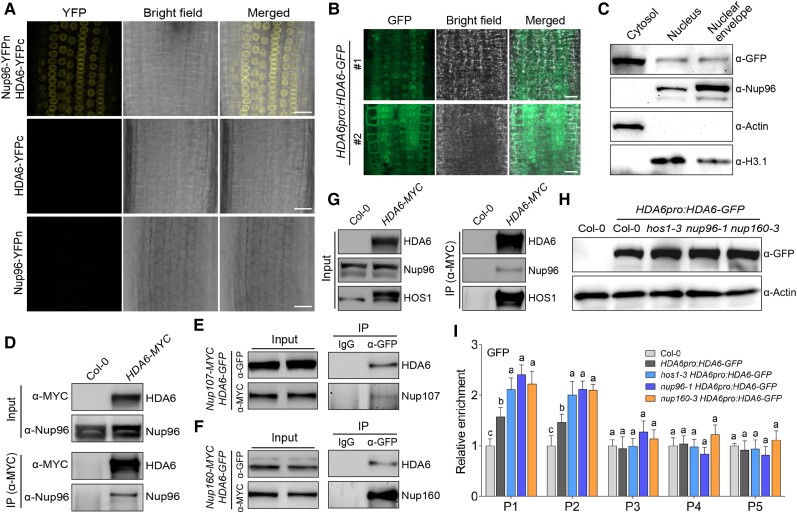
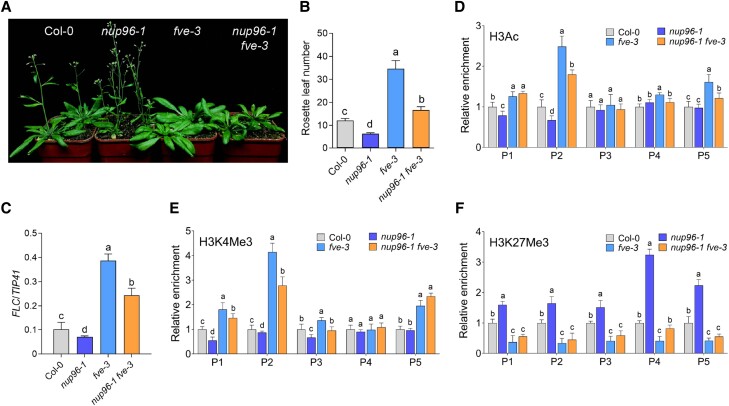
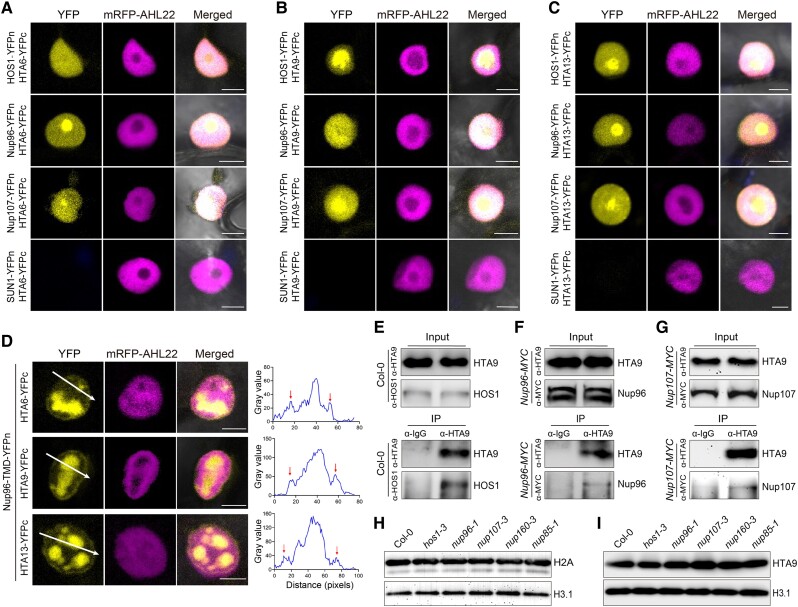
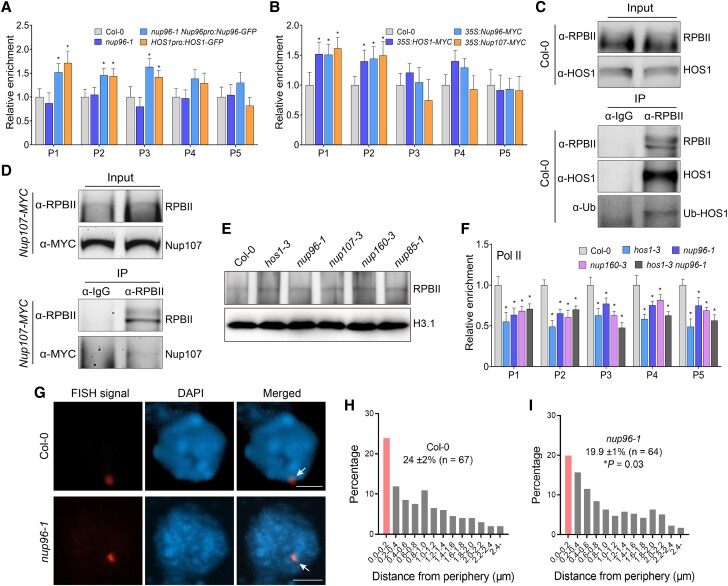
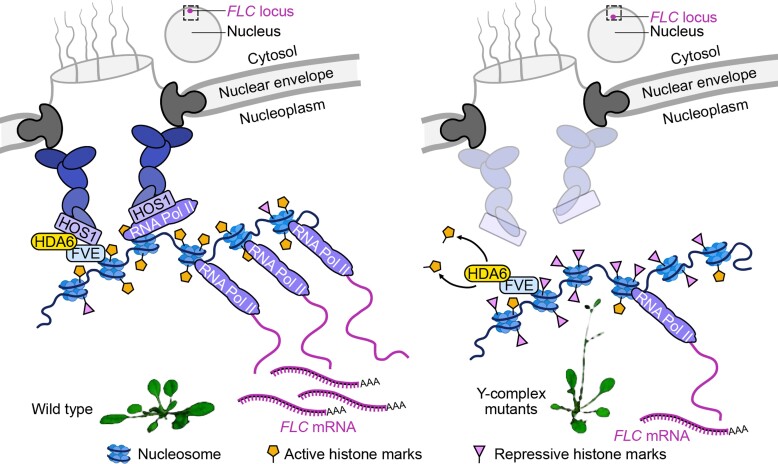
The nuclear pore complex (NPC) has multiple functions beyond the nucleo-cytoplasmic transport of large molecules. Subnuclear compartmentalization of chromatin is critical for gene expression in animals and yeast. However, the mechanism by which the NPC regulates gene expression is poorly understood in plants. Here we report that the Y-complex (Nup107-160 complex, a subcomplex of the NPC) self-maintains its nucleoporin homeostasis and modulates FLOWERING LOCUS C (FLC) transcription via changing histone modifications at this locus. We show that Y-complex nucleoporins are intimately associated with FLC chromatin through their interactions with histone H2A at the nuclear membrane. Fluorescence in situ hybridization assays revealed that Nup96, a Y-complex nucleoporin, enhances FLC positioning at the nuclear periphery. Nup96 interacted with HISTONE DEACETYLASE 6 (HDA6), a key repressor of FLC expression via histone modification, at the nuclear membrane to attenuate HDA6-catalyzed deposition at the FLC locus and change histone modifications. Moreover, we demonstrate that Y-complex nucleoporins interact with RNA polymerase II to increase its occupancy at the FLC locus, facilitating transcription. Collectively, our findings identify an attractive mechanism for the Y-complex in regulating FLC expression via tethering the locus at the nuclear periphery and altering its histone modification.


Conflict of interest statement

Conflict of interest statement. The authors declare no competing interests.

Figures

Figure 1.
Figure 1.
An intact Nup107–160 subcomplex is a prerequisite for its protein stability. A to D) Immunoblots showing the level of endogenous Nup96 (A, anti-Nup96 antibody) and HOS1 (B, anti-HOS1 antibody) or Nup107-MYC (C, anti-MYC antibody) and HOS1-MYC (D, anti-MYC antibody) in nuclear extracts from wild-type plants and different mutants. Relative quantification of each band compared to the control is indicated below the bottom panel. E) Abundance of endogenous Nup96 (anti-Nup96 antibody) and HOS1 (anti-HOS1 antibody) proteins in nuclear extracts from the nup98a-1 nup98b-1 and nup98a-2 nup98b-1 double mutants. F to I) RT-qPCR analysis of endogenous Nup96(F) and HOS1(G) or transgenic Nup107-MYC (H) and HOS1-MYC (I) transcript levels. Seedlings were grown in long-day conditions for 10 d. Values are means ± standard deviation (SD; n = 3 biological repeats). Histone H3.1 (H3.1) was used as the loading control in immunoblots and relative quantification of each band compared to the control is indicated below the panel. TIP41 was used as a reference gene for RT-qPCR. J) The nuclei in rosette leaves of wild-type and mutants were stained with Hoechst 33,342 and were observed using a confocal LSM. Scale bars, 20 µm. Insets, magnified images of nuclei. K and L) Major axis length (K) and circularity index (L) of nuclei, measured in wild-type plants and different mutants. Values are means ± SD (n ≥ 30). Different lowercase letters indicate significant differences (*P < 0.05) using 1-way ANOVA.
Figure 2.
Figure 2.
Mutants of Y-complex components share similar transcriptome signatures and FLC chromatin histone modification profile. A) Cluster dendrogram based on the differentially expressed genes in hos1-3, nup96-1, nup160-3, nup107-3, and nup85-1 mutants compared to wild-type plants. B) Venn diagram of common and unique DEGs (An absolute Log2(fold change) > 1, Fisher’s exact test, P-value < 0.01) that are upregulated (left) or downregulated (right) in hos1-3, nup96-1, nup160-3, nup107-3, and nup85-1 mutants compared to wild-type plants. C) Heatmap representation of mis-regulated flowering-related genes in hos1-3, nup96-1, nup85-1, nup107-3, and nup160-3 mutants relative to wild-type plants. D) Relative FLC expression in Col-0 and different mutants. Values are means ± SD (n = 3 biological repeats). Different lowercase letters indicate significant differences (*P < 0.05) using 1-way ANOVA. E and F) Flowering phenotypes (E) of wild-type plants, nup96-1, flc-3, and nup96-1 flc-3 mutants and total rosette leaf number (F) in long days. Values are means ± SD (n ≥ 18). G) RT-qPCR analysis of daily expression patterns of FLC in the nup96-1 mutant and wild-type plants in long days. H) RT-qPCR analysis of developmental expression patterns of Nup96 and FLC in wild-type seedlings in long days. Values are means ± SD (n = 3 biological repeats). I) Diagram of the FLC genomic region. P1 to P5 indicate the FLC chromatin regions examined by chromatin immunoprecipitation followed by quantitative PCR (ChIP-qPCR). The numbers below indicate nucleotide positions relative to the A, T, and G bases start codon. Filled boxes represent exons; lines indicate introns, and unfilled boxes denote the untranslated regions. J to L) ChIP-qPCR assay of the relative enrichment levels of H3Ac (J), H3K4Me3 (K), H3K27Me3 (L) at the FLC locus in wild type and hos1-3, nup96-1, nup107-3, nup160-3, and nup85-1 mutants. Seedlings were grown in long days for 10 d. Values are means ± SD (n = 3 biological repeats). The eIF4A gene was used for normalizing the quantified DNA fragments. Statistical analysis was performed using Student's t test (*P < 0.05).
Figure 3.
Figure 3.
Different Y-complex components interact with HOS1 to change histone modifications of FLC chromatin. A) Yeast 2-hybrid (Y2H) assay to detect interactions between HOS1 and Nup107–160 subcomplex components. B to D) in vivo interaction of HOS1 with Nup96 (B), Nup160 (C), and Nup107 (D) in Arabidopsis. Plant total proteins extracted from 10-d transgenic seedlings grown in long days were immunoprecipitated with an anti-GFP antibody (B and C) or anti-MYC antibody (D) as indicated in each blot. The co-immunoprecipitated proteins were detected with anti-GFP, anti-MYC, or anti-HOS1 antibodies as indicated. E) Colocalization of Nup107-GFP and HOS1-mCherry in the roots of transgenic seedlings. Scale bars, 20 µm. F) BiFC assay showing HOS1 interacting with Nup107 in transgenic plants. HOS1 was fused to the C-terminal half of YFP (HOS1-YFPc), while Nup107 was fused to the N-terminal half of YFP (Nup107-YFPn). Scale bars, 10 µm. G) Flowering phenotypes of wild type, nup96-1 and hos1-3 single mutants, and the nup96-1 hos1-3 double mutant grown in long-day conditions. H) Rosette leaf number at the time of flowering for the different genotypes shown in (G). Values are means ± SD (n ≥ 18). Statistical analysis was performed using Student's t test (*, P < 0.05). I) Relative FLC expression in wild-type, nup96-1, hos1-3, and nup96-1 hos1-3 seedlings grown in long-day conditions. Values are means ± SD (n = 3 biological repeats). TIP41 (At4g34270) was used as a reference gene. Statistical analysis was performed using Student's t test (*P < 0.05). J to L) ChIP-qPCR analysis of relative enrichment levels of H3Ac (J), H3K4Me3 (K), H3K27Me3 (L) at the FLC locus in seedlings of wild type, nup96-1 and the hos1-3 single mutants and the nup96-1 hos1-3 double mutant grown in long-day conditions for 10 d. Values are means ± SD (n = 3 biological repeats). The eIF4A gene was used for normalizing the quantified DNA fragments. Statistical analysis was performed using Student's t test (*P < 0.05).
Figure 4.
Figure 4.
Y-complex components associate with HDA6 to epigenetically modify histones over the FLC chromatin. A) BiFC assay of HDA6-YFPc and Nup96-YFPn in the roots of transgenic seedlings. Scale bars, 20 µm. B) Subcellular distribution of HDA6-GFP in root epidermal cells of 2 HDA6pro:HDA6-GFP transgenic Arabidopsis seedlings (#1 and #2), showing high fluorescent signals at the nuclear rim. Scale bars, 20 µm. C) Immunoblotting on the purified nuclear envelope extracts of HDA6pro:HDA6-GFP transgenic lines compared to corresponding cytoplasm and nuclear samples and probed with the indicated antibodies. Nup96 was a positive control for the nuclear envelope fraction; histone H3.1 was a positive control for the nuclear fraction, and Actin was a positive control for the cytoplasmic fraction. D) In vivo interaction of Nup96 and HDA6 in 35S:HDA6-MYC transgenic Arabidopsis lines. Cell extracts from 10-d-old seedlings were immunoprecipitated with an anti-MYC antibody. The precipitates were probed by immunoblotting with an anti-Nup96 antibody. E and F) In vivo interaction of HDA6 with Nup107 (E), or Nup160 (F). Total proteins of N. benthamiana leaves co-expressing HDA6-GFP and Nup107-MYC(E) or Nup160-MYC(F) were immunoprecipitated with an anti-GFP antibody. The precipitates were probed by immunoblotting with an anti-MYC antibody. G) In vivo interaction assay of HDA6 with HOS1 and Nup96 in 35S:HDA6-MYC transgenic lines. Cell extracts from 10-d-old seedlings were immunoprecipitated with an anti-MYC antibody. The precipitates were probed by immunoblotting with anti-Nup96 or anti-HOS1 antibodies. H) Immunoblotting analysis of HDA6-GFP in HDA6pro:HDA6-GFP, hos1-3 HDA6pro:HDA6-GFP, nup96-1 HDA6pro:HDA6-GFP, and nup160-3 HDA6pro:HDA6-GFP transgenic lines. I) ChIP-qPCR assay of relative enrichment levels of HDA6-GFP at the FLC locus in HDA6pro:HDA6-GFP, hos1-3 HDA6pro:HDA6-GFP, nup96-1 HDA6pro:HDA6-GFP, and nup160-3 HDA6pro:HDA6-GFP transgenic plants, using an anti-GFP antibody.
Figure 5.
Figure 5.
Nup96 regulation of FLC chromatin modifications is associated with FVE. A and B) Flowering phenotypes (A) and total rosette leaf number (B) of wild-type plants, nup96-1 and fve-3 single mutants, and the nup96-1 fve-3 double mutant in long days. Values in (B) are means ± SD (n ≥ 18). C) Relative FLC expression in mutants and wild-type plants. Values are means ± SD (n = 3 biological repeats). D to F) ChIP-qPCR analysis of relative enrichment levels for H3Ac (D), H3K4Me3 (E), and H3K27Me3 (F) at the FLC locus in wild type, nup96-1, fve-3, and nup96- fve-3. Seedlings were grown in long-day conditions for 10 d. Values are means ± SD (n = 3 biological repeats). The eIF4A gene was used for normalizing the quantified DNA fragments while TIP41 was used as a reference gene for RT-qPCR. Different lowercase letters indicate significant differences (*P < 0.05) using 1-way ANOVA.
Figure 6.
Figure 6.
The Y-complex is intimately associated with histone H2A proteins at the nuclear envelope. A to C) BiFC assay of HTA6 (A), HTA9 (B), and HTA13 (C) interacting with different Y-complex components in N. benthamiana. HTA6/9/13 were fused to the C-terminal half of YFP (HTA6-YFPc, HTA9-YFPc, HTA13-YFPc), while Y-complex components were fused to the N-terminal half of YFP (HOS1-YFPn, Nup96-YFPn, Nup107-YFPn). SUN1 (an INM protein) served as negative control. mRFP-AHL22 served as a marker for nuclear localization. Scale bars, 10 µm. D) Left, BiFC assay of HTA6, HTA9, and HTA13 interacting with Nup96-TMD in N. benthamiana. mRFP-AHL22, served as a marker for nuclear localization. Right, measurement of YFP fluorescence intensity profiles along the lines indicated to the left. The peaks indicated by the arrows represent the nuclear membrane positioning signal. Scale bars, 10 µm. E to G) In vivo interaction of HTA9 with HOS1 (E), Nup96 (F), and Nup107 (G) in Arabidopsis. Plant total proteins extracted from 10-d-old seedlings grown in long days were immunoprecipitated with an anti-HTA9 antibody. The co-immunoprecipitated proteins were probed with anti-HOS1 or anti-MYC antibody as indicated on the blots. H and I) Immunoblots showing the level of endogenous H2A (H) or HTA9 (I) in nuclear extracts from wild-type plants and different mutants. Histone H3.1 (H3.1) was used as the loading control.
Figure 7.
Figure 7.
The Nup107–160 subcomplex regulates the position of the FLC locus in the nucleus. A and B) ChIP-qPCR assay of the relative enrichment levels of Nup96, HOS1, and Nup107 proteins at the FLC locus in different transgenic plants with anti-GFP (A) or anti-MYC (B) antibodies. Seedlings were grown in long days for 10 d. C and D) In vivo interaction of RPBII with HOS1 (C) and Nup107 (D) in Arabidopsis. Plant total proteins extracted from 10-d seedlings grown in long days were immunoprecipitated by anti-RPBII antibodies. The co-immunoprecipitated proteins were probed with anti-HOS1, anti-MYC, or anti-Ubiquitin antibodies as indicated on the blots. E) Immunoblots showing the level of endogenous RPBII in nuclear extracts from wild-type plants and different mutants. Histone H3.1 (H3.1) was used as the loading control. F) ChIP-qPCR assay of the relative enrichment levels of RNA PoI II at the FLC locus in wild type, hos1-3, nup96-1, nup160-3, and hos1-3 nup96-1. Seedlings were grown in long days for 10 d. G) Visualization of the FLC locus in the nucleus of wild type and nup96-1 by fluorescence in situ hybridization (FISH). Scale bars, 2 µm. H and I) Distribution of the FLC locus and average percentage of FLC locus localizing to the nuclear peripheral zone in wild type (H) and nup96-1(I). The first bar in the histogram represent the nuclear peripheral zone—the region from 0 µm to 0.2 µm from the nuclear edge. The average percentage of FLC loci within the nuclear peripheral zone with standard error (SE) from 3 independent replicates is shown. “n” represents the total number of FISH signals analyzed from all replicates. The FLC distribution data from the wild type was compared to that of nup96-1 using a 2-sided t-test (*P < 0.05).
Figure 8.
Figure 8.
A model for Y-complex function as a platform for FLC epigenetic modification conferring flowering regulation. In wild-type plants, the intact Y-complex recruits FLC chromatin to the NPC via interaction with histone proteins, and then facilitating RNA Pol II to be enriched on the chromatin and resulting in FLC expression. In Y-complex mutants, the recruitment of FLC chromatin is disrupted and the histone modification pattern is changed, leading to inhibition of FLC expression and early flowering.

Similar articles

Cited by

References

    1. Agote-Aran A, Schmucker S, Jerabkova K, Jmel Boyer I, Berto A, Pacini L, Ronchi P, Kleiss C, Guerard L, Schwab Y, et al. . Spatial control of nucleoporin condensation by fragile X-related proteins. EMBO J. 2020:39(20):e104467. 10.15252/embj.2020104467 - DOI - PMC - PubMed
    1. Allen JL, Douglas MG. Organization of the nuclear pore complex in Saccharomyces cerevisiae. J Ultra struct Mol Struct Res. 1989:102(2):95–108. 10.1016/0889-1605(89)90047-5 - DOI - PubMed
    1. Ausin I, Alonso-Blanco C, Jarillo JA, Ruiz-Garcia L, Martinez-Zapater JM. Regulation of flowering time by FVE, a retinoblastoma-associated protein. Nat Genet. 2004:36(2):162–166. 10.1038/ng1295 - DOI - PubMed
    1. Bastow R, Mylne JS, Lister C, Lippman Z, Martienssen RA, Dean C. Vernalization requires epigenetic silencing of FLC by histone methylation. Nature. 2004:427(6970):164–167. 10.1038/nature02269 - DOI - PubMed
    1. Berry S, Dean C. Environmental perception and epigenetic memory: mechanistic insight through FLC. Plant J. 2015:83(1):133–148. 10.1111/tpj.12869 - DOI - PMC - PubMed

MeSH terms

LinkOut - more resources