. 2024 Feb 8;14(2):362-379.
doi: 10.1158/2159-8290.CD-23-0402.

Loss-of-Function but Not Gain-of-Function Properties of Mutant TP53 Are Critical for the Proliferation, Survival, and Metastasis of a Broad Range of Cancer Cells

Affiliations

Loss-of-Function but Not Gain-of-Function Properties of Mutant TP53 Are Critical for the Proliferation, Survival, and Metastasis of a Broad Range of Cancer Cells

Zilu Wang et al. Cancer Discov. .

Abstract

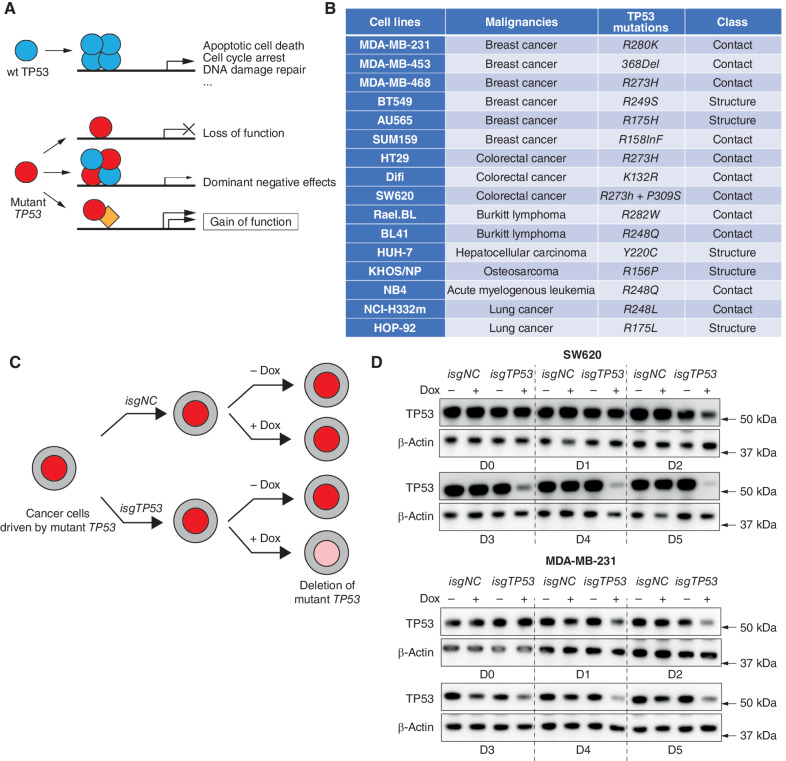
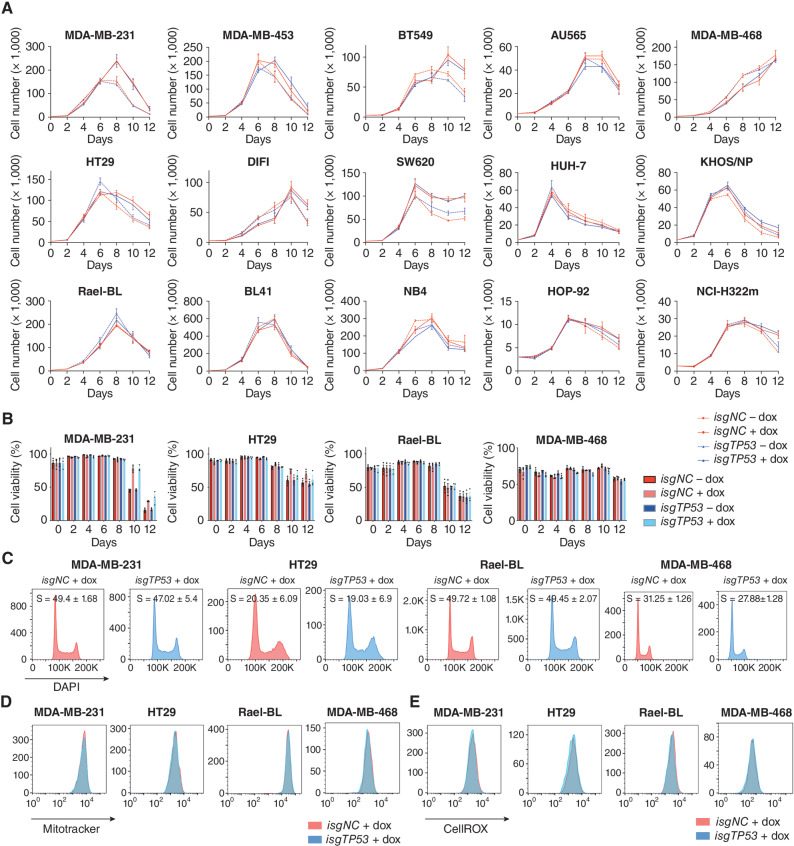
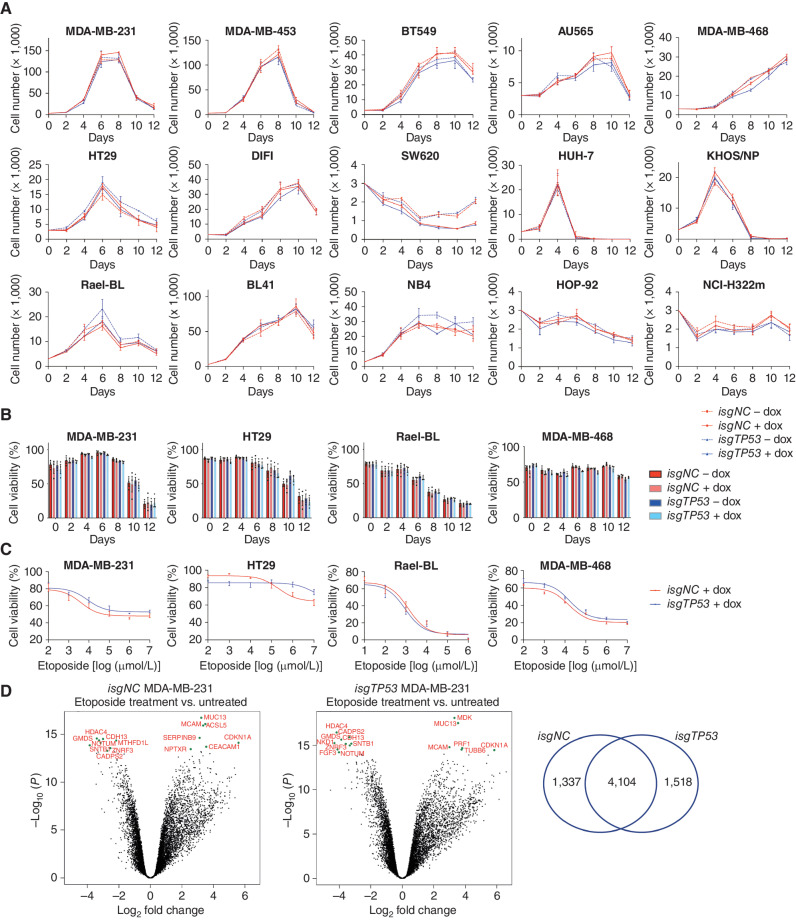
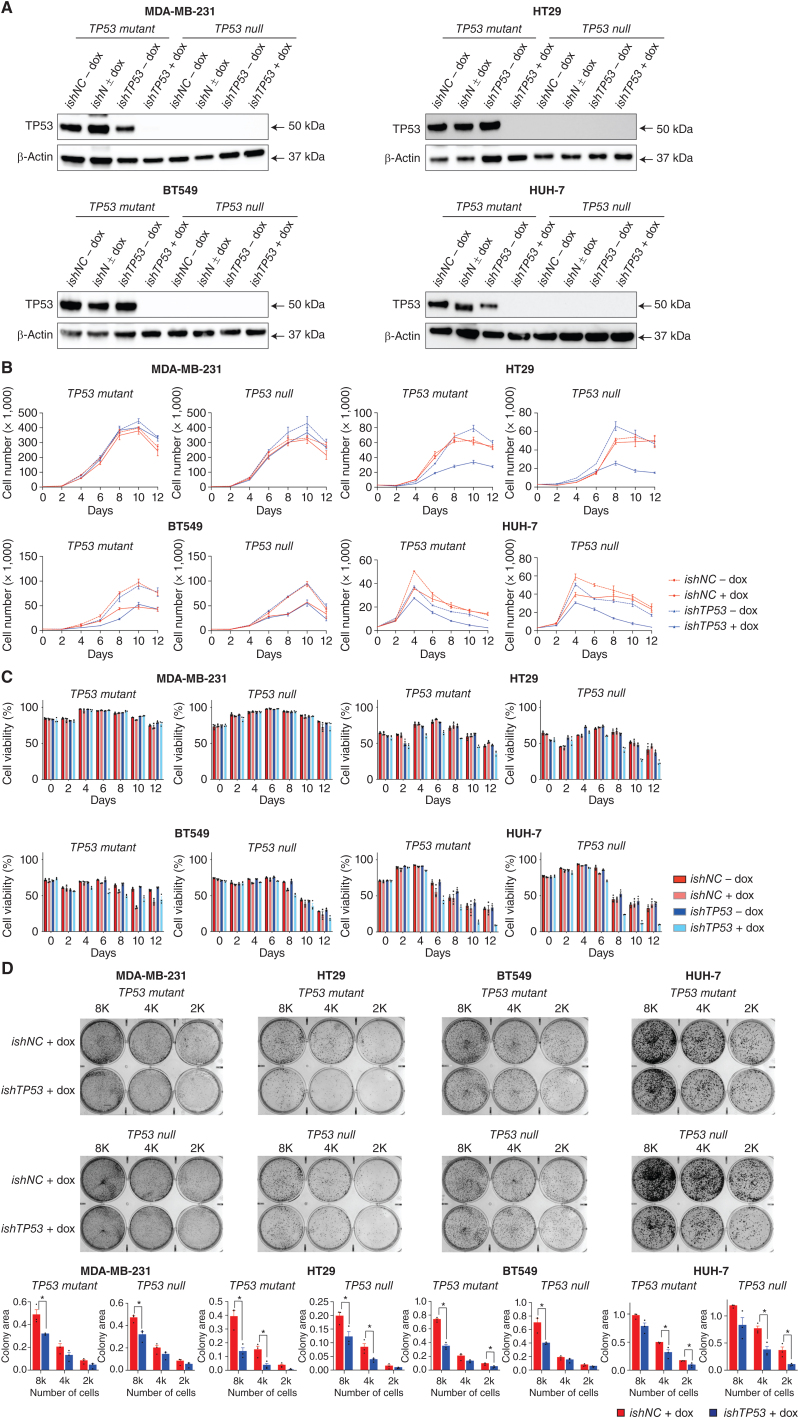
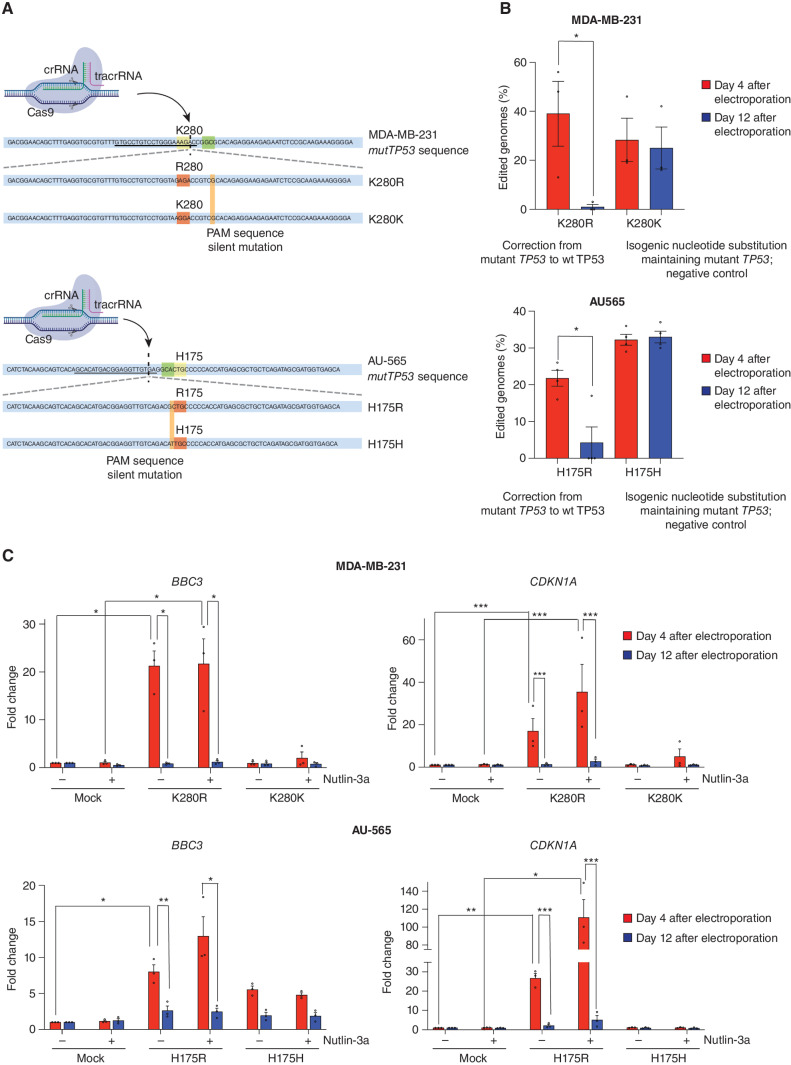
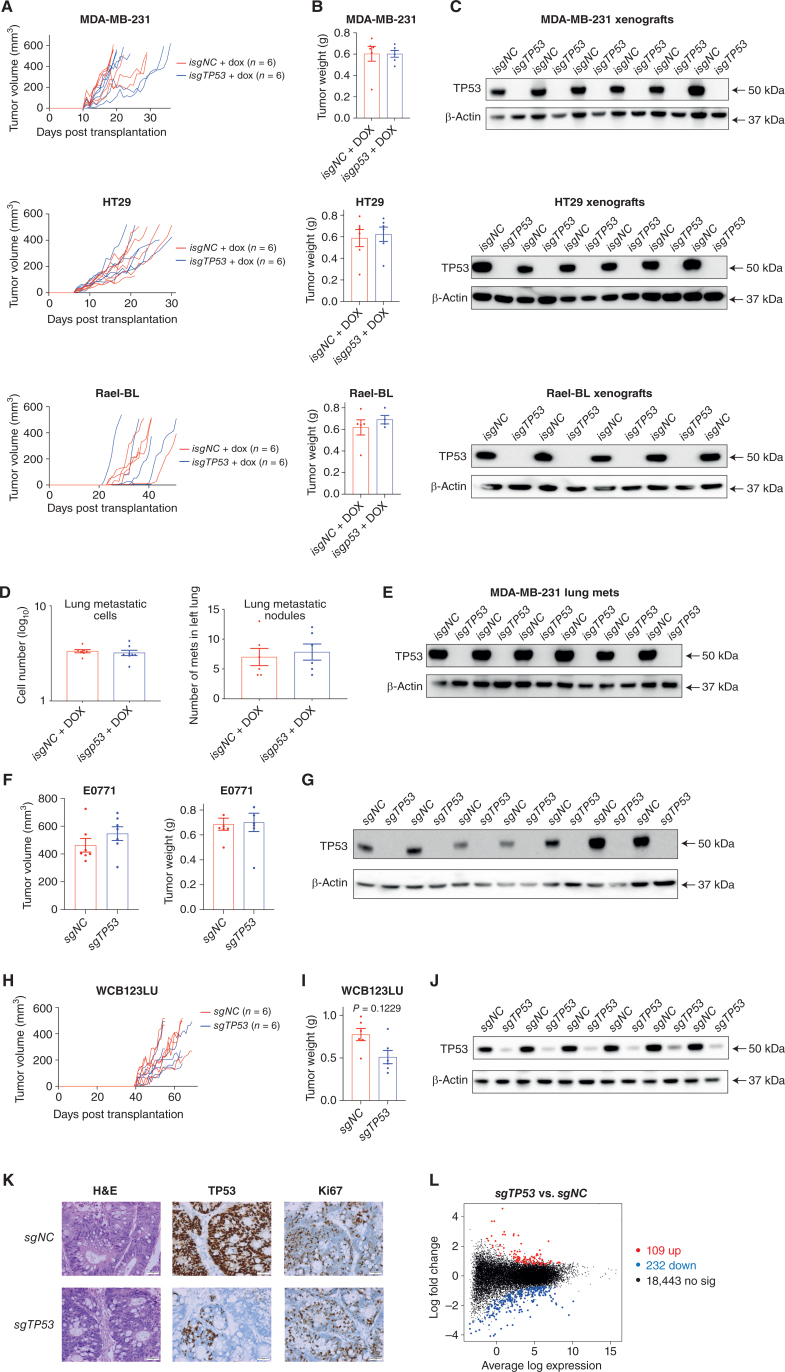
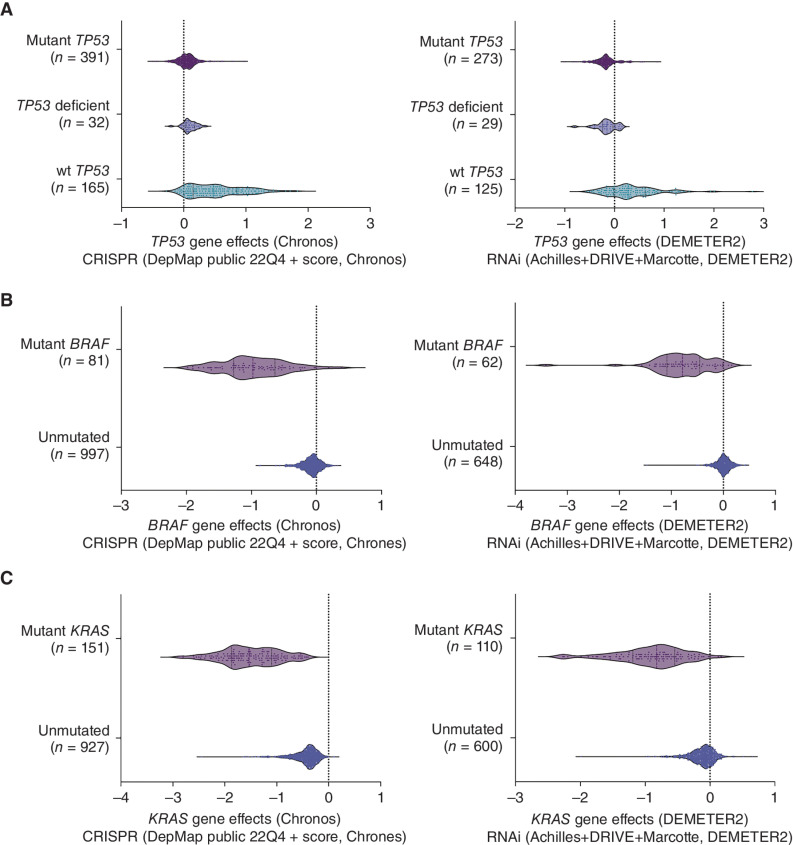
Mutations in the tumor suppressor TP53 cause cancer and impart poor chemotherapeutic responses, reportedly through loss-of-function, dominant-negative effects and gain-of-function (GOF) activities. The relative contributions of these attributes is unknown. We found that removal of 12 different TP53 mutants with reported GOFs by CRISPR/Cas9 did not impact proliferation and response to chemotherapeutics of 15 human cancer cell lines and colon cancer-derived organoids in culture. Moreover, removal of mutant TP53/TRP53 did not impair growth or metastasis of human cancers in immune-deficient mice or growth of murine cancers in immune-competent mice. DepMap mining revealed that removal of 158 different TP53 mutants had no impact on the growth of 391 human cancer cell lines. In contrast, CRISPR-mediated restoration of wild-type TP53 extinguished the growth of human cancer cells in vitro. These findings demonstrate that LOF but not GOF effects of mutant TP53/TRP53 are critical to sustain expansion of many tumor types.

Significance: This study provides evidence that removal of mutant TP53, thereby deleting its reported GOF activities, does not impact the survival, proliferation, metastasis, or chemotherapy responses of cancer cells. Thus, approaches that abrogate expression of mutant TP53 or target its reported GOF activities are unlikely to exert therapeutic impact in cancer. See related commentary by Lane, p. 211 . This article is featured in Selected Articles from This Issue, p. 201.


Figures

Figure 1. Removal of mutant TP53 in human cancer cell lines using doxycycline-inducible CRISPR/Cas9 technology. A, Schematic of how wt TP53 functions as a tumor suppressor and mechanisms by which mutant TP53/TRP53 proteins are postulated to promote neoplastic transformation. B, Table listing the names and cellular origin of the 16 mutant TP53–expressing human cancer–derived cell lines examined, with their respective TP53 mutations indicated. C, Schematic to illustrate the strategy for removing mutant TP53 proteins using an inducible CRISPR/Cas9 platform. D, Western blotting to demonstrate the progressive removal of mutant TP53 protein in the human cancer cell lines SW620 and MDA-MB-231 after transduction with the vector containing the doxycycline-inducible sgRNAs targeting TP53 (isgTP53) and treatment with doxycycline. One control included was to not treat these cells with doxycycline. The same cancer cell lines transduced with a doxycycline-inducible nontargeting control sgRNA (isgNC) and treated, or not treated, with doxycycline were used as further controls. Probing for β-actin was used as a protein loading control. The Western blots shown are representative of 2 or 3 independent blots from independent experiments. Removal of the respective mutant TP53 proteins from the other human cancer–derived cell lines used in this study is documented in Supplementary Fig. S1.
Figure 1.
Removal of mutant TP53 in human cancer cell lines using doxycycline-inducible CRISPR/Cas9 technology. A, Schematic of how wt TP53 functions as a tumor suppressor and mechanisms by which mutant TP53/TRP53 proteins are postulated to promote neoplastic transformation. B, Table listing the names and cellular origin of the 16 mutant TP53–expressing human cancer–derived cell lines examined, with their respective TP53 mutations indicated. C, Schematic to illustrate the strategy for removing mutant TP53 proteins using an inducible CRISPR/Cas9 platform. D, Western blotting to demonstrate the progressive removal of mutant TP53 protein in the human cancer cell lines SW620 and MDA-MB-231 after transduction with the vector containing the doxycycline-inducible sgRNAs targeting TP53 (isgTP53) and treatment with doxycycline. One control included was to not treat these cells with doxycycline. The same cancer cell lines transduced with a doxycycline-inducible nontargeting control sgRNA (isgNC) and treated, or not treated, with doxycycline were used as further controls. Probing for β-actin was used as a protein loading control. The Western blots shown are representative of 2 or 3 independent blots from independent experiments. Removal of the respective mutant TP53 proteins from the other human cancer–derived cell lines used in this study is documented in Supplementary Fig. S1.
Figure 2. Removal of mutant TP53 does not impact the proliferation, survival, mitochondrial content, and ROS levels in human cancer cell lines. A, In vitro growth of the indicated human cancer cell lines with or without doxycycline-mediated induction of a mutant TP53-specific inducible sgRNA (isgTP53) or an inducible control sgRNA (isgNC). B, In vitro survival of the cancer cells described in A. C, Cell-cycle analysis of the cancer cells described in A. D, Mitotracker staining of the cancer cells described in A. E, CellROX staining of the cancer cells described in A. The analyses described in C–E were conducted 2 days after the cancer cells had been treated with doxycycline for 5 days (see A). Data in A and B are presented as mean ± SEM of three independent experiments. There were no consistent significant differences between the mutant TP53–deleted cancer cells versus the control cancer cells in any of the experiments shown (see Supplementary Tables S1 and S2 for details of the statistical analyses).
Figure 2.
Removal of mutant TP53 does not impact the proliferation, survival, mitochondrial content, and ROS levels in human cancer cell lines. A,In vitro growth of the indicated human cancer cell lines with or without doxycycline-mediated induction of a mutant TP53-specific inducible sgRNA (isgTP53) or an inducible control sgRNA (isgNC). B,In vitro survival of the cancer cells described in A. C, Cell-cycle analysis of the cancer cells described in A. D, Mitotracker staining of the cancer cells described in A. E, CellROX staining of the cancer cells described in A. The analyses described in CE were conducted 2 days after the cancer cells had been treated with doxycycline for 5 days (see A). Data in A and B are presented as mean ± SEM of three independent experiments. There were no consistent significant differences between the mutant TP53–deleted cancer cells versus the control cancer cells in any of the experiments shown (see Supplementary Tables S1 and S2 for details of the statistical analyses).
Figure 3. Removal of mutant TP53 does not impair the ability of cancer cells to adapt to conditions of stress. A, In vitro growth of the indicated human cancer cell lines with or without doxycycline-mediated induction of an inducible mutant TP53–specific sgRNA (isgTP53) or an inducible control sgRNA (isgNC) grown in medium with 1% FCS. B, In vitro survival of the cancer cells described in A. C, The viability of the cancer cells described in A after treatment with the indicated concentrations of etoposide for 48 hours. D, Volcano plots for the control mutant TP53–expressing MDA-MB-231 cells treated with etoposide versus treatment with vehicle (left) and for the mutant TP53–deleted derivatives treated with etoposide treatment versus treatment with vehicle (right). The x-axis shows the log2 fold change in gene expression whereas the y-axis shows −log10 (P). Significantly differentially expressed (DE) genes are those above −log10 (0.05) = 1.3 on the y-axis. The top 15 significantly DE genes are indicated by green dots. The Venn diagram shows that nearly 60% of DE genes after treatment with etoposide are the same between the control and the mutant TP53–deleted MDA-MB-231 cancer cells. Data in A–C are presented as mean ± SEM of three independent experiments. There were no consistent significant differences between the TP53-deleted cancer cells versus the control cancer cells in any of the experiments shown (see Supplementary Tables S1 and S2 for details of the statistical analyses).
Figure 3.
Removal of mutant TP53 does not impair the ability of cancer cells to adapt to conditions of stress. A,In vitro growth of the indicated human cancer cell lines with or without doxycycline-mediated induction of an inducible mutant TP53–specific sgRNA (isgTP53) or an inducible control sgRNA (isgNC) grown in medium with 1% FCS. B,In vitro survival of the cancer cells described in A. C, The viability of the cancer cells described in A after treatment with the indicated concentrations of etoposide for 48 hours. D, Volcano plots for the control mutant TP53–expressing MDA-MB-231 cells treated with etoposide versus treatment with vehicle (left) and for the mutant TP53–deleted derivatives treated with etoposide treatment versus treatment with vehicle (right). The x-axis shows the log2 fold change in gene expression whereas the y-axis shows −log10 (P). Significantly differentially expressed (DE) genes are those above −log10 (0.05) = 1.3 on the y-axis. The top 15 significantly DE genes are indicated by green dots. The Venn diagram shows that nearly 60% of DE genes after treatment with etoposide are the same between the control and the mutant TP53–deleted MDA-MB-231 cancer cells. Data in AC are presented as mean ± SEM of three independent experiments. There were no consistent significant differences between the TP53-deleted cancer cells versus the control cancer cells in any of the experiments shown (see Supplementary Tables S1 and S2 for details of the statistical analyses).
Figure 4. Doxycycline-mediated induction of an inducible shRNA targeting mutant TP53 inhibits proliferation and survival of human cancer cell lines through an off-target toxic effect. A, Western blot analysis showing the reduction of mutant TP53 protein in the indicated human cancer cell lines with or without doxycycline-mediated induction of an inducible TP53-specific shRNA (ishTP53) or an inducible control shRNA (ishNC). Probing for β-Actin was used as a protein loading control. The Western blots shown are representative of 2 or 3 independent blots from independent experiments. B, In vitro growth of the indicated human cancer cell lines with or without doxycycline-mediated induction of an inducible TP53-specific shRNA (ishTP53) or an inducible control shRNA (ishNC) for 12 days. C, In vitro survival of the cancer cells described in A and B. D, The cancer cell lines described in A and B were seeded at 8,000 (8K), 4,000 (4K), or 2,000 (2K) cells per well. The photographs show examples of colony formation assays. Colonies were stained with 1% crystal violet. Measurements of colony areas as determined by software ImageJ. Three independent assays were performed for each cancer cell line. Data in B–D are presented as mean ± SEM of three independent experiments.
Figure 4.
Doxycycline-mediated induction of an inducible shRNA targeting mutant TP53 inhibits proliferation and survival of human cancer cell lines through an off-target toxic effect. A, Western blot analysis showing the reduction of mutant TP53 protein in the indicated human cancer cell lines with or without doxycycline-mediated induction of an inducible TP53-specific shRNA (ishTP53) or an inducible control shRNA (ishNC). Probing for β-Actin was used as a protein loading control. The Western blots shown are representative of 2 or 3 independent blots from independent experiments. B,In vitro growth of the indicated human cancer cell lines with or without doxycycline-mediated induction of an inducible TP53-specific shRNA (ishTP53) or an inducible control shRNA (ishNC) for 12 days. C,In vitro survival of the cancer cells described in A and B. D, The cancer cell lines described in A and B were seeded at 8,000 (8K), 4,000 (4K), or 2,000 (2K) cells per well. The photographs show examples of colony formation assays. Colonies were stained with 1% crystal violet. Measurements of colony areas as determined by software ImageJ. Three independent assays were performed for each cancer cell line. Data in BD are presented as mean ± SEM of three independent experiments.
Figure 5. Impact of correction of the mutant TP53 sequence to wt TP53 in the MDA-MB-231 and AU565 human cancer cell lines. A, Schematic of the components used for electroporation to correct the mutant TP53 gene sequence to wt TP53 in human cancer cells. The crRNA recognition site (underlined), PAM sequence (in green), and the cut site (dashed vertical line) for the MDA-MB-231 and AU565 mutTP53 target sequence are presented (K280 and H175 residues in yellow). Bottom, the ssDNA HDR donor sequences are presented: the modified codon (in red) together with the PAM sequence silent mutation (in orange) are shown. B, Percentages of genomes carrying the intended TP53 edit at the indicated time points. N = 3 independent experiments. Individual values of biological replicates their mean and SEM are reported. C, The mRNA abundance for the indicated genes at the indicated time points in the absence (-) or presence (+) of treatment with 5 μmol/L nutlin-3a for 12 hours. N = 3 independent experiments. The data are presented as the mean and SEM of three independent experiments.
Figure 5.
Impact of correction of the mutant TP53 sequence to wt TP53 in the MDA-MB-231 and AU565 human cancer cell lines. A, Schematic of the components used for electroporation to correct the mutant TP53 gene sequence to wt TP53 in human cancer cells. The crRNA recognition site (underlined), PAM sequence (in green), and the cut site (dashed vertical line) for the MDA-MB-231 and AU565 mutTP53 target sequence are presented (K280 and H175 residues in yellow). Bottom, the ssDNA HDR donor sequences are presented: the modified codon (in red) together with the PAM sequence silent mutation (in orange) are shown. B, Percentages of genomes carrying the intended TP53 edit at the indicated time points. N = 3 independent experiments. Individual values of biological replicates their mean and SEM are reported. C, The mRNA abundance for the indicated genes at the indicated time points in the absence (-) or presence (+) of treatment with 5 μmol/L nutlin-3a for 12 hours. N = 3 independent experiments. The data are presented as the mean and SEM of three independent experiments.
Figure 6. Removal of mutant TP53 does not impair tumor growth and metastasis in vivo. A, Growth of the human cancer cell lines MDA-MB-231, SW620, and Rael-BL, either mutant TP53-expressing control cells or the mutant TP53-deleted derivatives, in NSG mice (N = 6 mice per cell line) with tumor volumes presented in mm3. B, Weights of the tumors from A at the ethical endpoint. C, Western blot analysis of the tumors from A to verify the presence of mutant TP53 protein in the control cancer cells and to confirm its absence in the tumors arising from the mutant TP53–deleted cancer cells. Probing for β-Actin was used as a protein loading control. D, Numbers of metastatic cells and nodules in the left lungs of NSG mice that had been injected with MDA-MB-231 breast cancer cells, either mutant TP53-expressing control cells or the mutant TP53-deleted derivatives, into their mammary fat pads (N = 6 mice for each cancer cell line). The primary breast tumors were resected when they had reached 200 mm3 to enable analysis of metastasis thereafter. E, Western blot analysis of the metastases from D to verify the presence or absence of mutant TP53, respectively. Probing for β-Actin was used as a protein loading control. F, Volume and weight of the primary tumors in immune-competent mice transplanted with EO771 mouse breast cancer cells, either mutant Trp53–expressing control cells or their mutant Trp53–deleted derivatives. The breast cancer cells were transplanted into mammary fat pads of Cas9 transgenic mice (C57BL/6 background) to prevent immune rejection caused by Cas9 expression. G, Western blot analysis of the tumors from F to verify the presence of mutant TRP53 in the control cells or its absence in the mutant Trp53–deleted derivatives. Probing for β-Actin was used as a protein loading control. H, Growth of the human colon cancer–derived organoids WCB123LU, either the mutant TP53–expressing controls or the mutant TP53–deleted derivatives, in NSG mice (n = 6 mice per organoid line) with tumor volume presented in mm3. I, Weights of the tumors from H at the ethical endpoint. J, Western blot analysis of the tumors from H to verify the presence of mutant TP53 in the tumors derived from the control organoids or its absence in the tumors derived from the mutant TP53–deleted derivatives. K, Hematoxylin and eosin staining and IHC of the tumors from H to verify the presence of mutant TP53 in the control tumors or its absence in the mutant TP53–deleted derivatives. IHC analysis of Ki-67 in the tumors from H to reveal the expression of this marker of cell proliferation in tumors derived from the control mutant TP53–expressing colon cancer organoids or their mutant TP53–deleted derivatives. Magnification, 200×. L, Mean difference plot for the RNA-seq differential gene expression analysis comparing tumors in NSG mice that had been derived from mutant TP53–expressing control WCB123LU colon cancer organoids with tumors in NSG mice derived from the mutant TP53–deleted derivatives. The x-axis shows the average gene log expression, whereas the y-axis shows gene log2 fold change. Points colored red and blue indicate genes that are significantly upregulated or downregulated, respectively, in the tumors derived from the mutant TP53–deleted colon cancer organoids compared with the mutant TP53–expressing control tumors. Data in B, D, and I are presented as mean ± SEM of results from experiments conducted in triplicate.
Figure 6.
Removal of mutant TP53 does not impair tumor growth and metastasis in vivo. A, Growth of the human cancer cell lines MDA-MB-231, SW620, and Rael-BL, either mutant TP53-expressing control cells or the mutant TP53-deleted derivatives, in NSG mice (N = 6 mice per cell line) with tumor volumes presented in mm3. B, Weights of the tumors from A at the ethical endpoint. C, Western blot analysis of the tumors from A to verify the presence of mutant TP53 protein in the control cancer cells and to confirm its absence in the tumors arising from the mutant TP53–deleted cancer cells. Probing for β-Actin was used as a protein loading control. D, Numbers of metastatic cells and nodules in the left lungs of NSG mice that had been injected with MDA-MB-231 breast cancer cells, either mutant TP53-expressing control cells or the mutant TP53-deleted derivatives, into their mammary fat pads (N = 6 mice for each cancer cell line). The primary breast tumors were resected when they had reached 200 mm3 to enable analysis of metastasis thereafter. E, Western blot analysis of the metastases from D to verify the presence or absence of mutant TP53, respectively. Probing for β-Actin was used as a protein loading control. F, Volume and weight of the primary tumors in immune-competent mice transplanted with EO771 mouse breast cancer cells, either mutant Trp53–expressing control cells or their mutant Trp53–deleted derivatives. The breast cancer cells were transplanted into mammary fat pads of Cas9 transgenic mice (C57BL/6 background) to prevent immune rejection caused by Cas9 expression. G, Western blot analysis of the tumors from F to verify the presence of mutant TRP53 in the control cells or its absence in the mutant Trp53–deleted derivatives. Probing for β-Actin was used as a protein loading control. H, Growth of the human colon cancer–derived organoids WCB123LU, either the mutant TP53–expressing controls or the mutant TP53–deleted derivatives, in NSG mice (n = 6 mice per organoid line) with tumor volume presented in mm3. I, Weights of the tumors from H at the ethical endpoint. J, Western blot analysis of the tumors from H to verify the presence of mutant TP53 in the tumors derived from the control organoids or its absence in the tumors derived from the mutant TP53–deleted derivatives. K, Hematoxylin and eosin staining and IHC of the tumors from H to verify the presence of mutant TP53 in the control tumors or its absence in the mutant TP53–deleted derivatives. IHC analysis of Ki-67 in the tumors from H to reveal the expression of this marker of cell proliferation in tumors derived from the control mutant TP53–expressing colon cancer organoids or their mutant TP53–deleted derivatives. Magnification, 200×. L, Mean difference plot for the RNA-seq differential gene expression analysis comparing tumors in NSG mice that had been derived from mutant TP53–expressing control WCB123LU colon cancer organoids with tumors in NSG mice derived from the mutant TP53–deleted derivatives. The x-axis shows the average gene log expression, whereas the y-axis shows gene log2 fold change. Points colored red and blue indicate genes that are significantly upregulated or downregulated, respectively, in the tumors derived from the mutant TP53–deleted colon cancer organoids compared with the mutant TP53–expressing control tumors. Data in B, D, and I are presented as mean ± SEM of results from experiments conducted in triplicate.
Figure 7. Analysis of the DepMap database does not identify mutant TP53 as a cancer cell dependency. A, Analysis of the DepMap database shows that the deletion of mutant TP53 using CRISPR had no impact on the growth of 391 human cancer cell lines encompassing 158 different TP53 mutations. RNAi-mediated removal of mutant TP53 impaired the growth of not only a small number of cancer cell lines expressing mutant TP53 but also of some cancer cell lines that are TP53 deficient, demonstrating the off-target effects of RNAi. Removal of wt TP53 by either CRISPR or RNAi led to a growth advantage in many cancer cell lines expressing wt TP53. B, Mining of the DepMap database shows that the in vitro growth of human cancer cell lines expressing mutant BRAF is impaired when mutant BRAF is removed by using CRISPR/Cas9 or RNAi technology. C, Mining of the DepMap database shows that the in vitro growth of human cancer cell lines expressing mutant RAS is impaired when mutant RAS is removed by using CRISPR/Cas9 or RNAi technology.
Figure 7.
Analysis of the DepMap database does not identify mutant TP53 as a cancer cell dependency. A, Analysis of the DepMap database shows that the deletion of mutant TP53 using CRISPR had no impact on the growth of 391 human cancer cell lines encompassing 158 different TP53 mutations. RNAi-mediated removal of mutant TP53 impaired the growth of not only a small number of cancer cell lines expressing mutant TP53 but also of some cancer cell lines that are TP53 deficient, demonstrating the off-target effects of RNAi. Removal of wt TP53 by either CRISPR or RNAi led to a growth advantage in many cancer cell lines expressing wt TP53. B, Mining of the DepMap database shows that the in vitro growth of human cancer cell lines expressing mutant BRAF is impaired when mutant BRAF is removed by using CRISPR/Cas9 or RNAi technology. C, Mining of the DepMap database shows that the in vitro growth of human cancer cell lines expressing mutant RAS is impaired when mutant RAS is removed by using CRISPR/Cas9 or RNAi technology.

References

    1. Aylon Y, Oren M. Living with p53, dying of p53. Cell 2007;130:597–600. - PubMed
    1. Janic A, Valente LJ, Wakefield MJ, Di Stefano L, Milla L, Wilcox S, et al. . DNA repair processes are critical mediators of p53-dependent tumor suppression. Nat Med 2018;24:947–53. - PubMed
    1. Kastenhuber ER, Lowe SW. Putting p53 in context. Cell 2017;170:1062–78. - PMC - PubMed
    1. Vousden KH, Lane DP. p53 in health and disease. Nat Rev Mol Cell Biol 2007;8:275–83. - PubMed
    1. Vousden KH, Prives C. P53 and prognosis: new insights and further complexity. Cell 2005;120:7–10. - PubMed

Substances