

Reasons individuals stop eating questionnaire (RISE-Q) among adults in the United Arab Emirates
- PMID: 37878633
- PMCID: PMC10599582
- DOI: 10.1371/journal.pone.0293386
Reasons individuals stop eating questionnaire (RISE-Q) among adults in the United Arab Emirates
Abstract
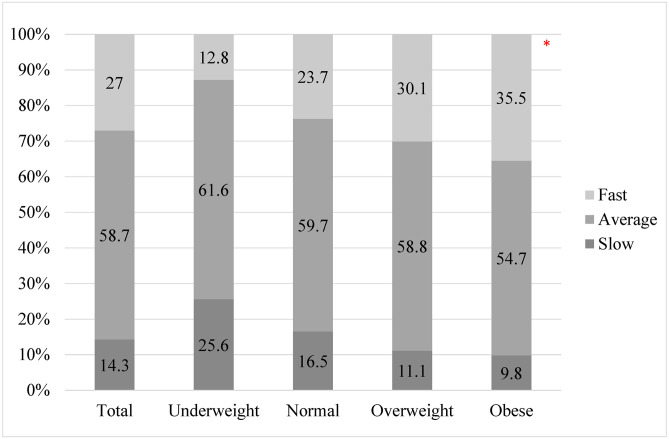
The relationship between obesity and satiation is complex and bidirectional. Understanding differences in reasons for meal termination may enhance our understanding of overeating risks and susceptibility to overconsumption. This study aimed to investigate the reasons why individuals in the UAE stop eating. A cross-sectional web-based study was conducted among adults ≥18 years in the UAE (n = 1482). Using a self-administered online questionnaire, we collected information on sociodemographic characteristics, lifestyle habits, and eating behavior using the Reasons Individuals Stop Eating-Questionnaire (RISE-Q-15) used twice for breakfast/main meal. The items were categorized into five scales; decreased food appeal (DFA), physical satisfaction (PS), planned amount (PA), self-consciousness (SC), and decreased priority of eating (DPE). All items were scored from 1 to 7 ranging between 3 to 21 on each scale. A paired t-test was used to evaluate the difference between the RISE-Q scores on each scale concerning the two meals. The main reason why participants stopped eating breakfast was under the PS scale (14.91 ± 3.72), followed by the PA scale (14.58 ± 3.00). The main reason why participants stopped eating main meals was under the PS scale (14.78 ± 3.56), followed by the PA scale (14.77 ± 43.81). The mean score of the DPE scale was significantly higher for breakfast than the main meal (p = 0.038). More than half of the participants reported an average eating rate (58.7%). Pearson's chi-square analysis revealed that the eating rate was dependent on BMI (p<0.001). Considering individual mealtimes and addressing factors related to PS and PA of food is crucial when designing nutrition interventions aiming to promote healthy eating habits among adults in the UAE.
Copyright: © 2023 Ismail et al. This is an open access article distributed under the terms of the Creative Commons Attribution License, which permits unrestricted use, distribution, and reproduction in any medium, provided the original author and source are credited.
Conflict of interest statement
The authors have declared that no competing interests exist.
Figures
References
-
- Lim HJ, Xue H, Wang Y. Global Trends in Obesity. In: Meiselman HL, editor. Handbook of Eating and Drinking: Interdisciplinary Perspectives. Cham: Springer International Publishing; 2020. p. 1217–35.
-
- WHO WHO. Obesity and overweight in the Western Pacific 2022 [cited 2022 15/4/2022]. https://www.who.int/westernpacific/health-topics/obesity.
-
- MoHAP. UAE NATIONAL HEALTH SURVEY REPORT 2017–2018. United Arab Emirates: Ministry of Health and Prevention, 2018.
MeSH terms
LinkOut - more resources
Full Text Sources
Medical
