. 2023 Oct 25;15(719):eadj0740.
doi: 10.1126/scitranslmed.adj0740. Epub 2023 Oct 25.

The tumor microenvironment state associates with response to HPV therapeutic vaccination in patients with respiratory papillomatosis

Affiliations

The tumor microenvironment state associates with response to HPV therapeutic vaccination in patients with respiratory papillomatosis

Scott M Norberg et al. Sci Transl Med. .

Abstract

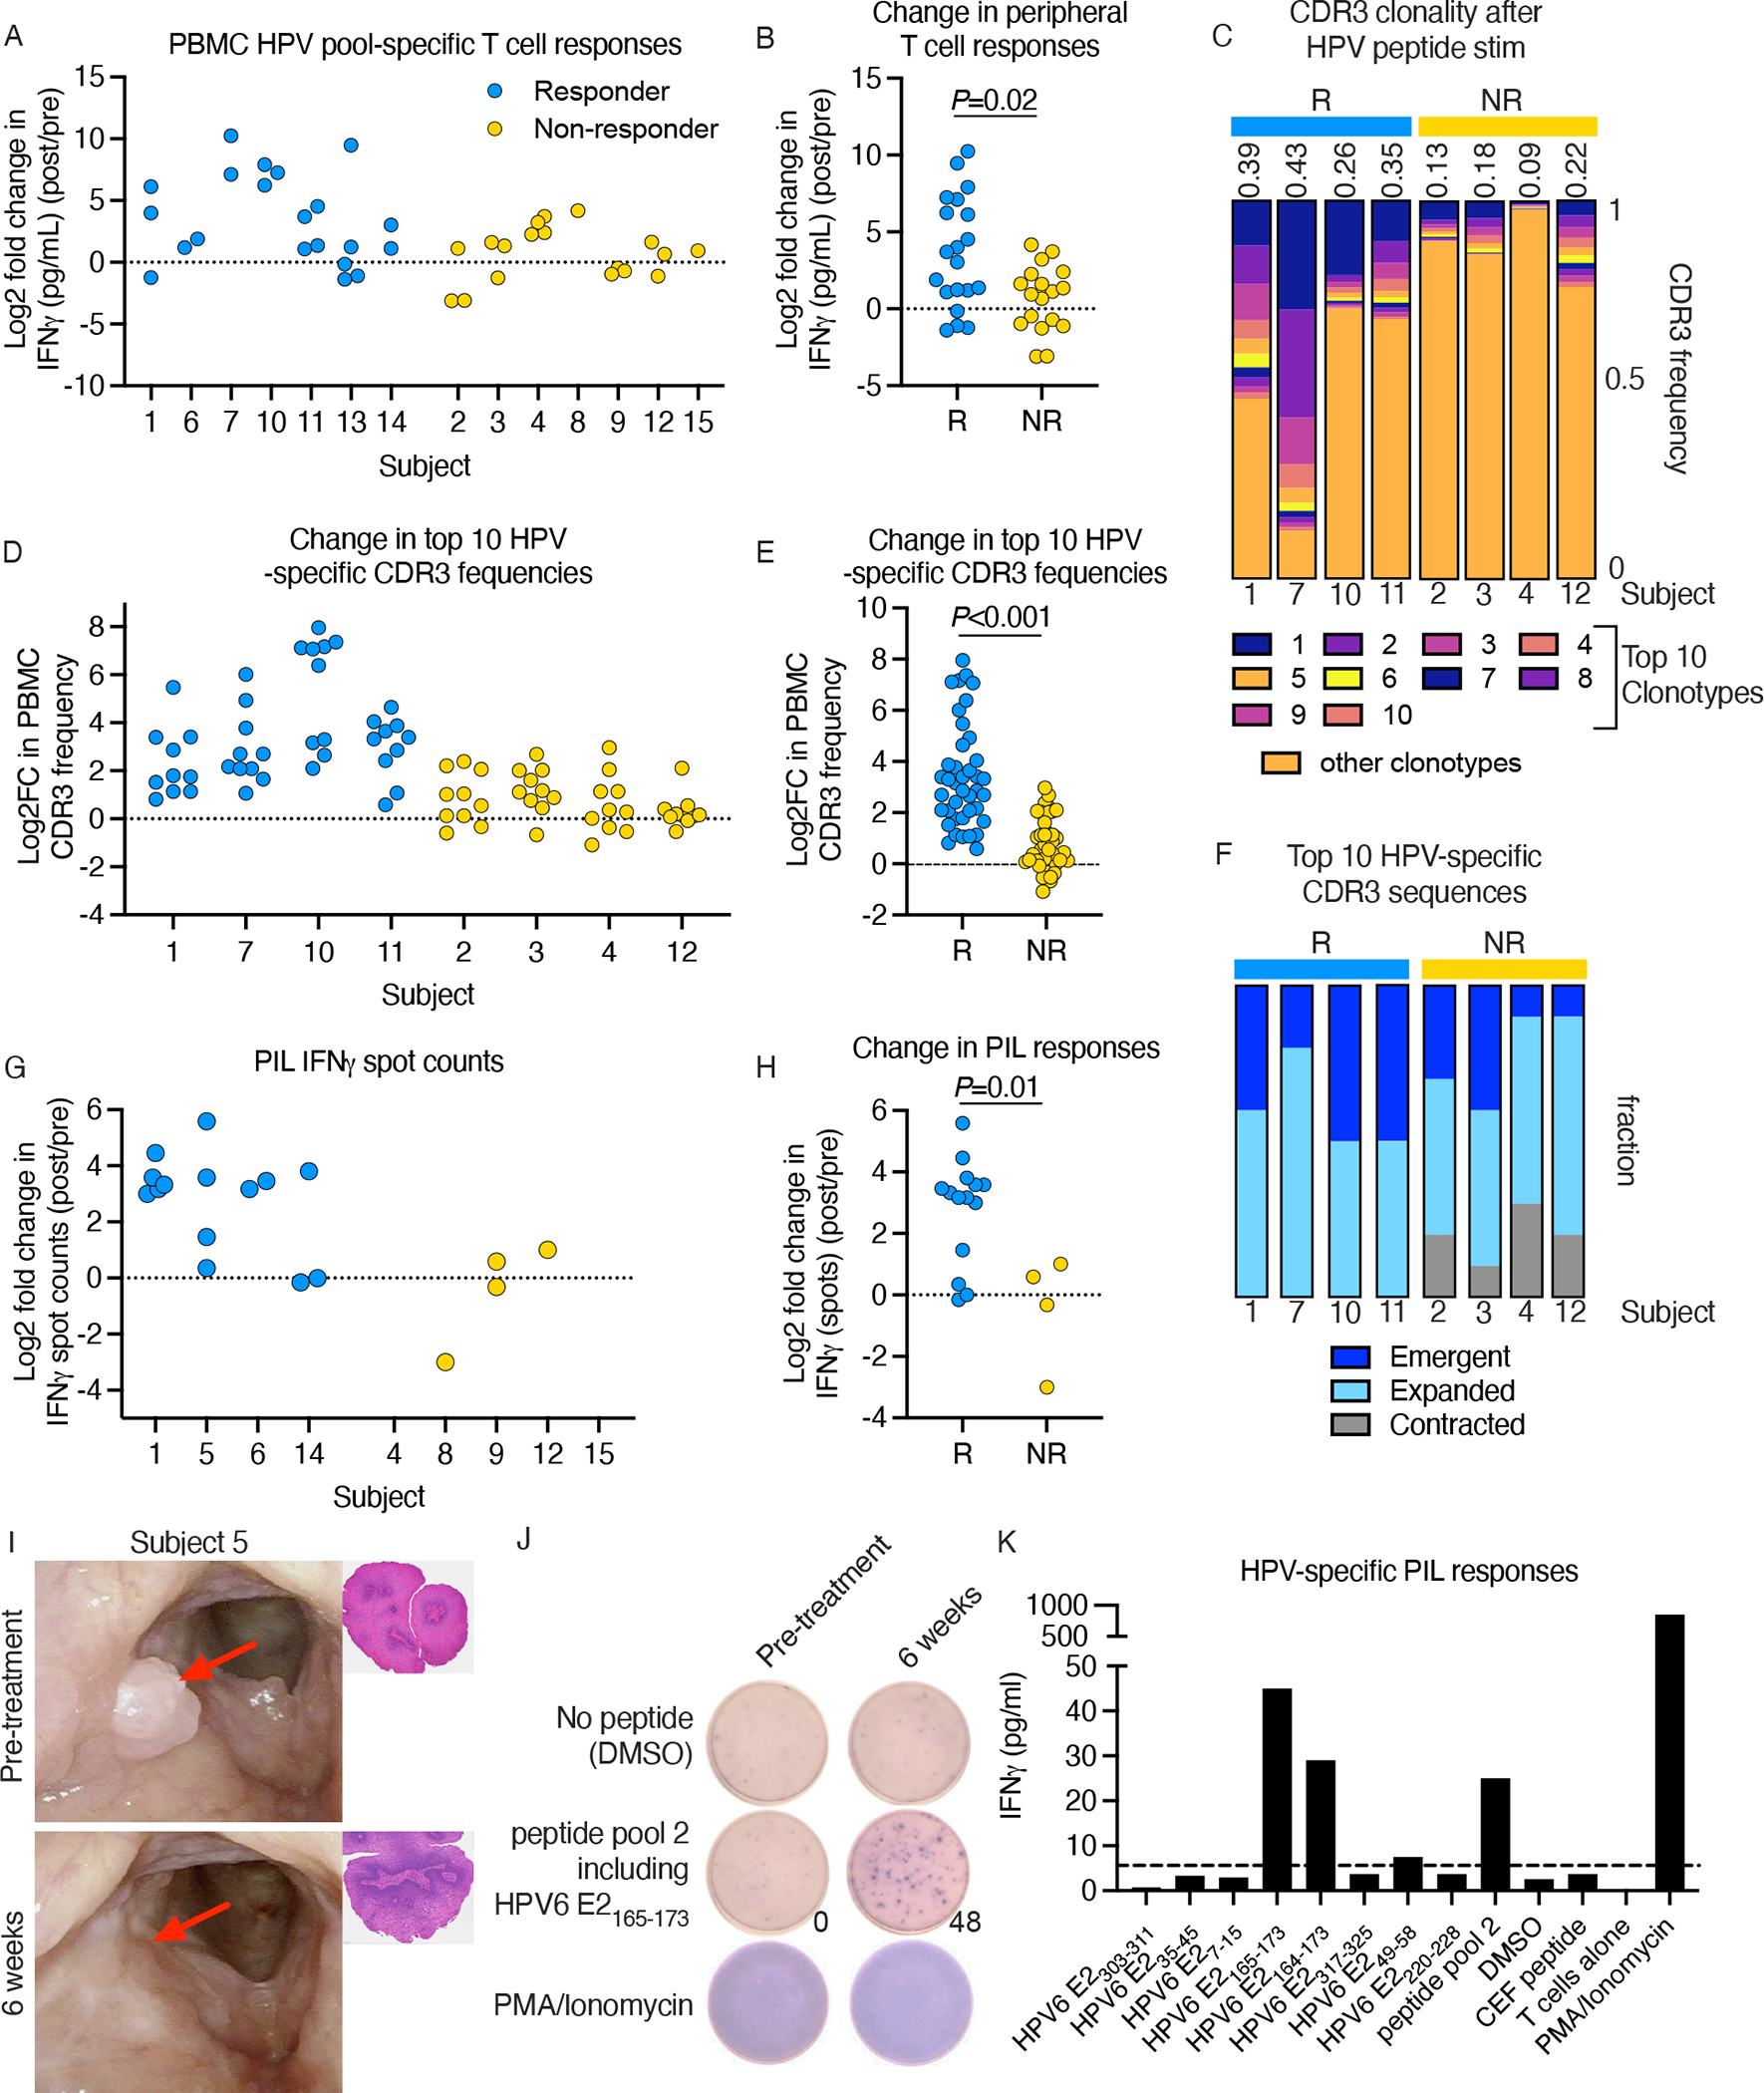
Recurrent respiratory papillomatosis (RRP) is a rare, debilitating neoplastic disorder caused by chronic infection with human papillomavirus (HPV) type 6 or 11 and characterized by growth of papillomas in the upper aerodigestive tract. There is no approved medical therapy, and patients require repeated debulking procedures to maintain voice and airway function. PRGN-2012 is a gorilla adenovirus immune-therapeutic capable of enhancing HPV 6/11-specific T cell immunity. This first-in-human, phase 1 study (NCT04724980) of adjuvant PRGN-2012 treatment in adult patients with severe, aggressive RRP demonstrates the overall safety and clinically meaningful benefit observed with PRGN-2012, with a 50% complete response rate in patients treated at the highest dose. Responders demonstrate greater expansion of peripheral HPV-specific T cells compared with nonresponders. Additional correlative studies identify an association between reduced baseline papilloma HPV gene expression, greater interferon responses and expression of CXCL9 and CXCL10, and greater papilloma T cell infiltration in responders. Conversely, nonresponders were characterized by greater HPV and CXCL8 gene expression, increased neutrophilic cell infiltration, and reduced T cell papilloma infiltration. These results suggest that papilloma HPV gene expression may regulate interferon signaling and chemokine expression profiles within the tumor microenvironment that cooperate to govern clinical response to therapeutic HPV vaccination in patients with respiratory papillomatosis.


Conflict of interest statement

Competing Interests

EW, AL, RS, HS and DEB are employees of Precigen, Inc. DEB has a patent related to this work titled ‘Human papillomavirus vaccines and uses of the same for HPV associated diseases’, patient number WO2022/115470. Otherwise the authors declare that no competing interests or consulting declarations exist.

Figures

Figure 1 –
Figure 1 –. Clinical activity of PRGN-2012.
A, a bar plot shows the total number of clinically indicated interventions during the 12 months before (left) and after (right) the study for patients treated at DL1 (patients 1–3) and DL2 (patients 4–15). Throughout, responders are in blue and non-responders are in gold. Patients that require no interventions in the 12 months after study treatment are considered complete responders, and patients that require 50% or fewer interventions in the 12 months after the study treatment compared to the 12 months before are considered partial responders. Responders are complete and partial responders. B, a waterfall plot shows the change in clinically indicated procedures in the year after the study treatment compared to the year before. Patients are rank ordered in magnitude of reduction in intervention frequency from left to right. The solid horizontal line indicates the threshold for a 50% reduction, separating responders from non-responders. C, representative clinical endoscopy images are shown that demonstrate the appearance of the larynx in 4 of 6 CRs that had no visible disease following PRGN-2012 treatment. The image Derkay score (upper-left) and timeframe since completion of the study treatment (upper-right) are inset. Post-treatment images were obtained 12 months after completion of study treatment.
Figure 2 –
Figure 2 –. Peripheral and papilloma HPV-specific T cell responses.
A, a dot plot shows the log-transformed fold change in HPV-specific T cell responses from the peripheral blood 6 weeks after completing the study treatment compared to before. Each dot represents the log-transformed fold change in IFNγ concentration following peptide stimulation with an individual pool of HPV peptides encoded in PRGN-2012 (see Methods). All PBMC samples were stimulated with all peptide pools, but only pools to which IFNγ responses were detected in the pre- or post-treatment samples are shown. N=14 patients; insufficient pre-treatment PBMC were available from patient 5. Throughout, responders are in blue and non-responders are in gold. B, a dot plot shows the summarized changes in HPV-specific peripheral blood responses. Significance was determined with a Mann-Whitney two-tailed test. C, bar plots show the fraction of the post-treatment TCRβ repertoire represented by the top 10 CDR3 frequencies determined to be HPV-specific in the HPV 6/11 peptide stimulation FEST assay. Colors refer to distinct sequences across patients. The Simpson clonality index is shown above each bar plot. Top horizontal bars indicate treatment response. R, responder; NR, non-responder. D, a dot plot shows the log-transformed fold change in the frequency of the top 10 HPV-specific CDR3 sequences (determined in the FEST assay) from the peripheral blood 6 weeks after completing PRGN-2012 treatment compared to before treatment without peptide stimulation. E, a dot plot shows the summarized changes in the top 10 HPV-specific CDR3 sequences. Significance was determined with a Mann-Whitney two-tailed test. F, bar plots summarize the fraction of the top 10 peripheral blood HPV-specific CDR3 sequences (determined in the FEST assay) detected in the post-treatment peripheral blood that were undetectable (emergent), detected at lower frequencies (expanded) or detected and higher frequencies (contracted) compared to the pre-treatment peripheral blood. Top horizontal bars indicate treatment response. G, a dot plot shows the log2 transformed fold change in HPV-specific papilloma infiltrating lymphocytes (PIL) after completing the study treatment compared to before. Each dot represents the log-transformed fold change in IFNγ spot count following co-culture of PIL with antigen presenting cells loaded with an individual pool of HPV peptides encoded in PRGN-2012 (see Methods). Only pools to which IFNγ responses were detected in the pre-or post-treatment samples are shown. N=9 patients; no post-treatment biopsies were available for patients 7, 10, 11 and 13, and patients 2 and 3 failed to established pre-treatment PIL cultures. H, a dot plot shows summarized changes in HPV-specific PIL responses. Significance was determined with a Mann-Whitney two-tailed test. I, clinical endoscopy images showing the pre-treatment and 6-week timepoint laryngeal appearance for patient 5. The red arrows indicate the pre-treatment and 6-week biopsy locations from which PIL were generated for experiments shown in j & k. H&E photomicrographs show papilloma histology. J, representative IFNγ ELISpot wells showing IFNγ spots following stimulation with pool 2 peptides (IFNγ spot counts are inset) in the pre-treatment and 6-week timepoints as well as negative (DMSO alone) and positive (PMA/Ionomycin) controls. K, a bar plot shows IFNγ concentrations following co-culture of the 6 weeks PIL sample with antigen presenting cells loaded with individual peptides included in pool 2.
Figure 3 –
Figure 3 –. Association between papilloma T cells and clinical response.
A, representative photomicrographs of T cell immunofluorescence in baseline papilloma biopsies are shown in responders (top row) and non-responders (bottom row). The yellow line highlights the papilloma-stroma interface, annotated as ‘P’ for papilloma and ‘S’ for stroma. B, dot plots show the density of CD8 T cells in the papilloma and stroma or responders and non-responders. Significance was determined with a Mann-Whitney two-tailed test. C, box-and-whisker plots show papilloma cell normalized mean HPV gene transcript counts in responders and non-responders, determined from single-cell RNA-seq. Significance determined with a two-way ANOVA. D, box-and-whisker plots show mean cell normalized reactome IFNγ signaling module scores in different cell types (x-axis) in responders and non-responders, determined from single-cell RNA-seq. Significance determined with a two-way ANOVA. E, heat maps show the row-normalized chemokine transcript counts in different cell types (y-axis). Bar plots on the right indicate mean expression. Top horizontal bars indicate treatment response. Significance of the difference between responders and non-responders was determined by comparing average expression values with a two-way ANOVA. F, a violin plot shows the CXCR3 transcript counts for CD8 and CD4 papilloma T cells, determined from single-cell RNA-seq. Significance was determined with a Mann-Whitney two-tailed test. G, a violin plot shows the percentage of (total) cells positive for CXCL9 or CXCL10. Significance was determined with a Mann-Whitney two-tailed test. Representative photomicrographs of RNAscope immunofluorescence are shown. H, a dot plot shows the expression of select T cell-related genes across T lymphocyte clusters identified with single-cell RNA-seq, sorted by fold change in cell numbers detected in responders and non-responders (responders/non-responders; lower bar graph). T cells enriched in non-responders are in the left columns, T cells enriched in responders and in the right columns. Circle color corresponds to scaled average expression; circle size denotes fraction of cells with non-zero gene expression of corresponding gene. Top bar graph represents total cell number.
Figure 4 –
Figure 4 –. Association between papilloma myeloid cells and clinical response.
A, a dot plot shows the expression of select myeloid cell-related genes across myeloid clusters identified with single-cell RNA-seq, sorted by fold change in cell numbers detected in responders and non-responders (responders/non-responders; lower bar graph). Myeloid cells enriched in non-responders are in the left columns, myeloid cells enriched in responders and in the right columns. Circle color corresponds to scaled average expression; circle size denotes fraction of cells with non-zero gene expression of corresponding gene. Top bar graph represents total cell number. B, heat maps show the row-normalized chemokine transcript counts in different cell types (y-axis). Bar plots on the right indicate mean expression. Top horizontal bars indicate treatment response. Significance of the difference between responders and non-responders was determined by comparing average expression values with a two-way ANOVA. C, a heat map shows the row-normalized VEGF transcript counts in different cell types (y-axis). Bar plots on the right indicate mean expression. Top horizontal bars indicate treatment response. Significance of the difference between responders and non-responders was determined by comparing average expression values with a two-way ANOVA. D, a violin plot shows the percentage of (total) cells positive for CXCL8. Significance was determined with a Mann-Whitney two-tailed test. Representative photomicrographs of RNAscope immunofluorescence are shown. E, representative photomicrographs of myeloid cell immunofluorescence in baseline papilloma biopsies are shown in responders (top row) and non-responders (bottom row). The yellow line highlights the papilloma-stroma interface, annotated as ‘P’ for papilloma and ‘S’ for stroma. F, dot plots show the density of neutrophilic cells (PMN) and macrophages (Mθ) in the papilloma and stroma or responders and non-responders. Significance was determined with a Mann-Whitney two-tailed test.

References

    1. Bai K, Allen C, How Enhancing Immunity to Low-Risk HPV Could Cure Recurrent Respiratory Papillomatosis. Laryngoscope 131, 2041–2047 (2021). - PMC - PubMed
    1. Sievers C et al., Comprehensive multiomic characterization of human papillomavirus-driven recurrent respiratory papillomatosis reveals distinct molecular subtypes. Commun Biol 4, 1416 (2021). - PMC - PubMed
    1. Cancer Genome Atlas N, Comprehensive genomic characterization of head and neck squamous cell carcinomas. Nature 517, 576–582 (2015). - PMC - PubMed
    1. Allen CT et al., Safety and clinical activity of PD-L1 blockade in patients with aggressive recurrent respiratory papillomatosis. J Immunother Cancer 7, 119 (2019). - PMC - PubMed
    1. Robbins Y et al., Dual PD-L1 and TGF-b blockade in patients with recurrent respiratory papillomatosis. J Immunother Cancer 9, (2021). - PMC - PubMed

Supplementary concepts