. 2023 Oct 27;9(43):eadj1010.
doi: 10.1126/sciadv.adj1010. Epub 2023 Oct 25.

Synaptic BMAL1 phosphorylation controls circadian hippocampal plasticity

Affiliations

Synaptic BMAL1 phosphorylation controls circadian hippocampal plasticity

Ilaria Barone et al. Sci Adv. .

Abstract

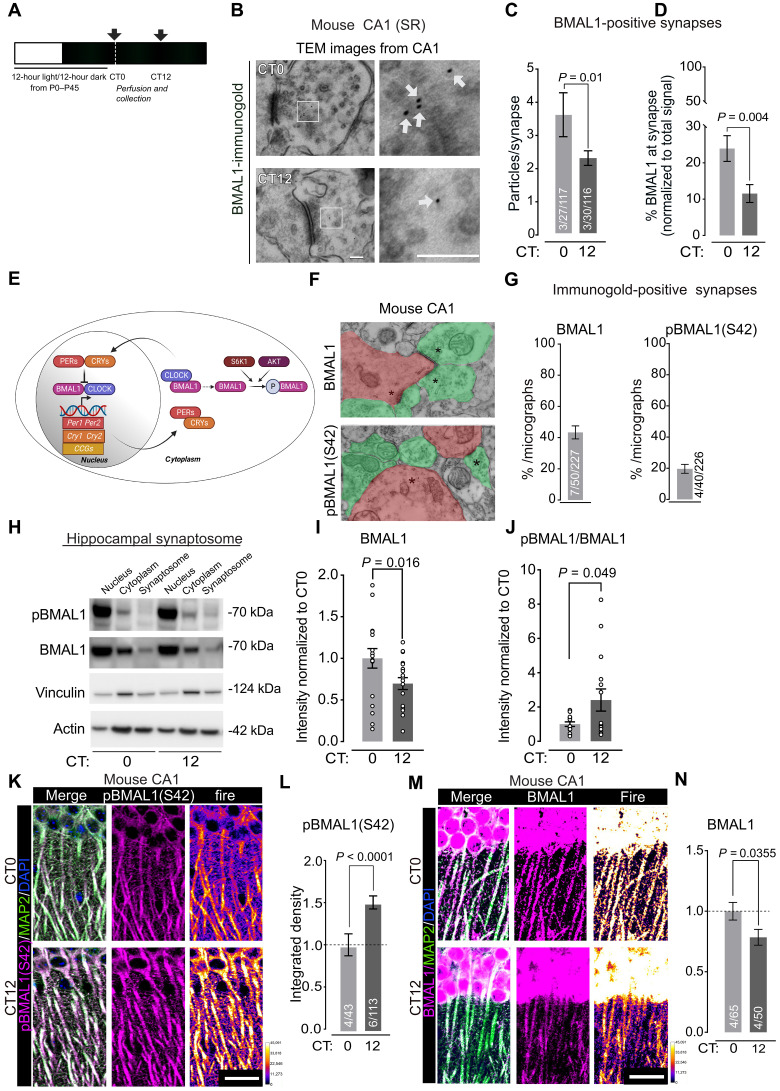
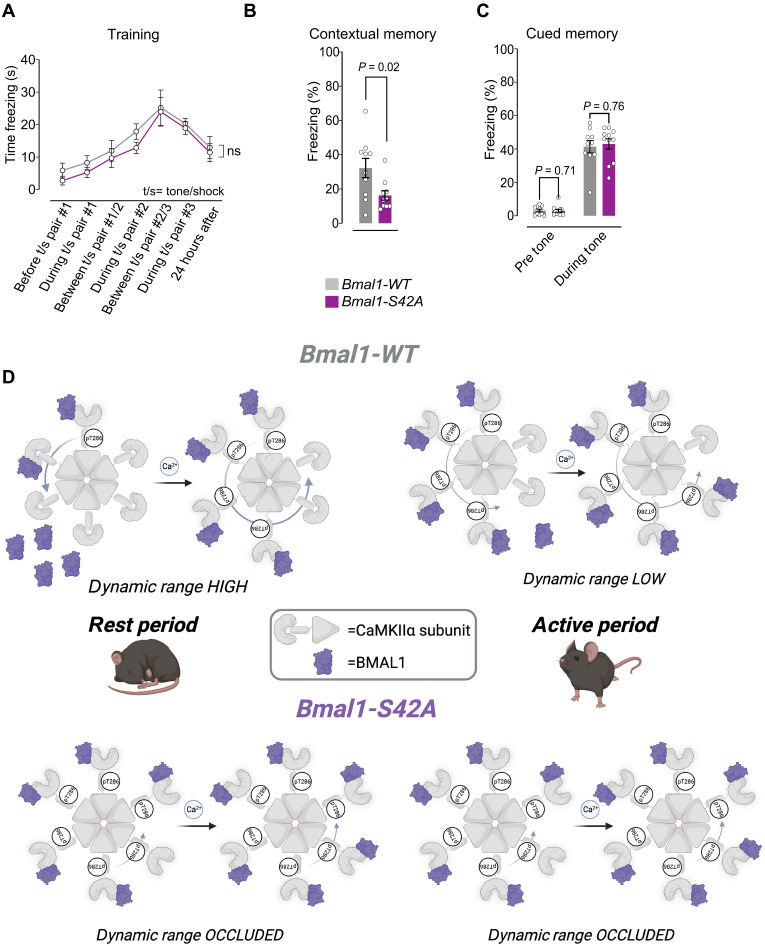
The time of day strongly influences adaptive behaviors like long-term memory, but the correlating synaptic and molecular mechanisms remain unclear. The circadian clock comprises a canonical transcription-translation feedback loop (TTFL) strictly dependent on the BMAL1 transcription factor. We report that BMAL1 rhythmically localizes to hippocampal synapses in a manner dependent on its phosphorylation at Ser42 [pBMAL1(S42)]. pBMAL1(S42) regulates the autophosphorylation of synaptic CaMKIIα and circadian rhythms of CaMKIIα-dependent molecular interactions and LTP but not global rest/activity behavior. Therefore, our results suggest a model in which repurposing of the clock protein BMAL1 to synapses locally gates the circadian timing of plasticity.


Figures

Fig. 1.
Fig. 1.. BMAL1 localizes to hippocampal synapses.
(A) Confocal images of mouse postnatal day 45 (P45) hippocampal CA1 sections coimmunolabeled with BMAL1 and MAP2, as indicated. Nuclei are counterstained with 4′,6-diamidino-2-phenylindole (DAPI). SP, stratum pyramidale; SR, stratum radiatum. Scale bars, 50 μm. (B) Immunohistochemistry of representative confocal image from P45 hippocampus coimmunolabeled with BMAL1 and presynaptic protein vGLUT1 from animals euthanized at zeitgeber times 0 to 2. Areas of overlap are depicted as insets (A1) to (A4). (C) Mander's overlap coefficient for BMAL1/vGLUT1. To control for random coincidence, vGLUT1 image pixels were randomized; Student’s t test, n = 3 animals, 10 fields per animal, P < 0.0001. (D) Immunoblot of synaptosome fractions from P45 mouse hippocampi. AP-2β, vGLUT1, and PSD-95 demonstrate specific enrichment of synaptic compartments. Vinculin and histone H4 mark the cytosolic and nuclear compartments, respectively, while β-actin serves as an additional loading control. (E) Schematic for immunogold labeling of hippocampal slices followed by transmission electron microscopy (TEM) to label BMAL1. (F) Pre-embedded immunogold electron microscopy images for BMAL1 in CA1 stratum radiatum layer of P45 (left panels) Bmal1+/+ and (right panels) Bmal1−/− mice are shown. BMAL1 localizes to both the presynaptic and postsynaptic compartments. Magnifications show the presence of BMAL1 immunolabeled particles near synaptic vesicles and in a dendritic spine. Note absence of immunogold signal in Bmal1−/− hippocampi. Experiments were repeated three independent times from three to four mice per genotype and five images per sample. Scale bars, 100 nm and 10 nm, as indicated. (G) Percentage of BMAL1 immunoparticles at synapses normalized by micrograph. (H) Deconvolution of gated stimulation emission depletion (STED) images of embryonic day 18 (E18) mouse primary hippocampal neurons at day 15 in vitro (DIV15) coimmunolabeled with BMAL1 and PSD-95, Bassoon, or synaptophysin, respectively (left to right). Bottom: Relative plot intensity profile for line functions through BMAL1 colocalized puncta. (I) Mander’s overlap coefficient, comparing overlap to micrographs in which pixels were randomized, n = 3 independent experiments. Scale bars, 10 μm. A.U., arbitrary units.
Fig. 2.
Fig. 2.. BMAL1 and pBMAL1(S42) diurnally localize at synapses.
(A) Schematic representation of experimental paradigm for collection of circadian samples. (B) Pre-embedded immunogold electron micrographs of CA1 stratum radiatum from P45 Bmal1+/+ collected at CT0 or CT12 showing diurnal variation in presynaptic BMAL1. Scale bars, 100 nm. (C) Number of synaptic immunogold BMAL1 puncta quantified per synapse; annotations indicate animals/micrographs/synapses quantified. (D) Quantification of the percentage of BMAL1 signal that is presynaptically localized compared to all BMAL1 signal in a micrograph from CA1 EM micrographs at CT0 and CT12; n = 3 mouse per genotype per time point, 10 sections per mouse. Student’s unpaired two-tailed t test. (E) Schematic showing the TTFL and BMAL1 phosphorylation at S42. (F) Pre-embedded immunogold electron microscopy for BMAL1 CT0 (top) and pBMAL1(S42) (bottom) in the CA1 stratum radiatum from P45 Bmal1+/+. Green areas indicate examples of presynaptic termini, and red areas indicate examples of postsynaptic termini; asterisks indicate antibody-positive termini per active zone quantified for BMAL1 and pBMAL1(S42), respectively. (G) Quantification of percentage of BMAL1 (left) and pBMAL1(S42) (right) immunoparticles in the presynaptic area normalized by micrograph; n = 3 mouse per genotype per time point, 10 sections per mouse euthanized at CT0. (H) Immunoblot of synaptosome fractions in P45 mouse hippocampi harvested at CT0 and CT12. Vinculin and actin served as normalization controls. (I) Quantification of the BMAL1 intensity at synaptosome relative to total amount (nucleus plus cytosolic) normalized on CT0. (J) Quantification of the synaptosome pBMAL1(S42) signal normalized to total BMAL1 protein. (K and M) MAP2 and pBMAL1(S42) (K) or BMAL1 (M) coimmunostaining of mouse CA1 stratum pyramidale and stratum radiatum. (L and N) Quantification of CA1 stratum radiatum from P45 mice with transformed spectrogram (fire) of unmanipulated images for visual enhancement of pBMAL1(S42) or BMAL1 signal, each normalized to CT0. MAP2 is a marker for dendrites; annotations on histograms indicate animal/sections. Scale bars, 10 μm.
Fig. 3.
Fig. 3.. pBMAL1(S42) is required for diurnal variation of BMAL1 but not for global circadian behavior.
(A) Schematic for the Bmal1-S42A mouse model. (B) Confirmation of Bmal1-S42A genotyping by loss of a Btsα1 cut site. (C) Immunoblot showing absence of pBMAL1(S42) in Bmal1-S42A whole brain lysate. (D) Representative actograms of Bmal1-S42A mice compared to Bmal1-WT littermates in 12-hour light/12-hour dark cycles followed by total darkness (D/D; red arrowhead). (E) Free-running period in D/D, Mann Whitney U test, P = 0.23, n = 11 to 12 animals per genotype. (F) BMAL1 immunostaining and quantification of CA1 stratum radiatum from P45 mice with transformed spectrogram (fire) to enhance visualization of BMAL1 signal; n = 3 mice per genotype per time point, 30 sections per mouse. Scale bars, 10 μm. (G) Pre-embedded immunogold electron microscopy for BMAL1 in CA1 stratum radiatum of hippocampus from P45 Bmal1-WT and Bmal1-S42A mice collected at CT0; n = 3 experiments, 5 mice per genotype, 10 sections per mouse, >800 synapses per genotype. Scale bars, 100 nm. (H) Deconvolution of gated STED images of E18 mouse primary hippocampal neurons DIV15 from Bmal1-WT and Bmal1-S42A coimmunolabeled with BMAL1 and either PSD-95 or Bassoon as indicated. Right: Plot of the relative intensity profile for representative puncta. (I) Quantification of Mander’s overlap coefficients for BMAL1 with respective synaptic proteins in Bmal1-WT and Bmal1-S42A mouse neurons; n = 3 independent experiments. (J) Hippocampal synaptosomes from Bmal1-WT and Bmal1-S42A. Nuclear (Nucl), cytosolic (Cyto), and synaptosomal (Syn) fractions collected from animals harvested at CT0 and CT12. Actin served as a loading control. (K) Quantification of the circadian index calculated as the ratio of densitometric signal at CT0/CT12 and compared between genotypes; n = 6 animals per time point. (L) Quantification of the circadian index (CT0/CT12) from TEM immunosignal from Bmal1-WT and Bmal1-S42A; data are means ± SEM. Two-way comparisons were made by Student’s unpaired two-tailed t test; three- or more-way comparisons were made by ANOVA with Tukey multiple comparisons test.
Fig. 4.
Fig. 4.. BMAL1 interacts with CaMKIIα in a manner dependent on pBMAL1(S42).
(A) BMAL1 synaptic interaction network (see Materials and Methods and table S1) demonstrates two major pathway clusters: synaptic vesicle–associated proteins (green), P = 1.1 × 10⁻¹², and calcium signaling proteins (blue), P = 1.3 × 10⁻⁸ (Benjamini-Hochberg). (B) Representative immunoblot of immunoprecipitations of Bmal1-WT forebrain synaptosome ran in duplicate. Empty lanes indicated by dotted lines. GluN1, GluA1, and CALM1 (calmodulin1) are positive controls. Experiments were run in triplicate on independent biological samples (six technical replicates). (C) Representative immunoprecipitation from Bmal1-WT forebrain synaptosome preparation. Experiments were run in triplicate on independent biological samples (six technical replicates). The orange dotted line indicates where the figure was cropped for visual clarity. All data represent samples processed on a single membrane. (D) Representative confocal images of neurites from E18 rat primary hippocampal neurons cultured to DIV10 are shown. Colocalization indicated by arrowheads. Scale bars, 10 μm. Two-way ANOVA, n = 3 experiments, 5 cells per condition, 5 neurites per image, F1,152 = 56.72, ****P < 0.0001. (E) Representative confocal images of neurites from Bmal1-WT and Bmal1-S42A primary mouse hippocampal neurons cultured to DIV10 and coimmunolabeled as indicated. Colocalization sites are indicated by arrowheads. Scale bars, 10 μm. Quantifications performed on 50-μm neurite and n = 80 to 100 puncta from 20 to 30 cells and three independent experiments, F1,285 = 198.2, ****P < 0.0001. (F) Representative deconvolutions of gated STED images of E18 mouse primary hippocampal neurons DIV15 showing a neurite with a putative spine coimmunolabeled with BMAL1 (magenta) and CaMKIIα (green). Magnifications showing details of BMAL1 and CaMKIIα spatial co-occurrence and line intensity profiles. (G) Schematic of proximity ligation assay (PLA). (H) Representative E18 mouse primary hippocampal neurons at DIV15 from Bmal1-WT and Bmal1-S42A immunostained for MAP2 (green) as dendritic marker and coprobed by PLA in magenta. See corresponding controls (fig. S4G). Scale bars, 10 μm. (I) Quantification of PLA puncta per cell. Scale bars, 10 μm. n = 3 experiments, 5 cells per condition, 5 neurites per image. Student’s t test.
Fig. 5.
Fig. 5.. BMAL1 promotes CaMKIIα autophosphorylation in vitro and in neurons.
(A) In vitro kinase assay. Recombinant full-length glutathione S-transferase (GST)–tagged BMAL1 and GST-CaMKIIα were incubated with 32P-γATP and either 200 μM Ca2+, recombinant calmodulin, or pCaMKIIα(T286) inhibitor autocamtide as indicated. Antibodies were detected by Western blot (WB); 32P-γATP incorporation was measured by autoradiography (Autorad). Pink arrowhead, GST-BMAL1; blue arrowhead, GST-CaMKIIα. Quantification of pCaMKIIα(T286) signal was normalized to reaction with CaMKIIα alone (lane 3), n = 4 experiments, one-way ANOVA, F6,11 = 53.13, P < 0.001; yellow asterisks indicate multimers of free GST. (B and C) Representative confocal images of neurites from Bmal1-WT or Bmal1-S42A primary hippocampal neurons cultured to DIV10 immunolabeled for pCaMKIIα(T286) and relative pseudo-colored spectrogram are shown. Signal intensity/percentage of thresholded area was quantified; n = 20 cells from three experiments. Student’s t test. Scale bars, 10 μm.
Fig. 6.
Fig. 6.. pBMAL1(S42) is required for the circadian rhythm of hippocampal plasticity.
(A) Schematic of the cLTP experimental paradigm. (B) Representative E18 rat primary neurons treated with or without glycine as indicated and immunostained for pCaMKIIα(T286) (left) and pBMAL1(S42). pBMAL1(S42) signal is shown as spectral transformation of unmanipulated images to enhance visualization of the signal. (C) Quantification of the number of pBMAL1(S42)-positive puncta per 50-μm neurite length and (D) quantification of the mean pBMAL1(S42) intensity signal normalized to basal treatment (e.g., no glycine administration) condition; spectral intensity ranges were identically set for each image. (E) Representative mouse hippocampal primary neurons from Bmal1-WT and Bmal1-S42A after induction of cLTP, immunostained for surface GluA1. (F) Quantification of surface GluA1 intensity per 50 μm. ****P < 0.0001 and ***P = 0.002; not significant (ns), P = 0.8. Data are means ± SEM. Two-way comparisons were made by two-way ANOVA F1,58 = 28.12; numbers indicate experiments/cells per experiment/neurites. (G) Field excitatory postsynaptic potential (fEPSP) slope after theta burst stimulation (TBS) from Bmal1-WT and Bmal1-S42A slices harvested at CT0 and CT12. (H) Quantification of normalized slopes of fEPSPs 50 to 60 min after TBS (n = 6 per genotype). ANOVA F3,18 = 7.46, Tukey multiple comparisons test, ***P < 0.003. (I) Input-output curve (n = 6 per genotype). ANOVA, F1,58 = 0.128, P = 0.958. (J) Quantification of the half-maximal response (EC50) in microamperes. Data are means ± SEM, F1,58 = 3.37, P = 0.054. (K) Representative immunoblot of CaMKIIα immunoprecipitation from forebrain hippocampal synaptosome from Bmal1-S42A and Bmal1-WT littermates harvested at CT0 and CT12. (L) Quantification of protein immunoprecipitated by CaMKIIα. Signal intensity was calculated as the densitometry of the immunoprecipitated protein/input level for that protein normalized to wild-type CT0 for each with specific multiple comparisons as indicated. GluN2B F3,9 = 6.84, P = 0.003; GluA1 F3,9 = 1.40, P = 0.011, ANOVA for interaction; n = 3 experiments from four independent cohorts of mice.
Fig. 7.
Fig. 7.. BMAL1 phosphorylation regulates hippocampal long-term memory.
(A) Associative learning of tone (t) and foot shock (s), F1,38 = 0.13, P = 0.72. (B) Percentage of time spent freezing measured during a 300-s bin 24 hours after context fear conditioning, Mann-Whitney test, U = 21. (C) Time spent freezing during a 300-s measurement bin 24 hours after cued context fear condition; F1,38 = 0.09, P = 0.73. n = 10 Bmal1-WT and 11 Bmal1-S42A adult male littermates from three independent litters tested for all experiments. Two-way comparisons were performed as Student’s unpaired two-tailed t tests; three- or more-way comparisons were performed as ANOVAs with Tukey multiple comparisons tests. (D) Model for BMAL1-mediated regulation of circadian CaMKIIα dynamics. At the start of the rest period (CT0), BMAL1 levels are relatively high in synapses, and corresponding pBMAL1(S42) levels are relatively low. Thereby, more BMAL1 is available in synapses to associate with CaMKIIα in response to stimulation (e.g., TBS), resulting in greater LTP. Because LTP activates pBMAL1(S42) and relocates BMAL1 away from synapses, we propose that continued activity suppresses the amount of CaMKIIα activation. At the start of the active period (CT12), in contrast, the fraction of BMAL1 phosphorylated is much higher, and therefore, less BMAL1 is available in synapses to promote CaMKIIα autophosphorylation. As a result, stimulation (e.g., TBS) results in less LTP. In Bmal1-S42A mutants, the loss of phosphorylated BMAL1 results in continuously high BMAL1 levels in synapses, mimicking a constitutive CaMKIIα state and the subsequent occlusion of circadian variation in LTP.

References

    1. T. Scammell, E. Arrigoni, J. Lipton, Neural circuitry of wakefulness and sleep. Neuron 93, 747–765 (2017). - PMC - PubMed
    1. B. A. Sulaman, S. Wang, J. Tyan, A. Eban-Rothschild, Neuro-orchestration of sleep and wakefulness. Nat. Neurosci. 26, 196–212 (2022). - PubMed
    1. C. Gizowski, C. Zaelzer, C. W. Bourque, Clock-driven vasopressin neurotransmission mediates anticipatory thirst prior to sleep. Nature 537, 685–688 (2016). - PubMed
    1. P. Valnegri, M. Khelfaoui, O. Dorseuil, S. Bassani, C. Lagneaux, A. Gianfelice, R. Benfante, J. Chelly, P. Billuart, C. Sala, M. Passafaro, A circadian clock in hippocampus is regulated by interaction between oligophrenin-1 and Rev-erbα. Nat. Neurosci. 14, 1293–1301 (2011). - PubMed
    1. J. C. Gonzalez, H. Lee, A. M. Vincent, A. L. Hill, L. K. Goode, G. D. King, K. L. Gamble, J. I. Wadiche, L. Overstreet-Wadiche, Circadian regulation of dentate gyrus excitability mediated by G-protein signaling. Cell Rep. 42, 112039 (2023). - PMC - PubMed

MeSH terms

Substances