. 2024 Jan 18;143(3):272-278.
doi: 10.1182/blood.2023020895.

The bone marrow is the primary site of thrombopoiesis

Affiliations

The bone marrow is the primary site of thrombopoiesis

Nathan L Asquith et al. Blood. .

Abstract

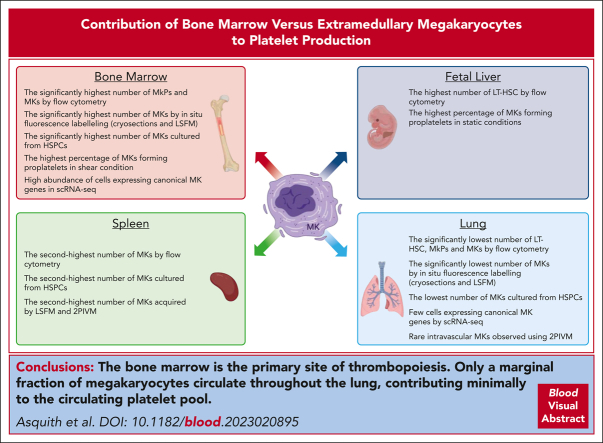
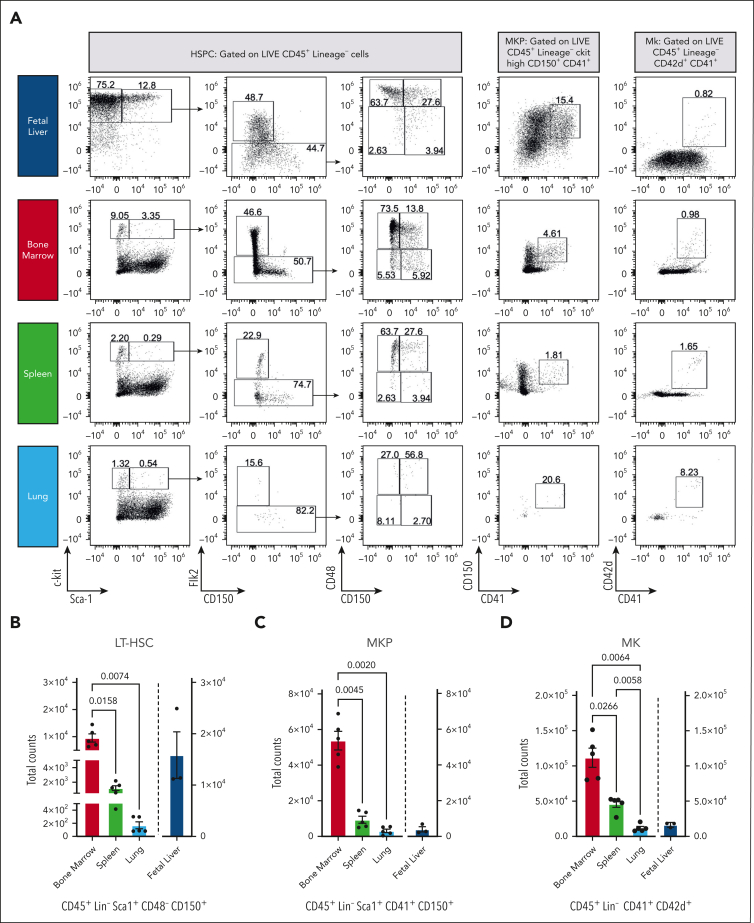
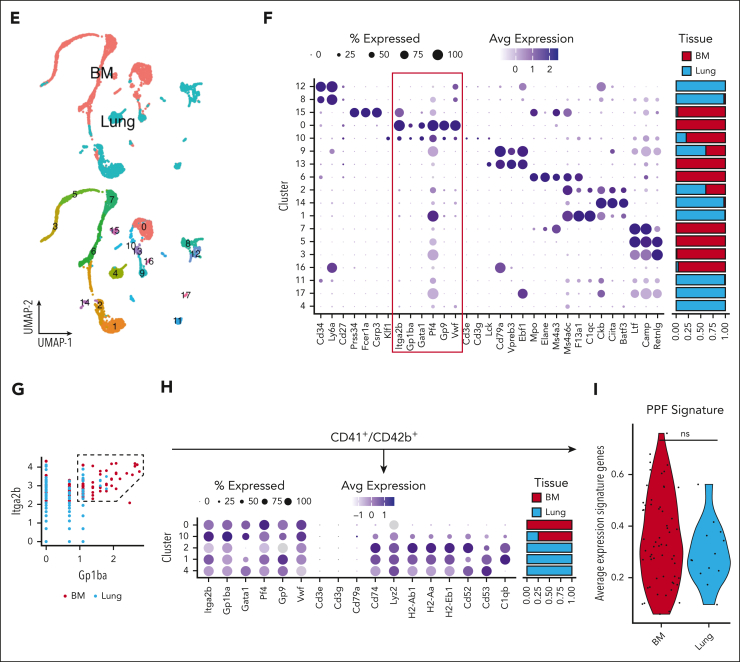
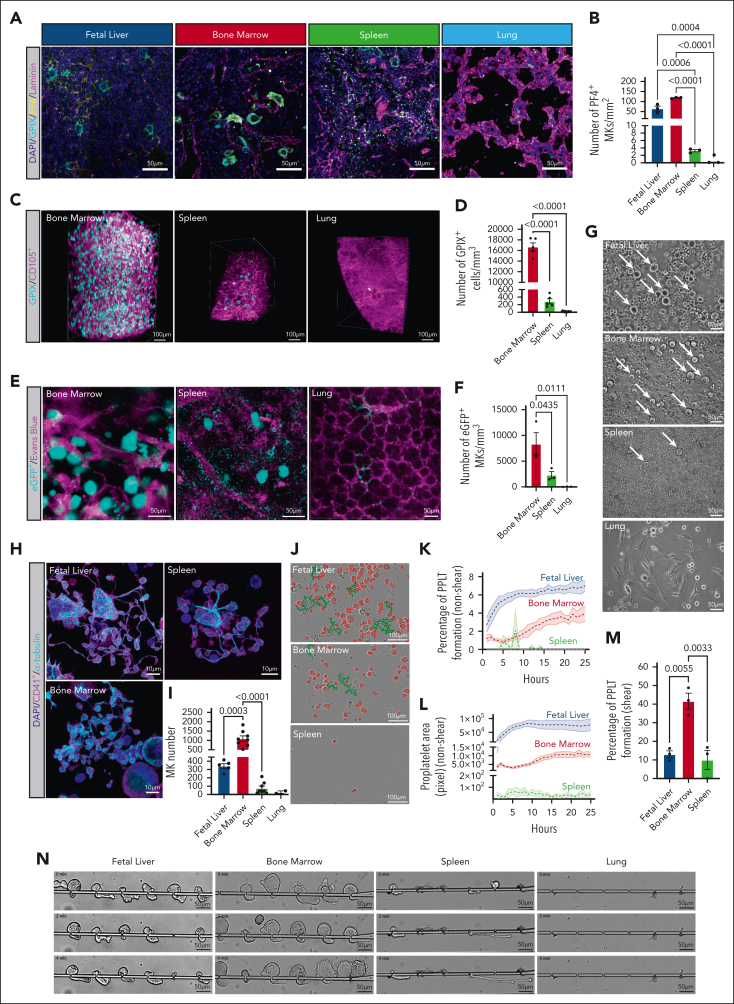
Megakaryocytes (MKs) generate thousands of platelets over their lifespan. The roles of platelets in infection and inflammation has guided an interest to the study of extramedullary thrombopoiesis and therefore MKs have been increasingly reported within the spleen and lung. However, the relative abundance of MKs in these organs compared to the bone marrow and the scale of their contribution to the platelet pool in a steady state remain controversial. We investigated the relative abundance of MKs in the adult murine bone marrow, spleen, and lung using whole-mount light-sheet and quantitative histological imaging, flow cytometry, intravital imaging, and an assessment of single-cell RNA sequencing (scRNA-seq) repositories. Flow cytometry revealed significantly higher numbers of hematopoietic stem and progenitor cells and MKs in the murine bone marrow than in spleens or perfused lungs. Two-photon intravital and light-sheet microscopy, as well as quantitative histological imaging, confirmed these findings. Moreover, ex vivo cultured MKs from the bone marrow subjected to static or microfluidic platelet production assays had a higher capacity for proplatelet formation than MKs from other organs. Analysis of previously published murine and human scRNA-seq data sets revealed that only a marginal fraction of MK-like cells can be found within the lung and most likely only marginally contribute to platelet production in the steady state.


Conflict of interest statement

Conflict-of-interest disclosure: J.E.I. has financial interest in and is a founder of StellularBio, a biotechnology company focused on making donor-independent platelet-like cells at scale; these interests are managed by Boston Children’s Hospital. The remaining authors declare no competing financial interests.

Figures

None
Graphical abstract
Figure 1.
Figure 1.
Ex vivo profiling of MKs by flow cytometry and scRNA-seq demonstrates that the bone marrow is the leading site of megakaryopoiesis in mice. (A) Representative dot plots of HSPCs, MKPs, and MKs. (B) Absolute LT-HSC cell counts across tissues. (C) Absolute counts of MKPs across tissues. (D) Absolute counts of MKs across tissues. Blue, fetal liver; red, bone marrow; green, spleen; and light blue, lung. Bone marrow, spleen, and lung (n = 5 animals) and fetal liver (n = 3 animals). Data are shown as mean ± standard error of the mean. Statistics were performed with 1-way analysis of variance with Tukey multiple comparisons test at 95% confidence interval (CI). (E) Uniform manifold approximation and projection (UMAP) projection of scRNA-seq data sets of murine lung and bone marrow CD41+ cells (Yeung et al6). Plots are colored based on the sampling tissue (top) or cluster identity (bottom). (F) Bubble plot showing expression of common murine hematopoiesis markers across clusters. The red box highlights canonical MK markers. (G) Scatterplot showing gating strategy used to select CD41+CD42+ cells based on RNA expression. (H) Bubble plot showing MK and immune-related markers expression on CD41+CD42+ cells across clusters. (I) Average expression of genes from a proplatelet formation (PPF) signature on CD41+CD42+ cells.
Figure 1.
Figure 1.
Ex vivo profiling of MKs by flow cytometry and scRNA-seq demonstrates that the bone marrow is the leading site of megakaryopoiesis in mice. (A) Representative dot plots of HSPCs, MKPs, and MKs. (B) Absolute LT-HSC cell counts across tissues. (C) Absolute counts of MKPs across tissues. (D) Absolute counts of MKs across tissues. Blue, fetal liver; red, bone marrow; green, spleen; and light blue, lung. Bone marrow, spleen, and lung (n = 5 animals) and fetal liver (n = 3 animals). Data are shown as mean ± standard error of the mean. Statistics were performed with 1-way analysis of variance with Tukey multiple comparisons test at 95% confidence interval (CI). (E) Uniform manifold approximation and projection (UMAP) projection of scRNA-seq data sets of murine lung and bone marrow CD41+ cells (Yeung et al6). Plots are colored based on the sampling tissue (top) or cluster identity (bottom). (F) Bubble plot showing expression of common murine hematopoiesis markers across clusters. The red box highlights canonical MK markers. (G) Scatterplot showing gating strategy used to select CD41+CD42+ cells based on RNA expression. (H) Bubble plot showing MK and immune-related markers expression on CD41+CD42+ cells across clusters. (I) Average expression of genes from a proplatelet formation (PPF) signature on CD41+CD42+ cells.
Figure 2.
Figure 2.
In situ fluorescence labeling, light sheet fluoresence microscopy (LSFM), 2-photon intravital microscopy (2PIVM), and ex vivo proplatelet assays demonstrate that the bone marrow is the primary site of megakaryopoiesis in adult mice. (A) Micrographs of cryosections obtained from mouse fetal liver, bone marrow, spleen, and lung, respectively. Blue, 4′,6-diamidino-2-phenylindole (DAPI); cyan, glycoprotein IX (GPIX); yellow, platelet factor 4 (PF4); and magenta, laminin. Scale bars represent 50 μm. (B) Quantitative analysis of MK count within whole organ cryosections (PF4) MK/mm2; blue, fetal liver; red, bone marrow; green, spleen; and light blue, lung. (C) Reconstruction of LSFM data of femoral bone marrow, spleen, and lung tissues. MKs are depicted in cyan (anti-GPIX) and vessels in magenta (anti-CD105); scale bars represent 100 μm. (D) Quantification of MK (GPIX+ > 16 μm) numbers per mm³ in the adult mouse bone marrow, spleen, and lung; bar graphs represent mean ± standard deviation. Red, bone marrow; green, spleen; and light blue, lung. (E) Representative images of 2PIVM data of adult mouse bone marrow, spleen, and lung tissues. MKs (eGFP+ > 16 μm) are depicted in cyan and vessels in magenta (Evans blue; scale bars represent 50 μm). (F) Quantification of 2PIVM data shows an average number of MKs per mouse. Red, bone marrow; green, spleen; and light blue, lung. (G) Representative brightfield images of day 4 mouse fetal liver, bone marrow, spleen, and lung cultures pregradient. White arrows indicate MKs. Scale bars represent 50 μm. (H) Representative micrographs of proplatelet-forming MKs differentiated ex vivo from mouse fetal liver, bone marrow, and spleen progenitors. Blue, DAPI; magenta, CD41+; cyan, α-tubulin. Scale bars represent 10 μm. (I) Quantitative analysis of MK counts on day 4 MKs differentiated ex vivo; blue, fetal liver; red, bone marrow; green, spleen; and light blue, lung. (J) Representative phase contrast images of proplatelet-forming MKs from multiple tissues at 24 hours time points. Red, MKs; green, proplatelet extensions. Scale bars represent 100 μm. (K) Quantitative analysis of the percentage of MKs forming proplatelets; blue, fetal liver; red, bone marrow; and green, spleen. (L) Total proplatelet area of MKs forming proplatelets; blue, fetal liver; red, bone marrow; and green, spleen. (M) Percentage of MKs forming proplatelets in shear conditions. Blue, fetal liver; red, bone marrow; and green, spleen. (N) Representative panels of shear-driven proplatelet formation and extension in a microfluidic device over time for ex vivo differentiated MKs from multiple tissues. The time scale is T = 0 minute → 4 minutes. Scale bars represent 50 μm. Unless otherwise stated, all data sets are shown as mean ± standard error of the mean; graphs represent data from a minimum of 3 independent mice. Statistics were performed with 1-way analysis of variance with Tukey multiple comparisons test at 95% CI.

Comment in

References

    1. Lucotti S, Muschel RJ. Platelets and metastasis: new implications of an old interplay. Front Oncol. 2020;10:1350. - PMC - PubMed
    1. Portier I, Campbell RA. Role of platelets in detection and regulation of infection. Arterioscler Thromb Vasc Biol. 2021;41(1):70–78. - PMC - PubMed
    1. Semple JW, Italiano JE, Freedman J. Platelets and the immune continuum. Nat Rev Immunol. 2011;11(4):264–274. - PubMed
    1. Lefrançais E, Ortiz-Muñoz G, Caudrillier A, et al. The lung is a site of platelet biogenesis and a reservoir for haematopoietic progenitors. Nature. 2017;544(7648):105–109. - PMC - PubMed
    1. Kaufman RM, Airo R, Pollack S, Crosby WH. Circulating megakaryocytes and platelet release in the lung. Blood. 1965;26(6):720–731. - PubMed

Publication types