. 2024 Jan 18;143(3):258-271.
doi: 10.1182/blood.2022018905.

CD19 occupancy with tafasitamab increases therapeutic index of CART19 cell therapy and diminishes severity of CRS

Affiliations

CD19 occupancy with tafasitamab increases therapeutic index of CART19 cell therapy and diminishes severity of CRS

R Leo Sakemura et al. Blood. .

Erratum in

Abstract

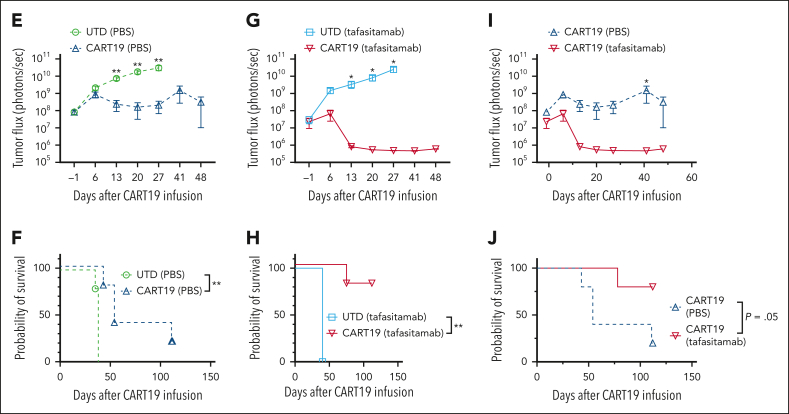
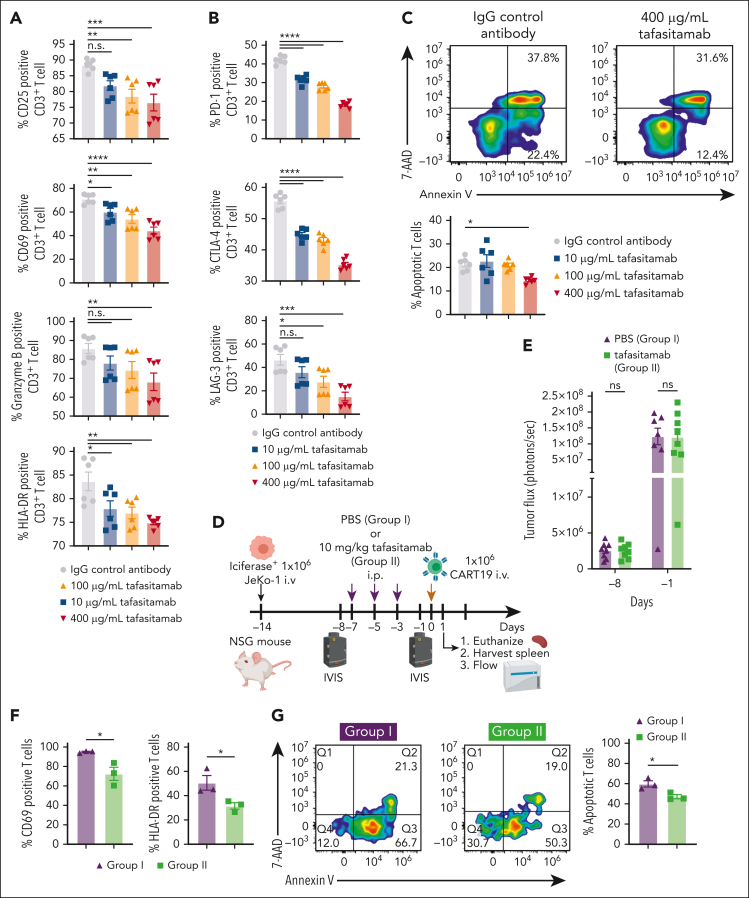
In the development of various strategies of anti-CD19 immunotherapy for the treatment of B-cell malignancies, it remains unclear whether CD19 monoclonal antibody therapy impairs subsequent CD19-targeted chimeric antigen receptor T-cell (CART19) therapy. We evaluated the potential interference between the CD19-targeting monoclonal antibody tafasitamab and CART19 treatment in preclinical models. Concomitant treatment with tafasitamab and CART19 showed major CD19 binding competition, which led to CART19 functional impairment. However, when CD19+ cell lines were pretreated with tafasitamab overnight and the unbound antibody was subsequently removed from the culture, CART19 function was not affected. In preclinical in vivo models, tafasitamab pretreatment demonstrated reduced incidence and severity of cytokine release syndrome and exhibited superior antitumor effects and overall survival compared with CART19 alone. This was associated with transient CD19 occupancy with tafasitamab, which in turn resulted in the inhibition of CART19 overactivation, leading to diminished CAR T apoptosis and pyroptosis of tumor cells.


Conflict of interest statement

Conflict-of-interest disclosure: S.S.K. is an inventor of patents in the field of chimeric antigen receptor (CAR) immunotherapy that are licensed to Novartis (through an agreement between Mayo Clinic, University of Pennsylvania, and Novartis). R.L.S., and S.S.K. are inventors of patents in the field of CAR immunotherapy that are licensed to Humanigen (through the Mayo Clinic). M.H. and S.S.K. are inventors of patents in the field of CAR immunotherapy that are licensed to Mettaforge (through the Mayo Clinic). S.S.K. receives research funding from Kite, Gilead, Juno, Bristol Myers Squibb (BMS), Novartis, Humanigen, MorphoSys, Tolero, and Lentigen. N.E.K. receives research funding from Acerta Pharma, BMS, Pharmacyclics, MEI Pharma, and Sunesis. N.E.K. has participated in the advisory board meetings of Cytomx Therapy, Janssen, Juno Therapeutics, AstraZeneca, and Oncotracker; and on DSMC for Agios and Cytomx Therapeutics. S.A.P. receives research funding from Pharmacyclics, MorphoSys, Janssen, AstraZeneca, TG Therapeutics, BMS, AbbVie, and Ascentage Pharma. S.A.P. participated in the advisory board meetings of Pharmacyclics, AstraZeneca, Genentech, Gilead, GlaxoSmithKline, Verastem Oncology, and AbbVie (he was not personally compensated for his participation). The remaining authors declare no competing financial interests.

Figures

None
Graphical abstract
Figure 1.
Figure 1.
Binding competition of tafasitamab and CART19 to the B-cell surface marker CD19. (A) Detection of FMC63 using anti-His-PE (left) and tafasitamab using anti-Fcγ PE (right). First, Nalm6 was incubated with either FMC63-based His-tagged Fab (3.3 μg/mL = 66 nM), tafasitamab (10 μg/mL = 66.67 nM), or no antibody as a negative control. Second, either FMC63-based anti-CD19 Fab, tafasitamab, or no antibody was added and further incubation was performed. Third, a washing step, incubation with PE-labeled detection antibodies binding to FMC63-Fab (anti-His) or tafasitamab (anti-IgG, Fcγ-specific), another washing step, and flow cytometric analysis were performed (mean ± standard deviation [SD], ∗∗∗∗P < .0001, 1-way analysis of variance [ANOVA]; 2 independent experiments, 3 replicates). (B) Cytotoxicity assay of CART19 against CD19+ luciferase+ JeKo-1 in the presence of increasing doses of tafasitamab (10-400 μg/mL). Isotype IgG antibody was used as a control. At 24 hours, cytotoxicity was assessed by luminescence relative to controls (mean ± standard error of the mean [SEM], ∗P < .05, ∗∗P = .01, ∗∗∗P < .001, ∗∗∗∗P < .0001, 2-way ANOVA; n = 3, 2 replicates). (C) CART19 cell antigen-specific proliferation assay in the presence of increasing doses of tafasitamab (10-400 μg/mL). Isotype IgG antibody was used as a control. Lethally irradiated JeKo-1 were used for antigen stimulation. On day 5 of coculture, the absolute number of CD3+ T cells were quantified using volumetric flow cytometry (mean ± SEM, ∗∗P < .01, 1-way ANOVA; n = 3, 2 replicates). (D) CART19 cell antigen-specific CD107a degranulation assay in the presence of increasing doses of tafasitamab (10-400 μg/mL). Isotype IgG antibody was used as a control (mean ± SEM, ∗∗∗∗P < .0001, 2-way ANOVA; n = 3, 2 replicates). n.s., not significant; UTD, untransduced T cells.
Figure 2.
Figure 2.
Pretreating tumor cells with tafasitamab does not affect the antitumor activity of CART19. (A) Cytotoxicity assay of CART19 with tafasitamab-pretreated CD19+ cell line JeKo-1. JeKo-1 were treated with either the isotype IgG control or increasing doses of tafasitamab (10-400 μg/mL) overnight. The next day, tafasitamab was removed from the JeKo-1 by centrifugation. CART19 were cocultured at different effector-to-target ratios (E:T) with tafasitamab-pretreated luciferase+ JeKo-1. At 24 hours, cell death was assessed by luminescence, relative to that of the control. CART19 were able to induce cell death in all CD19+ cell lines, regardless of tafasitamab treatment (mean ± SEM, 2-way ANOVA; n = 3, 2 replicates). (B) CART19 cell antigen-specific proliferation assay after stimulation with tafasitamab-pretreated JeKo-1. The CD19+ cell line JeKo-1 was treated with different doses of tafasitamab (10-400 μg/mL) or an isotype IgG control overnight. Before coculture, tafasitamab or the isotype control was removed from JeKo-1 by centrifugation. On day 5 of culture, the absolute number of CD3+ T cells was quantified by volumetric flow cytometry (1-way ANOVA; n = 3, 2 replicates). (C) CART19 CD107a degranulation and intracellular cytokine assays after stimulation with tafasitamab-pretreated JeKo-1. CD19+ cell line JeKo-1 was treated with different doses of tafasitamab (10-400 μg/mL) or isotype IgG control overnight. Before coculture, tafasitamab or isotype control was removed from JeKo-1 by simple centrifugation. The levels of CD107a and intracellular cytokines were assessed by flow cytometry. The negative gate was determined based on the fluorescence minus one (FMO) control (mean ± SEM, 1-way ANOVA; n = 3, 2 replicates).
Figure 3.
Figure 3.
Pretreating mice with tafasitamab does not affect CART19 cell therapy. (A-B) The schemes of “two-step” JeKo-1 xenograft mouse model. (A) Immunocompromised NSG mice were inoculated with 1 × 106 of luciferase+JeKo-1 via IV injection. On day −1, the mice were imaged and randomized based on the tumor burden to receive either 10 mg/kg per day of tafasitamab or PBS. Treatment was performed three times per week until the end point. The mice were euthanized when they reached the end point, and their spleens were harvested and cryopreserved. (B) NSG mice were inoculated with 1 × 106 splenocytes (IV) obtained from panel A. On day −1, the mice were imaged and randomized based on the tumor burden to receive UTD or CART19. (C-D) BLI of mice engrafted with splenocytes derived from PBS (C) or tafasitamab (D) pretreated xenograft mice. (E) BLI curve for PBS-pretreated JeKo-1 xenograft model (mean ± SEM, ∗∗P < .01 at days 13, 20, and 27, t test); n = 5 in each group. (F) Kaplan-Meier curve for the PBS-pretreated JeKo-1 xenograft model (∗∗P < .01, log-rank test; hazard ratio (HR), 7.0; 95% confidence interval [CI], 1.381-35.48). (G) BLI curve for tafasitamab-pretreated xenograft mice (mean ± SEM, ∗P < .01 at days 13, 20, and 27, t test); n = 5 in each group. (H) Kaplan-Meier curve for the tafasitamab-pretreated JeKo-1 xenograft model. Mice treated with CART19 showed significantly better survival than those in the UTD group (∗∗P < .01, log-rank test; HR, 3.689; 95% CI, 0.8209-16.58). (I) BLI curves comparing CART19-administered mice engrafted with splenocytes derived from PBS- or tafasitamab-pretreated xenograft mice (mean ± SEM, ∗P < .05 at day 41, t test). (J) Kaplan-Meier curves comparing CART19-administered mice engrafted with splenocytes derived from PBS- or tafasitamab-pretreated xenograft mice (P = .05, log-rank test; HR, 5.96; 95% CI, 0.9971-35.63).
Figure 3.
Figure 3.
Pretreating mice with tafasitamab does not affect CART19 cell therapy. (A-B) The schemes of “two-step” JeKo-1 xenograft mouse model. (A) Immunocompromised NSG mice were inoculated with 1 × 106 of luciferase+JeKo-1 via IV injection. On day −1, the mice were imaged and randomized based on the tumor burden to receive either 10 mg/kg per day of tafasitamab or PBS. Treatment was performed three times per week until the end point. The mice were euthanized when they reached the end point, and their spleens were harvested and cryopreserved. (B) NSG mice were inoculated with 1 × 106 splenocytes (IV) obtained from panel A. On day −1, the mice were imaged and randomized based on the tumor burden to receive UTD or CART19. (C-D) BLI of mice engrafted with splenocytes derived from PBS (C) or tafasitamab (D) pretreated xenograft mice. (E) BLI curve for PBS-pretreated JeKo-1 xenograft model (mean ± SEM, ∗∗P < .01 at days 13, 20, and 27, t test); n = 5 in each group. (F) Kaplan-Meier curve for the PBS-pretreated JeKo-1 xenograft model (∗∗P < .01, log-rank test; hazard ratio (HR), 7.0; 95% confidence interval [CI], 1.381-35.48). (G) BLI curve for tafasitamab-pretreated xenograft mice (mean ± SEM, ∗P < .01 at days 13, 20, and 27, t test); n = 5 in each group. (H) Kaplan-Meier curve for the tafasitamab-pretreated JeKo-1 xenograft model. Mice treated with CART19 showed significantly better survival than those in the UTD group (∗∗P < .01, log-rank test; HR, 3.689; 95% CI, 0.8209-16.58). (I) BLI curves comparing CART19-administered mice engrafted with splenocytes derived from PBS- or tafasitamab-pretreated xenograft mice (mean ± SEM, ∗P < .05 at day 41, t test). (J) Kaplan-Meier curves comparing CART19-administered mice engrafted with splenocytes derived from PBS- or tafasitamab-pretreated xenograft mice (P = .05, log-rank test; HR, 5.96; 95% CI, 0.9971-35.63).
Figure 4.
Figure 4.
CART19 in tafasitamab-pretreated mice shows a better antitumor response. (A) Treatment schema. NSG mice were inoculated with luciferase+ JeKo-1 on day −14, and tumor burden was analyzed using BLI on day −6. Mice were randomized according to their tumor burden to receive 10 mg/kg per day tafasitamab (IP, 10 mice) or PBS vehicle control (IP, 5 mice, group 1). Tumor burden was reassessed by BLI on day −1, and tafasitamab-treated mice were randomized to tafasitamab discontinuous (5 mice, group 2) or continuous (5 mice, group 3) groups. (B-C) BLI analysis. Group 2, mice pretreated with tafasitamab before CART19 cell injection, demonstrated better tumor control than those in groups 1 or 3 (∗P < .05, 2-way ANOVA). (D) CART19 cell expansion in vivo. Peripheral blood (PB) was collected on days 11 and 23 after the CART19 infusion to analyze the expansion of CART19. Group 2 showed late-onset CART19 expansion (∗∗P < .01, 2-way ANOVA). (E) Overall survival curve. Group 2 showed superior overall survival compared with groups 1 or 3 (∗P < .05, ∗∗P < .01, log-rank test, group 2 vs group 3; HR, 0.166; 95% CI, 0.04991-0.5515, group 2 vs 1 HR, 0.294; 95% CI, 0.08938-0.9671). (F) Pharmacokinetic analysis. Serial PB sampling was performed 17, 22, 28, 32, and 47 days after the first tafasitamab administration. The serum levels of tafasitamab were measured using an electrochemiluminescence (ECLA) assay.
Figure 5.
Figure 5.
Pretreating JeKo-1 xenograft mice with tafasitamab reduces early activation and apoptosis of CART19. (A) CD19+ JeKo-1 were cocultured with CART19 in the presence of different concentrations of tafasitamab (10-400 μg/mL) or IgG isotype for 24 hours, and CD25, CD69, granzyme B, and HLA-DR were assessed by flow cytometry (mean ± SEM, ∗P < .05, ∗∗P < .01, ∗∗∗P < .001, ∗∗∗∗P < .0001, 1-way ANOVA; n = 3, 2 replicates). (B) JeKo-1 were cocultured with CART19 in the presence of different concentrations of tafasitamab (10-400 μg/mL) or isotype IgG control for 24 hours. The expression of PD-1, CTLA-4, and LAG-3 in CD3+ T cells was analyzed by flow cytometry (mean ± SEM, ∗P < .05, ∗∗∗P < .001, ∗∗∗∗P < .0001, 1-way ANOVA; n = 3, 2 replicates). (C) JeKo-1 were cocultured with CART19 in the presence of different concentrations of tafasitamab (10-400 μg/mL) or IgG isotype control for 1 hour. Apoptotic T cells were analyzed by flow cytometry. Apoptotic T cells were defined as CD3+ annexin V+ 7-AAD. (∗P < .05, 1-way ANOVA; n = 3, 2 replicates). (D-E) Experimental schema and BLI analysis. NSG mice were inoculated with luciferase+ JeKo-1 on day −14, and tumor burden was assessed using BLI on day −6. Mice were randomized according to their tumor burden to receive PBS vehicle control (IP, 7 mice, group 1) or 10 mg/kg per day of tafasitamab (IP, 8 mice, group 2). On day 0, all mice received 1.0 × 106 CART19; 24 hours after CART19 cell infusion, 3 mice from each group were euthanized, and the spleens were harvested. There were no significant differences in tumor burden on days −8 or −1 in either group (mean ± SEM, t test). (F) Flow cytometric analysis of CD69 and HLA-DR in human CD3+ T cells in splenocytes. Human CD3+ T cells were determined using murine CD45, human CD45+, and human CD3+ (mean ± SEM, ∗P < .05, t test; n = 3 per group). (G) Flow cytometric analysis of apoptotic CD3+ T cells in the splenocytes. Apoptotic T cells were defined as CD3+ annexin V+ 7-AAD (mean ± SEM, ∗P < .05, t test; n = 3 per group).
Figure 6.
Figure 6.
Sequential therapy with tafasitamab and CART19 cell decreased the severity of CRS and increased the antitumor effect of CART19. (A) Experimental scheme. NSG mice were first treated with 30 mg/kg of busulfan via IP injection. After 24 hours, the mice were injected with 5 × 106 of leukemic blasts derived from patients with R/R ALL. The mice were then monitored for tumor burden via PB sampling. Once human CD45+ cells within mouse blood reached >10 cells per μL, the mice were randomized according to the burden of human CD45+ cells to receive (1) IgG control or (2) 5 mg tafasitamab on day −7. Tafasitamab and IgG controls were administered via IP injection. On day 0, IgG control and tafasitamab groups received 3.5 × 106 of luciferase+ CART19. The expansion of CART19 was monitored via serial BLI, and CRS was monitored through the weight and well-being of the mice. (B) Mice were bled before CART19 cell infusion, and the tumor burden was reassessed. The leukemic blasts were determined by human CD45+, mouse CD45, and human CD20+ cells (∗P < .05, t test: n = 3-6 per group). (C) CD19 expression in leukemic blasts was assessed using flow cytometry. CD19 absolute counts were determined using Quantum Simply Cellular kits (∗P < .05, t test: n = 3-5 per group). (D) The percentage reduction in the weights from baseline is shown. The first and second asterisks or “n.s.” are showing the statistical comparisons between IgG control vs 5 mg/kg tafasitamab at day −7 or IgG control vs untreated xenografts, respectively ∗∗P < .01, ∗∗∗∗P < .0001, 2-way ANOVA). (E) Analysis of CART19 cell expansion in vivo. IgG control and tafasitamab groups were imaged with bioluminescence on days 1 and 2 (∗P < .05, ∗∗P < .01, t test). (F) On day 4 of CART19 treatment, mice were bled and cytokines were analyzed with multiplex (∗∗∗P < .001, ∗∗∗∗P < .0001, t test). (G) Kaplan-Meier curve is shown. IgG control vs 5 mg/kg tafasitamab at day −7 HR, 17.81; 95% CI, 3.805 to 83.40; ∗∗P = .0003 (log-rank test), 5 mg/kg tafasitamab vs untreated xenografts, 0.04569; 95% CI, 0.008027 to 0.2601; ∗∗∗P = .0005 (log-rank test), IgG control vs untreated xenografts HR, 13.64; 95% CI, 2.855 to 65.17, ∗∗P = .0011 (log-rank test). (H) The weights of spleens are shown. At the end of the experiments, the mice were euthanized and the spleens were harvested (∗P < .05, 1-way ANOVA). (I) The sizes of spleens are shown. Splenic cells were analyzed using flow cytometry. Leukemic blasts and CART19 were defined as human CD45+, mouse CD45, human CD20+, and human CD45+, mouse CD45, human CD3+, respectively.
Figure 7.
Figure 7.
Transient CD19 masking with tafasitamab decreases tumor cell pyroptosis. (A) In vitro high-mobility group box 1 (HMGB-1) assay. CART19, CD19+JeKo-1, and increasing doses of tafasitamab (10-400 μg/mL) or the isotype control were cultured for 24 hours. Cells were processed with the Lumit HMGB1 immunoassay kit (mean ± SEM, ∗P < .05, ∗∗∗P < .001, 1-way ANOVA; n = 2, 2 replicates). (B) Western blot of tumor cells on day 1. Satellite mice were euthanized and their spleens were harvested. Tumor cells were then isolated with CD20 micro beads from splenic cells. The expression of GSDME was determined using western blot (n = 3 per group).

Comment in

  • CD19 occupancy may drive CARs further.
    Hirayama AV, Bleakley M. Hirayama AV, et al. Blood. 2024 Jan 18;143(3):190-192. doi: 10.1182/blood.2023022783. Blood. 2024. PMID: 38236611 No abstract available.

References

    1. Nelson AL, Dhimolea E, Reichert JM. Development trends for human monoclonal antibody therapeutics. Nat Rev Drug Discov. 2010;9(10):767–774. - PubMed
    1. Li J, Zhu Z. Research and development of next generation of antibody-based therapeutics. Acta Pharmacol Sin. 2010;31(9):1198–1207. - PMC - PubMed
    1. Gross G, Waks T, Eshhar Z. Expression of immunoglobulin-T-cell receptor chimeric molecules as functional receptors with antibody-type specificity. Proc Natl Acad Sci U S A. 1989;86(24):10024–10028. - PMC - PubMed
    1. Gross G, Gorochov G, Waks T, Eshhar Z. Generation of effector T cells expressing chimeric T cell receptor with antibody type-specificity. Transplant Proc. 1989;21(1 pt 1):127–130. - PubMed
    1. Bouchkouj N, Kasamon YL, de Claro RA, et al. FDA approval summary: axicabtagene ciloleucel for relapsed or refractory large B-cell lymphoma. Clin Cancer Res. 2019;25(6):1702–1708. - PubMed

Publication types