. 2023 Dec;624(7990):207-214.
doi: 10.1038/s41586-023-06761-7. Epub 2023 Oct 25.

TMPRSS2 is a functional receptor for human coronavirus HKU1

Affiliations

TMPRSS2 is a functional receptor for human coronavirus HKU1

Nell Saunders et al. Nature. 2023 Dec.

Abstract

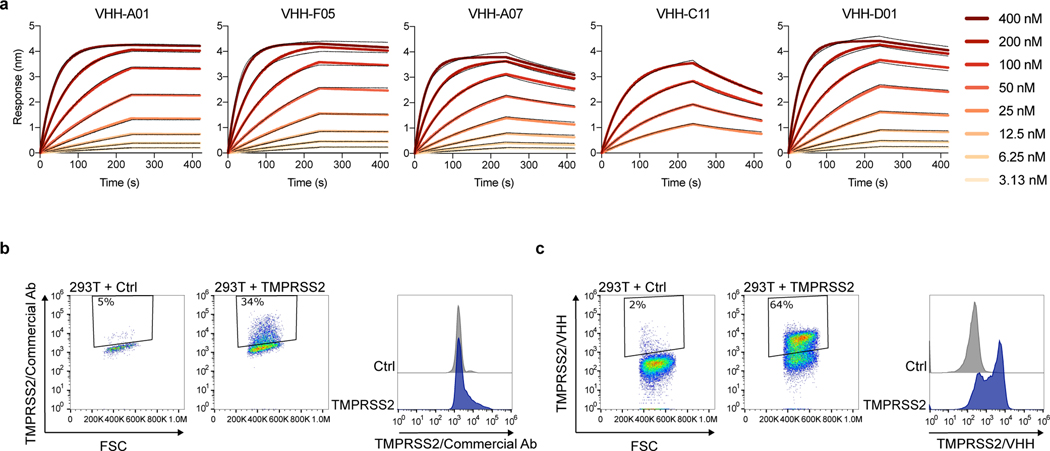
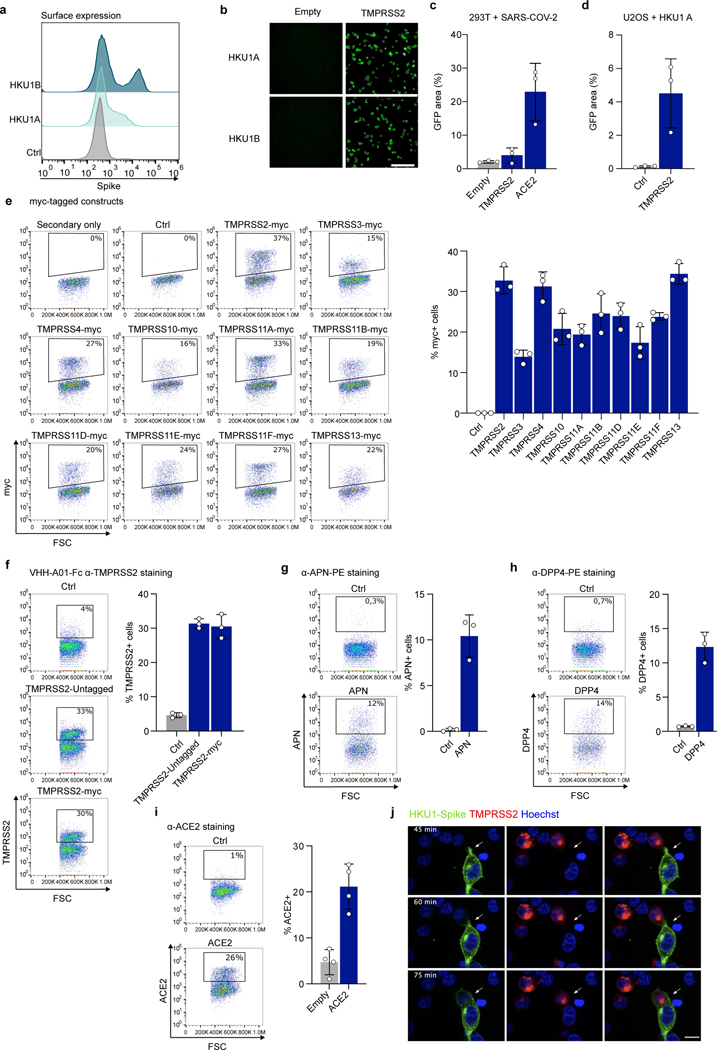
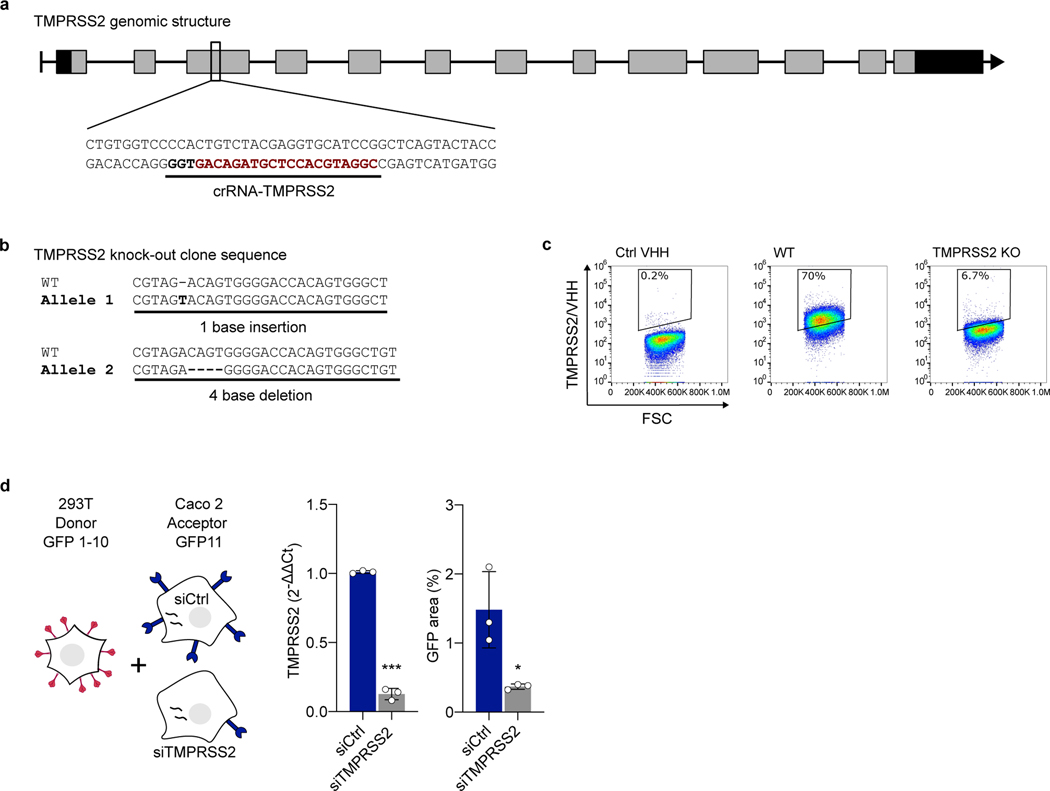
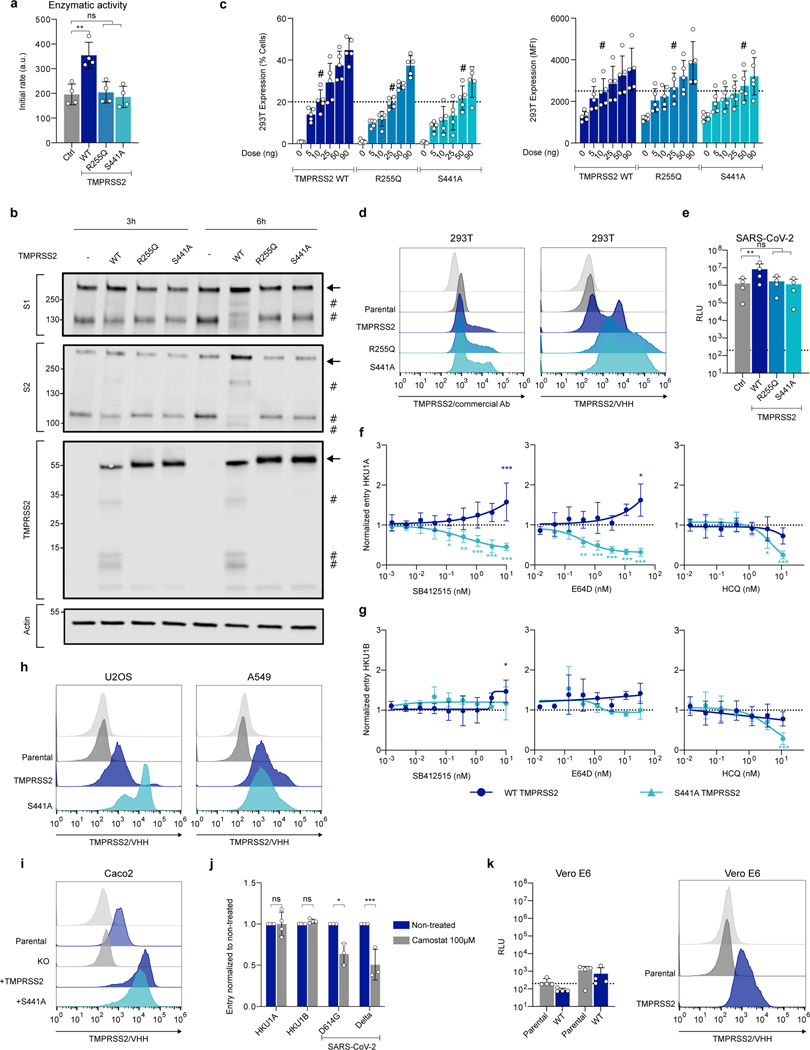
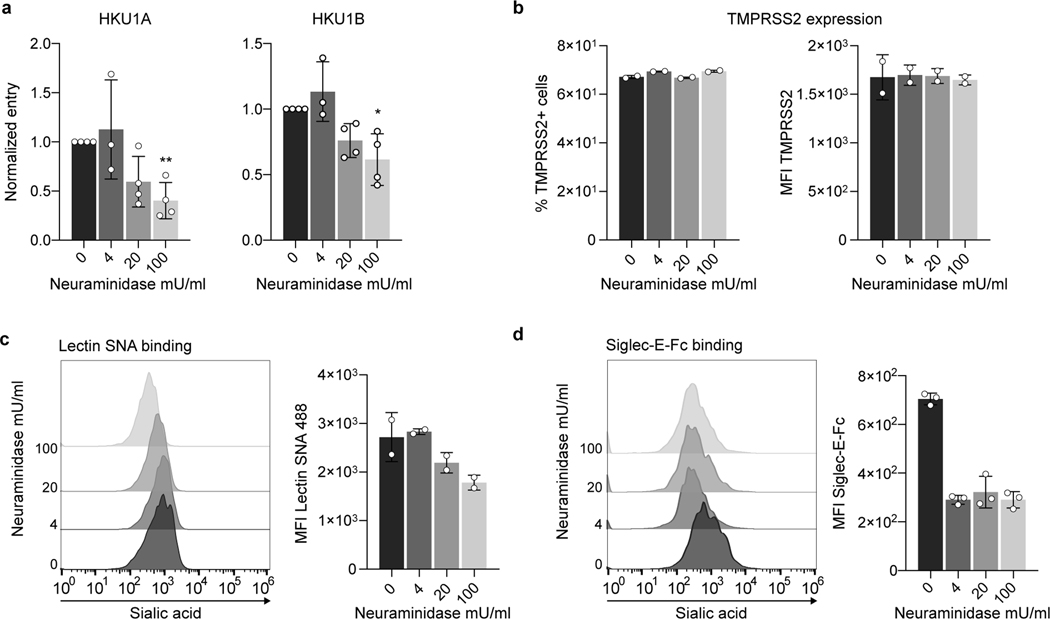
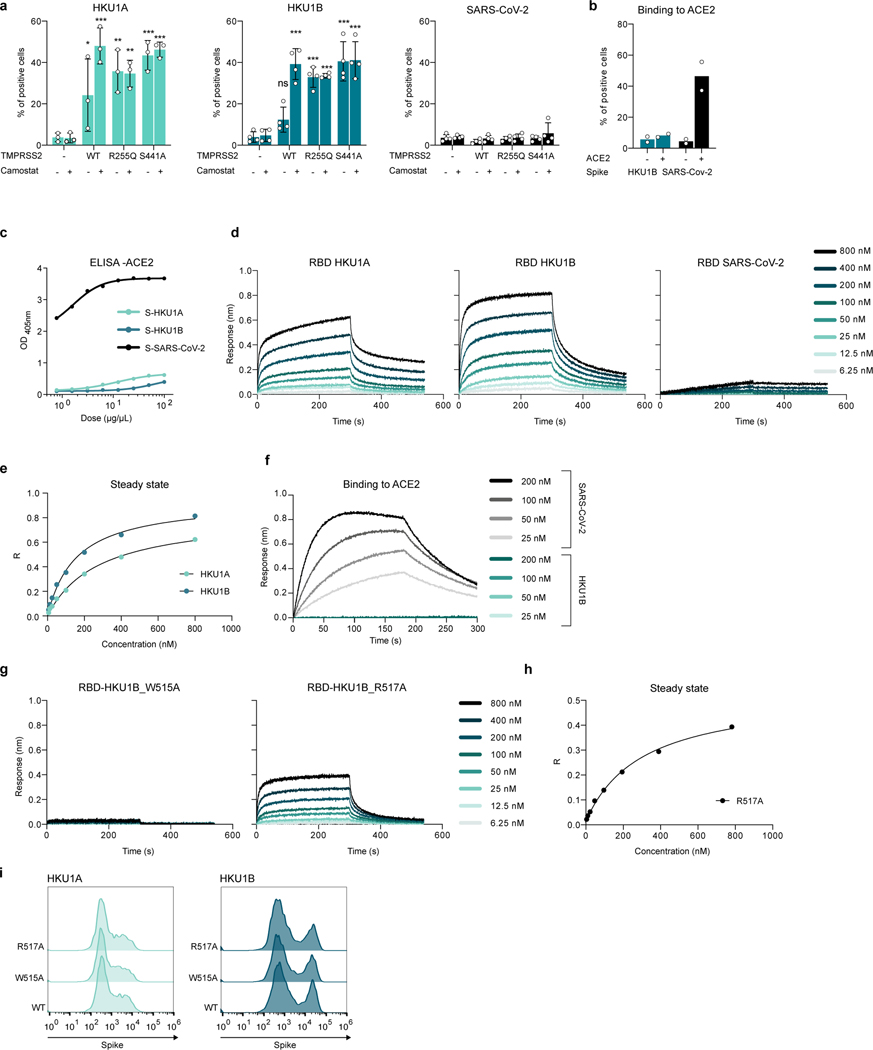
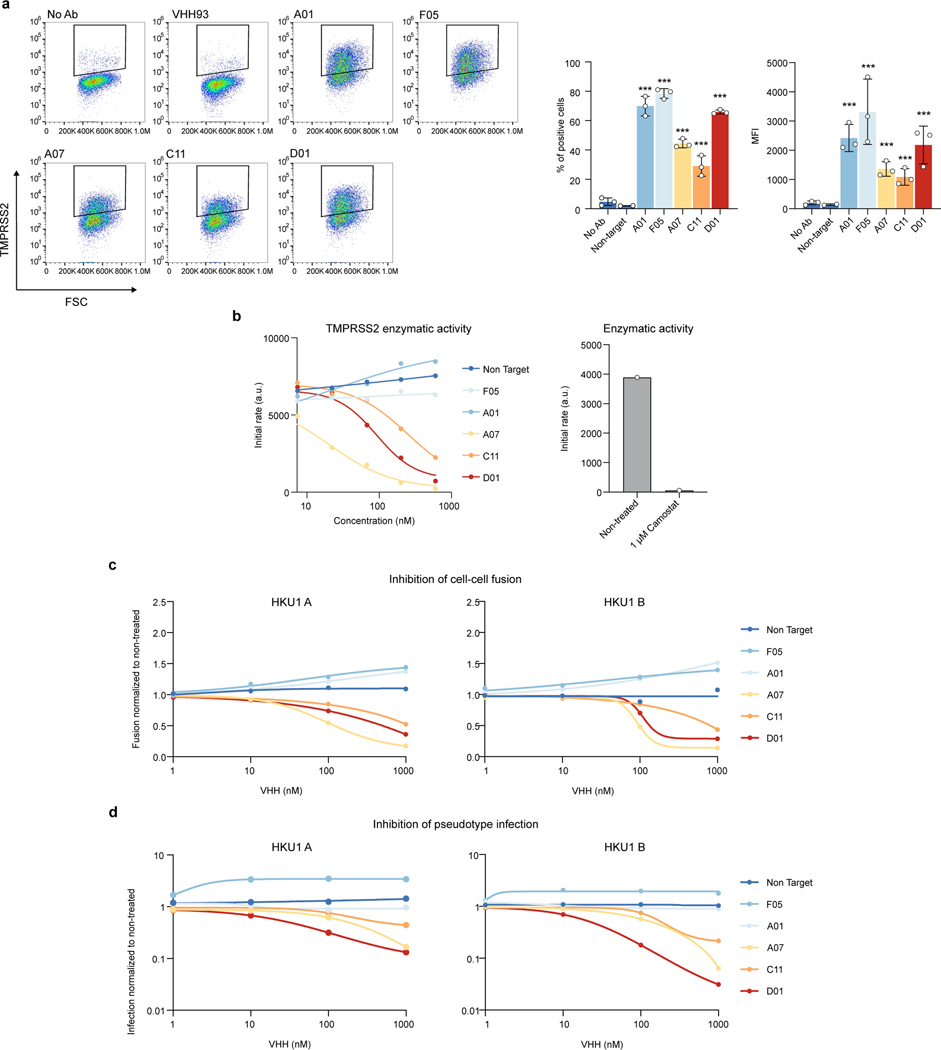
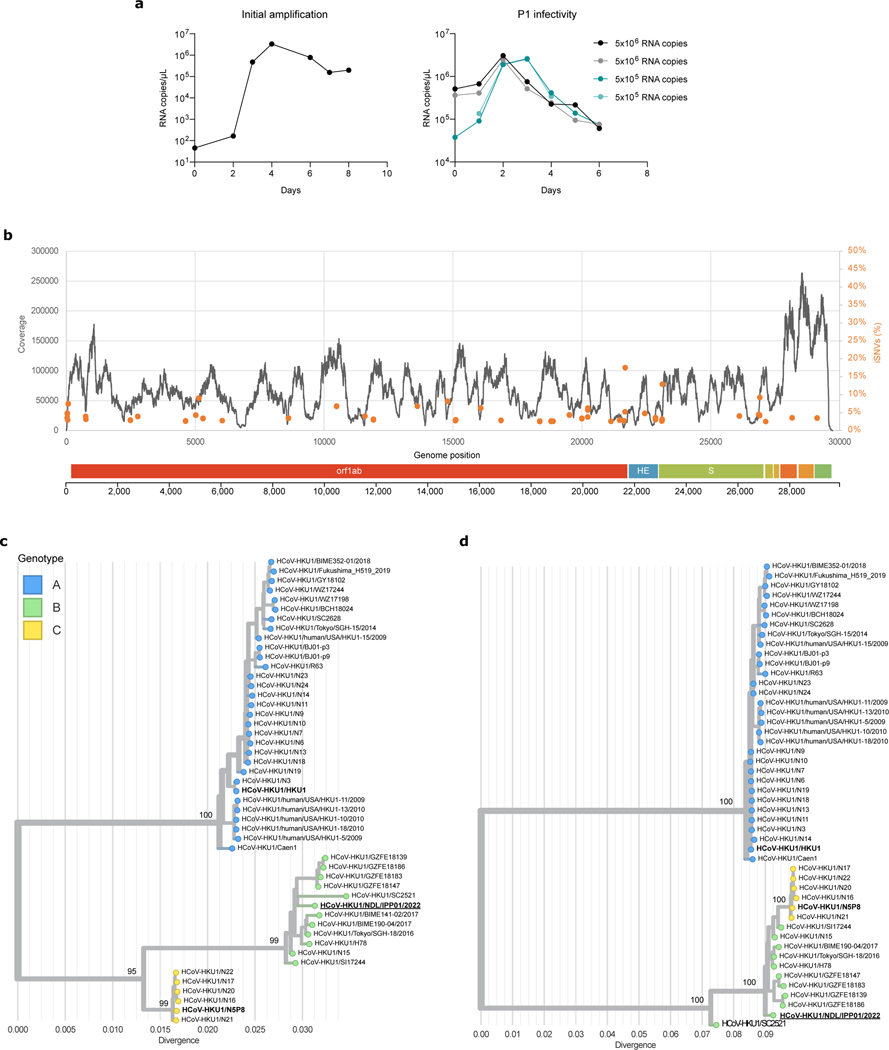
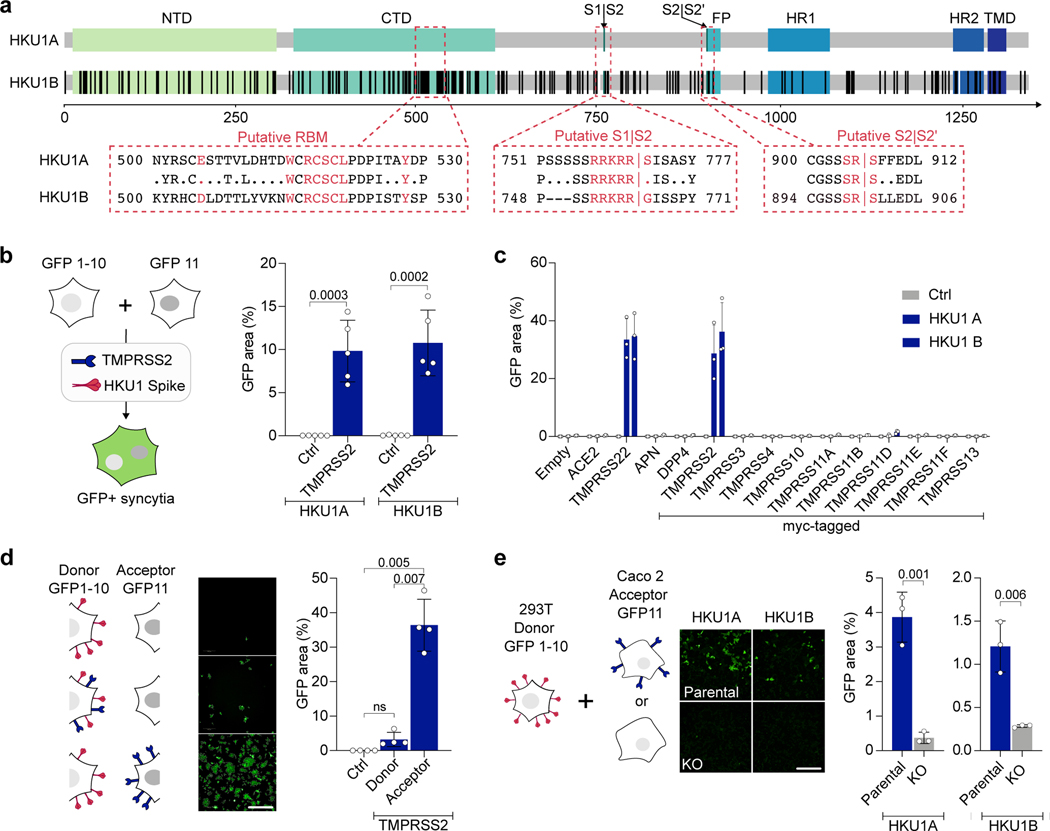
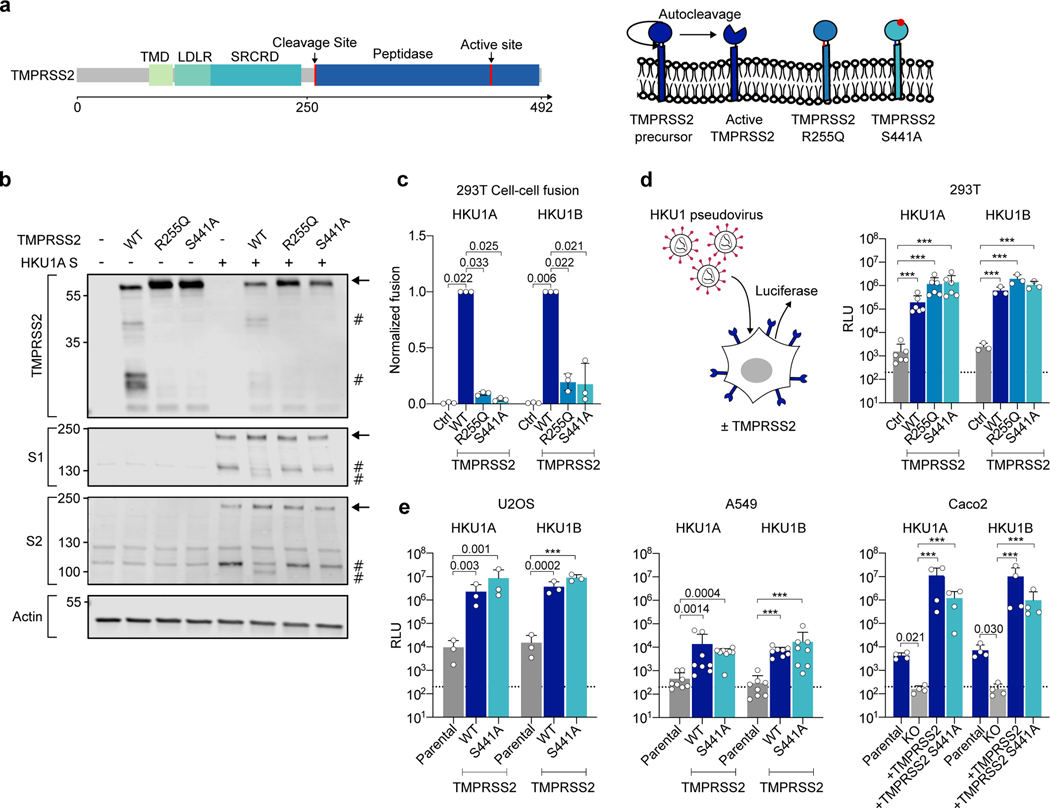
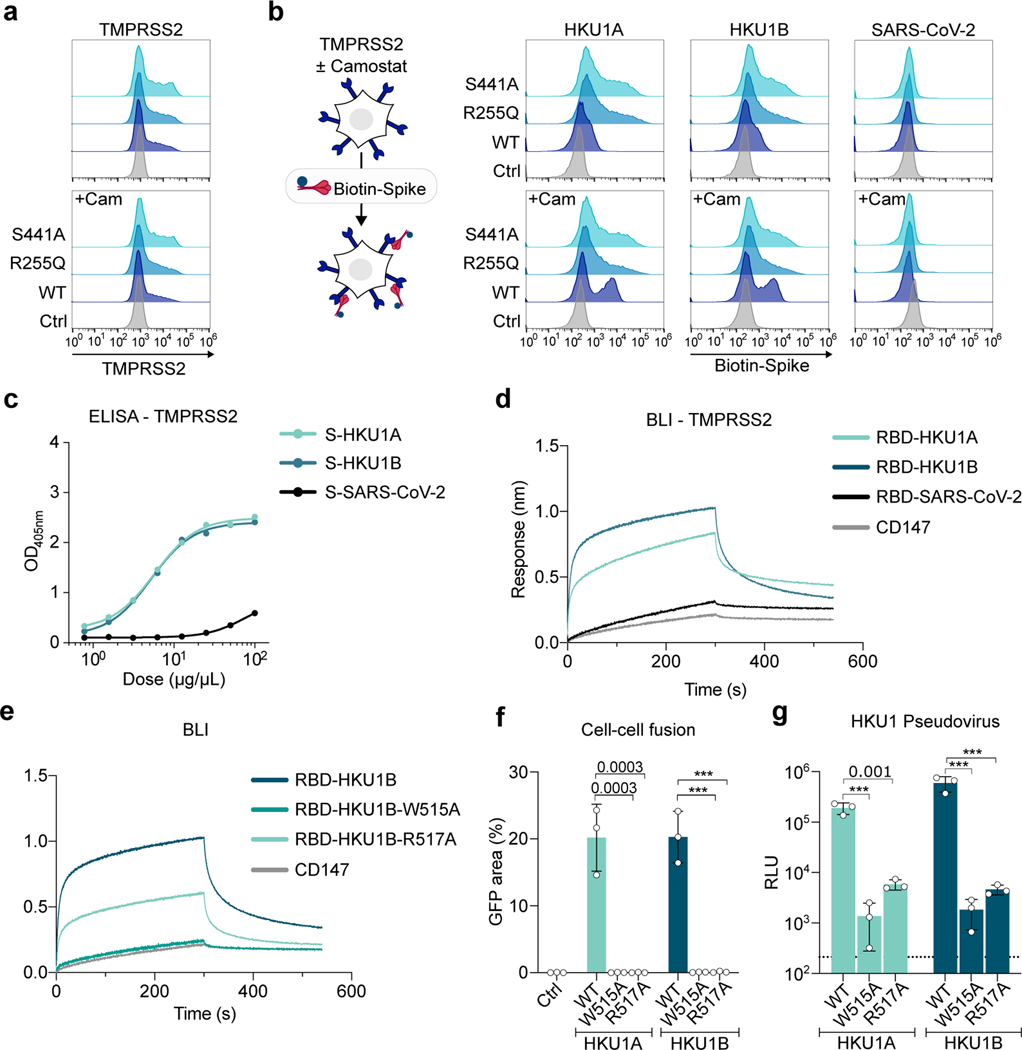
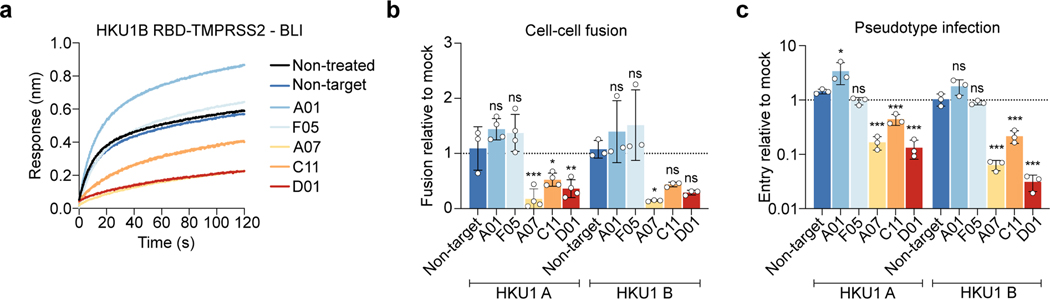
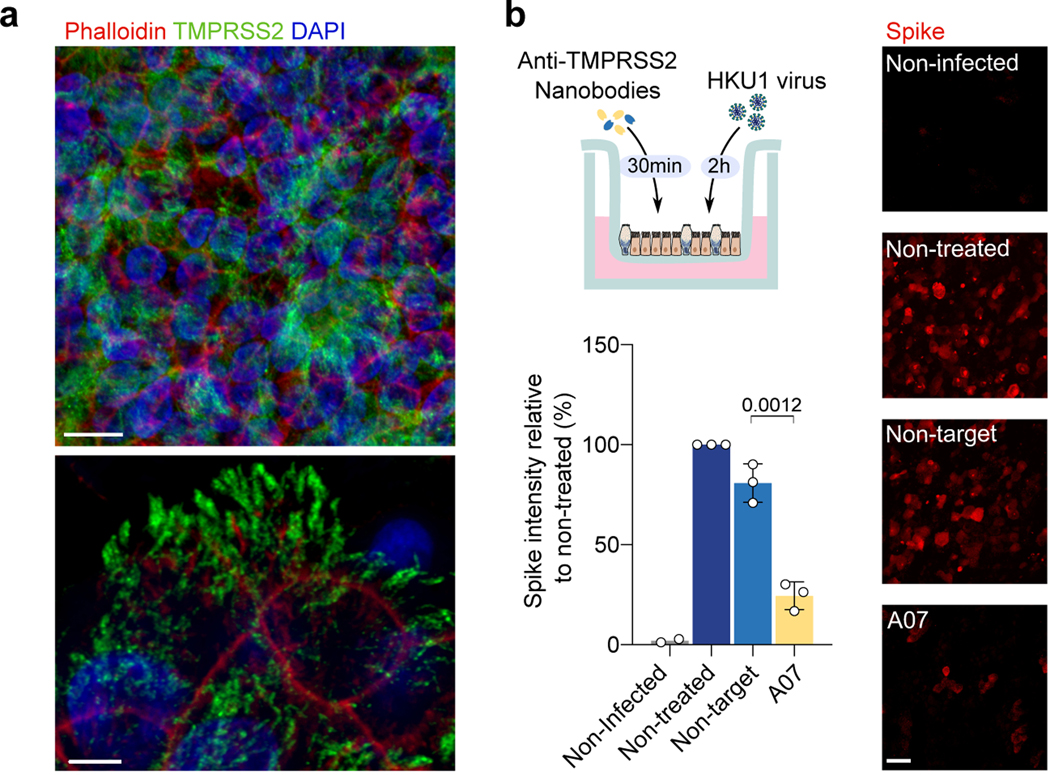
Four endemic seasonal human coronaviruses causing common colds circulate worldwide: HKU1, 229E, NL63 and OC43 (ref. 1). After binding to cellular receptors, coronavirus spike proteins are primed for fusion by transmembrane serine protease 2 (TMPRSS2) or endosomal cathepsins2-9. NL63 uses angiotensin-converting enzyme 2 as a receptor10, whereas 229E uses human aminopeptidase-N11. HKU1 and OC43 spikes bind cells through 9-O-acetylated sialic acid, but their protein receptors remain unknown12. Here we show that TMPRSS2 is a functional receptor for HKU1. TMPRSS2 triggers HKU1 spike-mediated cell-cell fusion and pseudovirus infection. Catalytically inactive TMPRSS2 mutants do not cleave HKU1 spike but allow pseudovirus infection. Furthermore, TMPRSS2 binds with high affinity to the HKU1 receptor binding domain (Kd 334 and 137 nM for HKU1A and HKU1B genotypes) but not to SARS-CoV-2. Conserved amino acids in the HKU1 receptor binding domain are essential for binding to TMPRSS2 and pseudovirus infection. Newly designed anti-TMPRSS2 nanobodies potently inhibit HKU1 spike attachment to TMPRSS2, fusion and pseudovirus infection. The nanobodies also reduce infection of primary human bronchial cells by an authentic HKU1 virus. Our findings illustrate the various evolution strategies of coronaviruses, which use TMPRSS2 to either directly bind to target cells or prime their spike for membrane fusion and entry.


Conflict of interest statement

Conflict of interest

NS, JB, OS, IF, EB, FAR, and PL have a provisional patent on anti-TMPRSS2 nanobodies.

Figures

Extended Data Figure 1.
a. Binding of the 5 anti-TMPRSS2 VHH on recombinant TMPRSS2 measured by BLI. b, c. Comparison of one commercial TMPRSS2 antibody and of the dimeric anti-TMPRSS2 VHH A01-Fc. 293T cells were transfected with WT TMPRSS2. 24 h later, cells were analysed by flow-cytometry. Staining with the commercial antibody was performed on fixed cells (b) while surface staining with the VHH was performed on live cells (c).
Extended Data Figure 2.
Extended Data Figure 2.. Effect of TMPRSS2 and other proteases on HKU1 cell-cell fusion. a, b. Surface expression and fusogenic activity of HKU1 spikes.
a. 293T cells were transfected with plasmids encoding for HKU1A or HKU1B spikes and stained 24 h later with mAb10, a pan anti-coronavirus spike antibody. Data are representative of 3 independent experiments. b. Cell-cell fusion mediated by HKU1A or HKU1B spikes. 293T GFP-Split cells were transfected with HKU1 spikes and TMPRSS2, fusion was visualized by the appearance of GFP+ cells. Data are representative of 6 independent experiments. Scale bar: 400 μm c. Cell-cell fusion mediated by the SARS-CoV-2 spike. 293T GFP-Split cells were transfected with SARS-CoV-2 spike, in the presence of ACE2 or TMPRSS2, fusion was visualized by the appearance of GFP+ cells. Data are mean ± SD of 3 independent experiments d. U2OS cell-cell fusion mediated by HKU1A spike. U2OS GFP-Split cells were transfected with HKU1A spike and TMPRSS2, fusion was visualized by the appearance of GFP+ cells 24 h later. Data are mean ± SD of 3 independent experiments. e. Expression levels of myc-tagged proteases. 293T cells were transfected with a control plasmid or the indicated myc-tagged TMPRSS constructs and stained 24 h later with myc antibody 9E10. Left: Representative dot plots. Right: Percentage of positive cells. Data are mean ± SD of 3 independent experiments. f. Surface expression of tagged and untagged TMPRSS2. 293T cells were transfected with WT TMPRSS2 (TMPRSS2-Untagged) or a myc-tagged TMPRSS2 and surface stained for TMPRSS2 using VHH-A01-Fc. Left: Representative dot plots. Right: Percentage of positive cells. Data are mean ± SD of 3 independent experiments. g, h, i . Surface expression of APN, DPP4 and ACE2. 293T cells were transfected with APN, DPP4 or ACE2 plasmids, and surface stained with the respective antibodies 24 h later. Left: Representative dot plots. Right: Percentage of positive cells. Data are mean ± SD of 3 (TMPRSS2, APN, DPP4) or 4 (ACE2) independent experiments. j. Images of time lapse microscopy of HKU1-mediated cell-cell fusion (extracted from Supp. video 1). 293T cells were transfected either with TMPRSS2-scarlet-I or HKU1A S-NeonGreen. After 24 h, cells were mixed and imaged every 2.5 min for 2 h at 37°C.
Extended Data Figure 3.
Extended Data Figure 3.. Knock-out and silencing of TMPRSS2 in Caco2 cells. a. Linear diagram of the organization of the TMPRSS2 gene.
The CRISPR-Cas9 targeting site is underlined and the proto-spacer recognition motif (PAM) is in bold. Rectangles represent exons, black for 5’ and 3’ untranslated regions, gray for coding regions. b. Sequence analysis of the knock-out Caco2 clone. Both alleles compared to the original wild-type sequence are shown. The knock-out clone harbors an out-of-frame deletion and an insertion, resulting in a frameshift on both alleles. c. Validation of TMPRSS2 knock-out by TMPRSS2 surface staining. Representative dot plots of VHH anti-TMPRSS2 (VHH-A01-Fc) surface staining of a WT and KO Caco2 obtained following CRISPR gene targeting. d. Role of endogenous TMPRSS2 on cell-cell fusion assessed by siRNA. 293T donor cells expressing HKU1A spike were mixed with Caco2 acceptor cells, silenced or not for TMPRSS2. Left: experimental design. Middle: relative expression of TMPRSS2 in Caco2 cells, assessed by RT-qPCR. Data were normalized to β-Tubulin levels. Relative mRNA expression normalized to siCtrl condition (2−ΔΔCT) was plotted. Right: fusion was quantified by measuring the GFP area after 20 h of coculture. Data are mean ± SD of 3 independent experiments. Statistical analysis: two-sided unpaired t-test compared to siCtrl cells. ***p<0.0001.
Extended Data Figure 4.
Extended Data Figure 4.. Effect of mutant TMPRSS2 on cell-cell fusion and pseudovirus infection a. Enzymatic activity of WT and mutant TMPRSS2.
293T cells were transfected with WT and indicated TMPRSS2 mutants. 24 h post transfection, the catalytic activity was assessed using BoC-QAR-AMC fluorogenic substrate. Data are mean ± SD of 4 independent experiments. Statistical analysis: a: one-way ANOVA with Dunnett’s multiple comparisons compared to Ctrl cells (transfected with pQCXIP-Empty). **p<0.01. b. Effect of TMPRSS2 on HKU1 spike expressed on adjacent cells. 293T cells were transfected either with HKU1A spike or with the different TMPRSS2. 20 h post-transfection, cells were mixed at a 1:1 ratio, and let to settle. 3 or 6 h post-mixing, cells were harvested and lysed for WB. One membrane was probed for S1, TMPRSS2 and actin, another membrane was probed for S2 and actin. For gel source data, see SI 1c, d. Representative blots of 2. Molecular weights: kDa. The arrows and # denote the uncleaved and cleaved protein products, respectively. c. Surface levels of WT and mutant TMPRSS2. 293T cells were transfected with the indicated doses of TMPRSS2 plasmid. 18 h post-transfection they were stained intracellularly for TMPRSS2 using the commercial antibody. Left: % of TMP positive cells. Right: Median fluorescent intensity (MFI). #: indicates the chosen plasmid ratios to achieve similar TMPRSS2 levels with WT and indicated mutants. Data are mean ± SD of 3 independent experiments. d. Comparison of the anti-TMPRSS2 commercial antibody and VHH staining in 293T cells. 293T cells were transfected with WT, R255Q and S441A TMPRSS2 plasmids. Cells were stained 24 h later with the indicated antibodies and analysed by flow cytometry. One experiment representative of 3 is shown. Light grey curves correspond to staining with control antibodies or VHH. Parental: untransfected cells. e. Effect of WT and mutant TMPRSS2 on SARS-CoV-2 pseudovirus infection. 293T cells expressing ACE2 were transfected with WT and indicated TMPRSS2 mutants. 24 h later, cells were infected by Luc-encoding SARS-CoV-2 pseudovirus. Luminescence was measured after 48 h. Data are mean ± SD of 4 independent experiments. Statistical analysis: RM one-way ANOVA with Geisser-Greenouse correction on log-transformed data, with Dunnett’s multiple comparisons compared to Ctrl cells (transfected with pQCXIP-Empty). **p<0.01. f, g. Effect of SB412515, E64d or hydroxychloroquine (HCQ) on f. HKU1A or g. HKU1B pseudovirus infection. 293T cells expressing WT or S441A TMPRSS2 were incubated for 2 h with the indicated drugs, before infection with HKU1A or HKU1B pseudoviruses. Luminescence was read 48 h post infection. Left: SB412515. Middle: E64d. Right: HCQ. Data are mean ± SD of 3 (E64d, HKU1B), 4 (E64d HKU1A, SB142515 HKU1B), 5 (HCQ HKU1A) or 6 (HCQ HKU1B, SB412515 HKU1A) independent experiments. Statistical analysis: RM two-way ANOVA with Geisser-Greenouse correction on non-normalized log transformed data, with Dunnett’s multiple comparisons compared to the non-treated conditions. h, i. Surface levels of TMPRSS2 in different cell lines stably expressing WT or S441 TMPRSS2. Cells were stained for TMPRSS2 using VHH-A01-Fc and analyzed by flow cytometry. Representative histograms are shown. h. Left: U2OS. Right: A549. Light grey: cells stained with a non-target control VHH-Fc. Dark grey: Unmodified parental cell lines. Dark and light blue: Cells transduced with either TMPRSS2 or TMPRSS2 S441A mutant. i. Caco2. Light grey: cells stained with a non-target control VHH-Fc. Blue: Unmodified parental cell line. Dark Grey: TMPRSS2 KO Caco2. Dark and light blue: TMPRSS2 KO caco2 stably transduced with TMPRSS2 WT or S441A mutant expression vectors. j. Effect of Camostat on endogenous TMPRSS2 in Caco2 cells. Caco2 cells were incubated in the presence of 100 μM Camostat for 2 h, before infection with HKU1A, HKU1B, or SARS-CoV-2 (D614G or Delta) pseudovirus. Data are normalized to the infection in the absence of the drug. Data are mean ± SD of 3 (SARS-CoV-2) or 4 (HKU1) independent experiments. Statistical analysis: RM two-way ANOVA on non-normalized log transformed data, with Sidak’s multiple comparisons compared to the non-treated conditions. k. Susceptibility of Vero E6 and Vero E6-TMPRSS2 cells to HKU1 pseudovirus infection. Left: pseudovirus infection. Right: TMPRSS2 surface levels. Dark grey: Parental cells. Dark blue: Cells transduced with TMPRSS2. Data are mean ± SD of 4 independent experiments.
Extended Data Figure 5.
Extended Data Figure 5.. Effect of neuraminidase on HKU1 pseudovirus infection.
U2OS-TMPRSS2 cells were treated with indicated concentration of neuraminidase from Arthrobacter ureafaciens for 24 h. a. HKU1A and HKU1B pseudovirus infection in neuraminidase treated cells. Cells were infected with HKU1 A or B pseudoviruses. Luminescence was read 48 h post infection. Data were normalized to the non-treated condition. Data are mean ± SD of 3 (4 mU/mL) or 4 (0, 20, 100 mU/mL) independent experiments. Statistical analysis: Mixed-effect analysis with Geisser-Greenhouse corrections (handles missing values) on non-normalized log transformed data, with Dunnett’s multi-comparison test compared to non-treated cells. b. Surface levels of TMPRSS2 in neuraminidase treated cells. Left: % of TMP positive cells. Right: Median fluorescent intensity (MFI). Data are mean of 2 independent experiments. c. Sambucus Nigra Lectin (SNA) binding on neuraminidase treated cells. Treated cells were stained with fluorescent Lectin SNA which preferentially binds α2,6- over α-2,3 linked sialic acids. Left: Representative histograms. Right: MFI. Data are mean of 2 independent experiments. d. Siglec-E binding on neuraminidase treated cells. Treated cells were stained with recombinant Siglec-E-Fc protein which preferentially binds α2,8- over α2,3- and α2,6-linked sialic acids. Left: Representative histograms. Right: MFI. Data are mean ± SD of 3 independent experiments.
Extended Data Figure 6.
Extended Data Figure 6.. Binding of HKU and SARS-CoV-2 spikes to TMPRSS2 or ACE2. a. Binding of the indicated recombinant spikes to 293T cells expressing TMPRSS2.
Cells were transfected with WT or mutant TMPRSS2 and incubated or not overnight with 10 μM of Camostat. The spikes were then incubated for 0.5 h and their binding was revealed with streptavidin-647 and measured by flow cytometry. The % of cells binding to TMPRSS2 was quantified. Data are mean ± SD of 3 (HKU1A) or 4 (HKU1B, SARS-CoV-2) independent experiments. Two Way ANOVA with Dunnett’s multiple comparisons compared to control cells with or without Camostat. Exact p-values: HKU1A: TMPRSS2 WT-: *0.029, TMPRSS2 WT+:***<0.0001, TMPRSS2 R255Q-: **0.0010, TMPRSS2 R255Q+: **0,0013, TMPRSS2 S441A-: ***0,0001, TMPRSS2 S441A+: ***<0.0001. HKU1B: ***<0.0001. b. Binding of the indicated recombinant spikes to 293T cells expressing ACE2. Cells were transfected with ACE2. The spikes were then incubated for 0.5 h and their binding was revealed with streptavidin-647 and measured by flow cytometry. The % of cells binding to ACE2 was quantified. Data are mean of 2 independent experiments. c. Binding of the indicated soluble spikes on immobilized ACE2 measured by ELISA. d. Binding of S441A TMPRSS2 to HKU1A, HKU1B or SARS-CoV-2 RBD measured by BLI. The response was measured at the indicated concentrations of spikes. Left: HKU1A. Middle: HKU1B. Right: SARS-CoV-2. One representative experiment of 4 is shown. e. Determination of the affinity of HKU1A and B RBD for TMPRSS2 using the steady state method. Circles: Experimental values. Black: Fitting of the experimental data f. Binding of ACE2 to SARS-CoV-2 or HKU1B RBD quantified by BLI, at different concentrations of spikes. g. Binding of S441A TMPRSS2 to HKU1B mutants. Response was measured by BLI at different concentrations of spikes. Left: HKU1B RBD mutant W515A. B: HKU1B RBD mutant R517A. h. Determination of the affinity of HKU1B-R517A RBD for TMPRSS2 using the steady state method. Circles: Experimental values. Black: Fitting of the experimental data. i. Cell surface levels of WT and mutant HKU1 spikes. 293T were transfected with the indicated WT or mutant HKU1A or B spikes, expression was measured by flow cytometry after 24 h, using the anti-spike mAb10.
Extended Data figure 7.
Extended Data figure 7.. Characterization of anti-TMPRSS2 VHHs. a. Binding of VHHs on TMPRSS2-expressing cells.
293T cells were transfected with TMPRSS2 S441A. Binding of the indicated VHHs (0.5 μM) was assessed by flow cytometry. Left: representative dot plots. Right: Quantification of the percentage of positive cells and MFI (Median Fluorescent Intensity of positive cells). Data are mean ± SD of three independent experiments b. Effect of VHHs or Camostat on TMPRSS2 enzymatic activity. Recombinant soluble TMPRSS2 was incubated with the indicated VHHs at different concentrations or with Camostat (1 μM). The initial rate of enzymatic activity, measured with a fluorescent substrate is plotted. One representative experiment of 3 is shown. c. Effect of VHHs on HKU1A or HKU1B cell-cell fusion. 293T GFP-Split cells were cotransfected with TMPRSS2 and HKU1 spike in the presence of indicated amounts of VHH. Fusion was quantified by measuring the GFP area after 20 h. Data were normalized to the non-treated condition for each spike. d. Effect of VHHs on HKU1A or HKU1B pseudovirus infection. 293T cells transfected with S441A TMPRSS2 were incubated with the indicated amounts of VHH for 2 h and infected by Luc-encoding pseudovirus. Luminescence was read 48 h post infection. Data were normalized to the non-treated condition for each virus. Data are from one experiment representative of 3. Statistical analysis: c: One Way ANOVA with Dunnett’s multiple comparisons compared to cells stained with a non-target antibody (VHH93). d: One Way ANOVA on log-transformed data with Dunnett’s multiple comparisons compared to cells stained with a non-target antibody (VHH93).
Extended data Figure 8.
Extended data Figure 8.. Isolation and characterization of a live HKU1B virus.
a. Viral RNA copies in the supernatant of HBE cells were quantified by RT-qPCR. The values at day 0 are the content of the input. Left: initial amplification (first passage). Right: Second amplification of the first passage virus (harvested at day 4) used at two dilutions (1/10 and 1/100) in duplicates. b. Reads coverage and frequency of minor variants frequencies of the isolate sequencing data (first passage virus). Intra-sample single-nucleotide variants frequencies were estimated using iVAR. The genome organization of HKU1 is shown below the plot. c, d. Phylogenetic analysis of HKU1. Maximum likelihood phylogenies of human coronavirus HKU1 (n = 48) estimated using IQ-TREE v2 with 1000 replicates from c. the complete genome and d. spike coding sequences. The tree is midpoint rooted and ultrafast bootstraps values are shown on the main branches. A similar topology was obtained when rooting the tree using another embecovirus (OC43). The tip name corresponding to the newly isolated virus sequence is highlighted in bold and underlined. The tips names corresponding to the recombinant spikes used in this study are shown in bold.
Figure 1.
Figure 1.. TMPRSS2 triggers HKU1 spike fusion.
a. Alignment of HKU1A and B spikes. TD: N-terminal Domain. CTD: C-terminal domain. FP: Fusion-peptide. HR11/2: Heptad-Repeat 1/2. TMD: Transmembrane Domain. Black: mismatch, white: deletion, boxed text (Red): amino-acids of the putative RBM, S1/S2 and S2/S2’ cleavage site. b. TMPRSS2 mediates HKU1 cell-cell fusion. 293T cells expressing either GFP1–10 or GFP-11 (293T-GFP-split cells) were transfected with HKU1 spike and TMPRSS2 or pQCXIP-empty control (Ctrl) plasmids, fusion was quantified by measuring the GFP area after 20 h. Data are mean ± SD of 5 independent experiments. c. Effect of a panel of proteases on cell-cell fusion. 293T-GFP-split cells were transfected with HKU1 spike and the indicated protease plasmids, fusion was quantified by measuring the GFP area after 48 h. Data are mean ± SD of 3 independent experiments. d. TMPRSS2 has to be on the acceptor cell. TMPRSS2 was transfected either in donor cells and HKU1A spike or in acceptor cells. Fusion was quantified after 20 h. Left: experimental design. Middle: representative images of GFP+ cells. Right: fusion quantification. bar: 400 μm. Data are mean ± SD of 4 independent experiments. e. Role of endogenous TMPRSS2. 293T donor cells expressing HKU1A spike were mixed with Caco2 acceptor cells knocked-out or not for the tmprss2 gene. Left: experimental design. Middle: representative images of GFP+ cells. Right: fusion was quantified by measuring the GFP area after 20 h of coculture. Data are mean ± SD of 3 independent experiments. Statistical analysis: b, d, e: Two-sided unpaired t-test compared to control/parental condition. c: one Way ANOVA on non-normalized data with Tukey’s multiple comparisons.
Figure 2.
Figure 2.. Effect of wild-type and mutant TMPRSS2 on HKU1 cell-cell fusion and pseudovirus infection.
a. TMPRSS2 protein. TMPRSS2 is composed of a Transmembrane Domain (TMD), a class A LDL receptor domain (LDLR), a Scavenger Receptor Cysteine-2 rich domain (SRCRD) and a serine peptidase. TMPRSS2 precursor autocleaves at R255-L256, resulting in an active protease. b. TMPRSS2 and spike cleavage. WB of 293T transfected with HKU1A spike and indicated TMPRSS2 mutants. One membrane was probed for S1, TMPRSS2 and actin, another for S2 and actin. For gel source data, see SI 1a, b. Representative blots of 3 independent experiments. Molecular weights: kDa. Arrows and # denote the uncleaved and cleaved proteins, respectively. c. Catalytically inactive TMPRSS2 mutants do not trigger HKU1 cell-cell fusion. Fusion of 293T-GFP split transfected with HKU1 spike and mutant TMPRSS2 was quantified after 20 h and normalized to WT TMPRSS2. Ctrl: pQCXIP-Empty. Left: HKU1A. Right: HKU1B. Data are mean ± SD of 3 independent experiments. d. Catalytically inactive TMPRSS2 mutants mediate HKU1 pseudovirus infection. 293T transfected with WT or mutant TMPRSS2 were infected by Luc-encoding HKU1 pseudovirus. Luminescence was read 48 h post infection. Dotted line indicates background in non-infected cells. Ctrl: pQCXIP-Empty. Data are mean ± SD of 6 (HKU1A) or 3 (HKU1B) independent experiments. e. HKU1 pseudovirus infection in cell lines stably expressing TMPRSS2. Left: U2OS cells. Middle: A549 cells. Right: Caco2 cells. The TMPRSS2 KO Caco2 cells were stably transduced with indicated TMPRSS2. Data are mean ± SD of 3 (U2OS), 8 (A549), 4 (Caco2) independent experiments. Statistical analysis: c: one-way ANOVA on non-normalized data with Dunnett’s multi-comparison test compared to WT TMPRSS2 expressing cells. d, e: one-way ANOVA on log-transformed data with Dunnett’s multi-comparison test compared to the untransfected (d), parental (e: U2OS and A549) or KO cells (e: Caco2), ***p<0.0001.
Figure 3.
Figure 3.. Analysis of HKU1 spike binding to TMPRSS2.
a-b. Binding of soluble HKU1 spikes to 293T cells expressing TMPRSS2. Cells were transfected with TMPRSS2 mutants and incubated or not with 10 μM of Camostat. a. TMPRSS2 levels (assessed with a commercial Ab) b. Binding of soluble biotinylated trimeric spikes measured by flow cytometry. One representative experiment of 3 is shown. Ctrl: pQCXIP-Empty control plasmid. c. Binding of HKU and SARS-CoV-2 spikes on immobilized WT TMPRSS2 measured by ELISA. Mean of 2 independent experiments. d. Binding of S441A TMPRSS2 to RBD coated receptors quantified by Bio-layer interferometry (BLI). One representative experiment of 4 is shown. e, f, g. Properties of W515A and R517A mutant HKU1 spikes. Binding of TMPRSS2 to wild type or mutant RBD coated receptors quantified by BLI. One representative experiment of 4 is shown. f. 293T GFP-split cells were transfected with TMPRSS2 and the indicated HKU1 mutant spikes, fusion was quantified by measuring the GFP area after 24 h. g. 293T cells expressing TMPRSS2 were infected by Luc-encoding mutant HKU1 pseudovirus. Luminescence was read 48 h post infection. Dotted line indicates background. Data are mean ± SD of 3 independent experiments. Statistical analysis: f: one-way ANOVA on non-normalized data with Dunnett’s multi-comparison test compared to WT TMPRSS2 expressing cells. g: one-way ANOVA on log-transformed data with Dunnett’s multi-comparison test compared to WT Spike pseudotypes *p<0.05, **p<0.01, ***p<0.001.
Figure 4.
Figure 4.. Anti-TMPRSS2 VHH nanobodies inhibit HKU1 binding to TMPRSS2, cell-cell fusion and pseudovirus infection.
a. Effect of VHHs on binding of HKU1B RBD to TMPRSS2 measured by BLI. One representative experiment of 2 is shown b. Effect of VHHs on HKU1-mediated cell-cell fusion. 293T GFP-Split cells were transfected with TMPRSS2 and HKU1 spike in the presence of 1 μM of VHH, fusion was quantified 20 h later. Data were normalized to the non-VHH treated condition (dotted line). Data are mean ± SD of 4 independent experiments. c. Effect of VHHs on HKU pseudovirus infection. 293T cells transfected with S441A TMPRSS2 were treated with 1 μM VHH 2 h before infection. Luminescence was read 48 h post infection. Data were normalized to the non-treated condition for each virus (dotted line). Data are mean ± SD of 3 independent experiments. Statistical analysis: b: one Way ANOVA data with Dunnett’s multiple comparisons compared to non-target VHH c: one Way ANOVA on log-transformed data with Dunnett’s multiple comparisons compared to non-target VHH *p<0.05, **p<0.01, ***p<0.001. p-values. Fusion, HKU1A: A07 0.0005, C11: 0.025, D01: 0.004, HKU1B: A07: 0.029, Infection: HKU1A: A01: 0.016, A07: <0.0001, C11:0.0009, D01:<0.0001 HKU1B: A07/C11/D01: <0.0001
Figure 5.
Figure 5.. Live HKU1 virus infection of human bronchial epithelial (HBE) cells.
a. TMPRSS2 staining of HBE cells. Red: Phalloidin, Blue: DAPI, Green: TMPRSS2 stained with VHH A01-Fc. Scale bars: top, 10 μm; bottom, 5 μm. Images are representative of 3 independent experiments. b. Effect of the anti-TMPRSS2 VHH (A07) on HKU1 infection. The experimental design is represented. Infected cells were visualized with an anti-spike antibody and scored. Representative images of spike staining 48 h post-infection are shown. Spike pixel intensity in 5 random fields per experiment was measured and normalized to the intensity in the infected but non-treated condition. Data are mean ± SD of 3 independent experiments for infected conditions, and mean of 2 for uninfected condition. Scale bar: 20 μm. Statistical analysis: Two-sided unpaired t-test compared to non-target VHH.

References

    1. Park S, Lee Y, Michelow IC & Choe YJ Global Seasonality of Human Coronaviruses: A Systematic Review. Open Forum Infectious Diseases 7 (2020). 10.1093/ofid/ofaa443 - DOI - PMC - PubMed
    1. Bertram S. et al. TMPRSS2 Activates the Human Coronavirus 229E for Cathepsin-Independent Host Cell Entry and Is Expressed in Viral Target Cells in the Respiratory Epithelium. J. Virol. 87, 6150–6160 (2013). 10.1128/jvi.03372-12 - DOI - PMC - PubMed
    1. Glowacka I. et al. Evidence that TMPRSS2 Activates the Severe Acute Respiratory Syndrome Coronavirus Spike Protein for Membrane Fusion and Reduces Viral Control by the Humoral Immune Response. J. Virol. 85, 4122–4134 (2011). 10.1128/jvi.02232-10 - DOI - PMC - PubMed
    1. Shirato K, Kawase M. & Matsuyama S. Wild-type human coronaviruses prefer cell-surface TMPRSS2 to endosomal cathepsins for cell entry. Virology 517, 9–15 (2018). 10.1016/j.virol.2017.11.012 - DOI - PMC - PubMed
    1. Shirato K, Kawase M. & Matsuyama S. Middle East respiratory syndrome coronavirus infection mediated by the transmembrane serine protease TMPRSS2. J. Virol. 87, 12552–12561 (2013). 10.1128/JVI.01890-13 - DOI - PMC - PubMed

Additional references

    1. Kodaka M. et al. A new cell-based assay to evaluate myogenesis in mouse myoblast C2C12 cells. Exp. Cell Res. 336, 171–181 (2015). 10.1016/j.yexcr.2015.06.015 - DOI - PubMed
    1. Edie S. et al. Survey of Human Chromosome 21 Gene Expression Effects on Early Development in Danio rerio. G3: Genes, Genomes, Genetics 8, 2215–2223 (2018). 10.1534/g3.118.200144 - DOI - PMC - PubMed
    1. Hayer A. et al. Engulfed cadherin fingers are polarized junctional structures between collectively migrating endothelial cells. Nat. Cell Biol. 18, 1311–1323 (2016). 10.1038/ncb3438 - DOI - PMC - PubMed
    1. Rajah MM et al. SARS-CoV-2 Alpha, Beta, and Delta variants display enhanced Spike-mediated syncytia formation. The EMBO Journal n/a, e108944 (2021). 10.15252/embj.2021108944 - DOI - PMC - PubMed
    1. Iglesias MC et al. Lentiviral vectors encoding HIV-1 polyepitopes induce broad CTL responses in vivo. Mol. Ther. 15, 1203–1210 (2007). 10.1038/sj.mt.6300135 - DOI - PubMed

Publication types