. 2023 Oct;33(10):1734-1746.
doi: 10.1101/gr.277175.122. Epub 2023 Oct 25.

Localizing unmapped sequences with families to validate the Telomere-to-Telomere assembly and identify new hotspots for genetic diversity

Affiliations

Localizing unmapped sequences with families to validate the Telomere-to-Telomere assembly and identify new hotspots for genetic diversity

Brianna Chrisman et al. Genome Res. 2023 Oct.

Abstract

Although it is ubiquitous in genomics, the current human reference genome (GRCh38) is incomplete: It is missing large sections of heterochromatic sequence, and as a singular, linear reference genome, it does not represent the full spectrum of human genetic diversity. To characterize gaps in GRCh38 and human genetic diversity, we developed an algorithm for sequence location approximation using nuclear families (ASLAN) to identify the region of origin of reads that do not align to GRCh38. Using unmapped reads and variant calls from whole-genome sequences (WGSs), ASLAN uses a maximum likelihood model to identify the most likely region of the genome that a subsequence belongs to given the distribution of the subsequence in the unmapped reads and phasings of families. Validating ASLAN on synthetic data and on reads from the alternative haplotypes in the decoy genome, ASLAN localizes >90% of 100-bp sequences with >92% accuracy and ∼1 Mb of resolution. We then ran ASLAN on 100-mers from unmapped reads from WGS from more than 700 families, and compared ASLAN localizations to alignment of the 100-mers to the recently released T2T-CHM13 assembly. We found that many unmapped reads in GRCh38 originate from telomeres and centromeres that are gaps in GRCh38. ASLAN localizations are in high concordance with T2T-CHM13 alignments, except in the centromeres of the acrocentric chromosomes. Comparing ASLAN localizations and T2T-CHM13 alignments, we identified sequences missing from T2T-CHM13 or sequences with high divergence from their aligned region in T2T-CHM13, highlighting new hotspots for genetic diversity.


Figures

Figure 1.
Figure 1.
Pipeline for ASLAN and its components. (A) Overall pipeline for extracting k-mers, phasing families, and localizing k-mers based on phasings and k-mer distributions. (B) Simplified schematic of the hidden Markov model used for the phasing algorithm, in which the goal is to identify the inheritance patterns and recombination points that best explain the variant calls in a family. (C) Simplified schematic of the maximum likelihood model to identify the most likely region of a genome that a k-mer originates from, given the distribution of the k-mer and phasing patterns within and across families.
Figure 2.
Figure 2.
ASLAN performance on unmapped reads. (A) Distribution of prevalence and abundance (median of nonzero counts) for all 100-mers extracted from unmapped reads. (B) Distribution of prevalence and abundance for 100-mers that localized to autosomes. (C) Distribution of male prevalence and abundance for 100-mers that localized the Y Chromosome. (D) Number and fraction of 100-mers that ASLAN could and could not localize, given their prevalences across the iHART population. (E) Distribution of localized region length. (F) Number of k-mers localized to each chromosome. (G) Distribution of localization location in reference to GRCh38, with gaps annotated. (H) Distribution of k-mer localization location and prevalence.
Figure 3.
Figure 3.
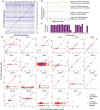
Comparison between ASLAN localizations and T2T-CHM13 alignments. (A) Confusion matrix comparing ASLAN localizations, lifted over to T2T-CHM13 coordinates to T2T-CHM13 alignments of 100-mers extracted from the unmapped reads, binned into 1000 equally sized bins across the genome. (B) Concordance rate between ASLAN localization and T2T-CHM13 alignment versus alignment score, colored by whether or not alignment to T2T-CHM13 was a unique mapping or not. (C) Concordance rate between ASLAN localization and T2T-CHM13 alignment, versus the chromosome to which ASLAN localized. Acrocentric Chromosomes 13–15 and 21–22 show a significantly lower concordance. (D) T2T-CHM13 alignment versus center point of ASLAN localization region, separated by chromosome and colored by whether or not T2T-CHM13 alignment and ASLAN localization were in concordance.
Figure 4.
Figure 4.
Characterizing nonconcordance between ASLAN localizations and CHM13 alignments and potential hotspots of genetic diversity. (A) Distribution of reads that failed to align to the T2T-CHM13 assembly but that were successfully localized via ASLAN. (B) Distribution of reads for which the localization region predicted by ASLAN contained the location the read aligned to on T2T-CHM13 but for which the T2T-CHM13 alignment score was less than 90. These regions may indicate new hotspots for genetic diversity. (C) Joint-plot of regions where ASLAN localization and T2T-CHM13 alignments were in disagreement with one another and where the T2T-CHM13 alignment score was less than 90. These may indicate sequences that are not represented in the T2T-CHM13 but that are somewhat homologous to a different region in T2T-CHM13 and may be mismapped. (D,E) Loci and alignment score distribution between the T2T-CHM13 alignments for k-mers with ASLAN localizations in agreement with each other (D) and in disagreement with each other (E). We see that k-mers in disagreement have significantly lower alignment scores, suggesting that imperfect alignments to T2T-CHM13 may actually be originating from a human genome sequence not well represented on T2T-CHM13.

References

    1. Aird D, Ross MG, Chen WS, Danielsson M, Fennell T, Russ C, Jaffe DB, Nusbaum C, Gnirke A. 2011. Analyzing and minimizing PCR amplification bias in Illumina sequencing libraries. Genome Biol 12: R18. 10.1186/gb-2011-12-2-r18 - DOI - PMC - PubMed
    1. Albert N, Daniels J, Schwartz J, Du M, Wall DP. 2017. GapMap: enabling comprehensive autism resource epidemiology. JMIR Public Health Surveill 3: e27. 10.2196/publichealth.7150 - DOI - PMC - PubMed
    1. Altemose N, Miga KH, Maggioni M, Willard HF. 2014. Genomic characterization of large heterochromatic gaps in the human genome assembly. PLoS Comput Biol 10: e1003628. 10.1371/journal.pcbi.1003628 - DOI - PMC - PubMed
    1. Altemose N, Logsdon GA, Bzikadze AV, Sidhwani P, Langley SA, Caldas GV, Hoyt SJ, Uralsky L, Ryabov FD, Shew CJ, et al. 2022. Complete genomic and epigenetic maps of human centromeres. Science 376: eabl4178. 10.1126/science.abl4178 - DOI - PMC - PubMed
    1. Chrisman B, Varma M, Washington P, Paskov K, Stockham N, Jung JY, Wall DP. 2018. Analysis of sex and recurrence ratios in simplex and multiplex autism spectrum disorder implicates sex-specific alleles as inheritance mechanism. In 2018 IEEE International Conference on Bioinformatics and Biomedicine (BIBM), pp. 1470–1477. IEEE, Madrid.

Publication types

LinkOut - more resources