. 2023 Oct;11(10):e007349.
doi: 10.1136/jitc-2023-007349.

MCT4 blockade increases the efficacy of immune checkpoint blockade

Affiliations

MCT4 blockade increases the efficacy of immune checkpoint blockade

Nathalie Babl et al. J Immunother Cancer. 2023 Oct.

Abstract

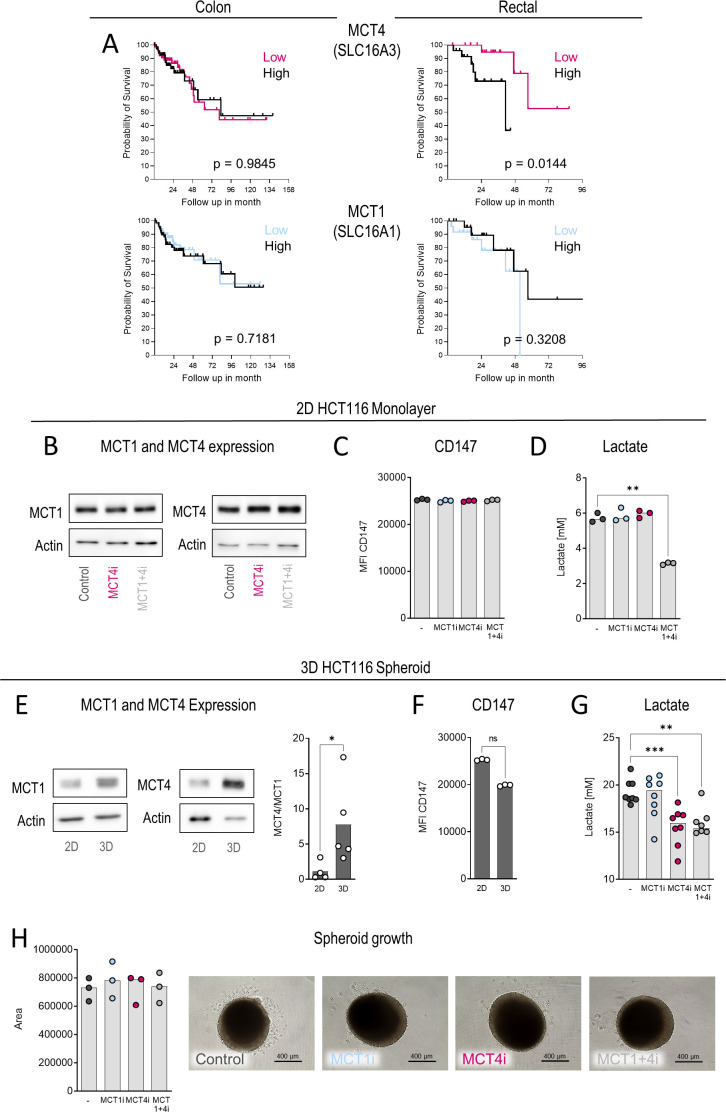
Background & aims: Intratumoral lactate accumulation and acidosis impair T-cell function and antitumor immunity. Interestingly, expression of the lactate transporter monocarboxylate transporter (MCT) 4, but not MCT1, turned out to be prognostic for the survival of patients with rectal cancer, indicating that single MCT4 blockade might be a promising strategy to overcome glycolysis-related therapy resistance.

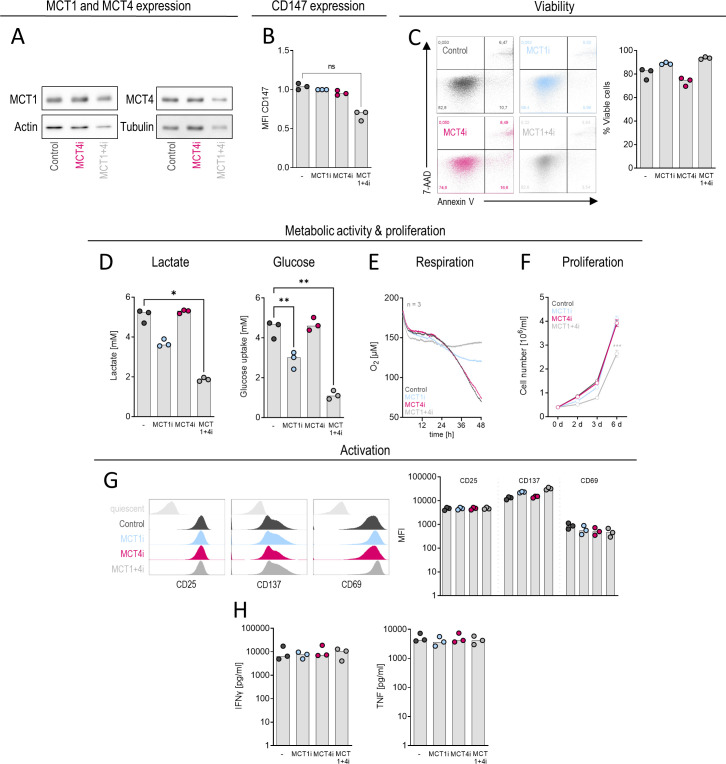
Methods: To determine whether blockade of MCT4 alone is sufficient to improve the efficacy of immune checkpoint blockade (ICB) therapy, we examined the effects of the selective MCT1 inhibitor AZD3965 and a novel MCT4 inhibitor in a colorectal carcinoma (CRC) tumor spheroid model co-cultured with blood leukocytes in vitro and the MC38 murine CRC model in vivo in combination with an antibody against programmed cell death ligand-1(PD-L1).

Results: Inhibition of MCT4 was sufficient to reduce lactate efflux in three-dimensional (3D) CRC spheroids but not in two-dimensional cell-cultures. Co-administration of the MCT4 inhibitor and ICB augmented immune cell infiltration, T-cell function and decreased CRC spheroid viability in a 3D co-culture model of human CRC spheroids with blood leukocytes. Accordingly, combination of MCT4 and ICB increased intratumoral pH, improved leukocyte infiltration and T-cell activation, delayed tumor growth, and prolonged survival in vivo. MCT1 inhibition exerted no further beneficial impact.

Conclusions: These findings demonstrate that single MCT4 inhibition represents a novel therapeutic approach to reverse lactic-acid driven immunosuppression and might be suitable to improve ICB efficacy.

Keywords: Drug Therapy, Combination; Immune Checkpoint Inhibitors; Immunologic Surveillance; Lymphocytes, Tumor-Infiltrating; Metabolism; Tumor Microenvironment.


Conflict of interest statement

Competing interests: The study was conducted in close collaboration with Merck. A.S-H., T.H., and C.H. are employees of Merck. R.F. is an employee of EMD Serono Research & Development Institute, Inc., Billerica, MA, USA, an affiliate of Merck KGaA. S.R. was an employee of EMD Serono Research & Development Institute, Inc., Billerica, MA, USA, an affiliate of Merck KGaA at the time the research was conducted.

Figures

Figure 1
Figure 1
MCT4 expression negatively correlates with overall survival in rectal cancer and its inhibition reduces lactic acid secretion. (A) Transcriptome data from 326 colon cancer and 186 rectal cancer samples were obtained from The Cancer Genome Atlas database using the UCSC Xena platform: Expression is depicted as log2(fpkm-uq+1) values. Log-rank (Mantel-Cox) test was used to calculate differences in overall survival when comparing the upper and the lower quartile of samples. (B–D) 2D cultures of HCT116 cells were treated with 0.1 µM MCT1 inhibitor (MCT1i) and/or MCT4 inhibitor (MCT4i). (B) Protein expression of MCT1 and MCT4 was analyzed by Western blot analysis after 24 hours of treatment. One representative blot out of three independent experiments is shown. (C) CD147 expression was determined by flow cytometry after 24 hours of treatment. MFI, median fluorescence intensity. (D) Lactate concentrations were measured after 24 hours in culture supernatants. (E–H) HCT116 were cultured either as monolayer (2D) or spheroids (3D). HCT116 monolayers were treated for 24 hours and spheroids for 9 days with 0.1 µM MCT1i and MCT4i. (E) MCT expression was analyzed in whole-cell lysates of HCT116 monolayers or HCT116 spheroids by Western blot analysis (n=5). Ratio of MCT4/MCT1 expression was quantified by Image J. (F) CD147 expression was determined by flow cytometry. (G) Lactate concentrations were measured after 9 days in 3D HCT116 spheroid culture supernatants. (H) Morphology of treated spheroids was assessed after 9 days of treatment and images were recorded using the EVOS system (n=8). One representative picture out of eight independent experiments is shown. Area was quantified in three experiments using ImageJ. Median values and single data points are shown. (B–H) Depicted are representative blots or median values with single data points. Significance was determined using Mann-Whitney U test for comparison of two groups and one-way ANOVA and post hoc Bonferroni multiple comparison test when comparing more than two groups (*p<0.05; **p<0.01; ***p<0.001), unless indicated otherwise. ANOVA, analysis of variance; MCT, monocarboxylate transporter; 2D, two-dimensional; 3D, three-dimensional.
Figure 2
Figure 2
CD3+ T-cell function on MCT inhibition. CD3+ T cells were isolated from MNCs of healthy donors, stimulated with αCD3/CD28 Dynabeads at a cell-to-bead ratio of 1:1 in the presence of 25 IU/mL IL-2 and treated with 0.1 µM each, either MCT1 inhibitor (MCT1i) and/or MCT4 inhibitor (MCT4i). (A) Protein expression of MCT1 and MCT4 was analyzed in whole-cell lysates by Western blot analysis after 48 hours of stimulation/treatment (n=5). (B) CD147 expression was determined by flow cytometry after 48 hours of treatment. MFI, median fluorescence intensity. (C) Viability was assessed after 72 hours of treatment by Annexin V/7-AAD staining followed by flow cytometric analysis. Viable cells were designated as Annexin V/ 7-AAD double negative. (D) Lactate and glucose concentrations were measured after 48 hours of treatment in culture supernatants. (E) Oxygen consumption was monitored by the PreSens technology. (F) Cell number was analyzed after 72 hours of treatment using the CASY system. Depicted are mean values with SEM. (G) CD25, CD137, and CD69 expression were determined by flow cytometry after 48 hours of treatment. (H) Cytokine levels in culture supernatants were measured by ELISA. (A–H) Depicted are representative blots or summarized values as median values with single data points, unless indicated otherwise. Significance was determined using one-way ANOVA and post hoc Bonferroni multiple comparison test, except for (G) (*p<0.05; **p<0.01). ANOVA, analysis of variance; CASY, cell counter and analyzer system; IFNγ, interferon γ; IL, interleukin; MCT, monocarboxylate transporter; MNCs, mononuclear cells; TNF, tumor necrosis factor.
Figure 3
Figure 3
Selective MCT4 inhibition supports T-cell function and potentiates ICB in a 3D co-culture model of HCT116 spheroids with immune cells. (A) Co-culture protocol: HCT116 spheroids were treated with inhibitors for 9 days. Whole blood leucocytes were added to HCT116 spheroids for 24 hours. In parallel, T cells were stimulated for 24 hours with αCD3/CD28 Dynabeads and added the next day together with human aPD-L1 antibody or the respective isotype control (Iso) for additional 24 hours (final concentration 10 µg/mL, respectively). Spheroids were harvested and prepared either for subsequent flow cytometry analysis or for live-cell imaging. Created with BioRender.com. (B–F) Single cell suspensions were prepared from spheroids. (B) Tumor cell proliferation was determined by Ki67 staining and analyzed by flow cytometry in viable CD45 cells. (C) Fold change of viable CD45+ infiltrated immune cells after 48 hours co-culture. (D–F) Gated on viable cells. (D) T-cell proliferation was determined by Ki67 staining and analysis by flow cytometry after 48 hours of co-culture. (E) Percentage of Interferon γ (IFNγ+) or fold change in granzyme B (GrzB+) positive T cells among CD45+ leukocytes after 48 hours of co-culture are shown. (F) Fold change of CD25 expressing CD3+T cells among CD45+ leukocytes is determined by flow cytometry after 48 hours of co-culture. (G) T-cell subset distribution (NV, EM, CM, EMRA) and portion of cytokine expression in memory (CD45RO+) T cells was investigated according to CD45RO and CCR7 surface staining after 48 hours of co-culture (see gating strategy in online supplemental figure S3B). (H) After 48 hours of co-culture, spheroids were washed, fresh medium containing respective treatments and Cyto3D Live-Dead Assay Kit was added and spheroids with infiltrated immune cells were monitored under cell culture conditions for 48 hours using the Incucyte Live Cell Imaging System. Representative pictures of three independent experiments after 4 days of co-culture with immune cells. Green fluorescence=viable cells (Acridine Orange+), red=dead cells (Propidium Iodide+). Mean green fluorescence intensity was quantified as a measure of cell viability. (I) MC38-OVA-GFP spheroids, treated with or without MCTi, were co-cultured with B-cell depleted unstimulated OT-I splenocytes and 24 hours pre-activated splenocytes along with aPD-L1 and respective isotype (final concentration 10 µg/mL). 48 hours later, spheroids were harvested, treatments refreshed and spheroid viability monitored by means of GFP fluorescence (green) using the Incucyte Live Cell Imaging System. Representative pictures of one of two independent experiments after 5 days of co-culture with immune cells are shown. (B–I) Depicted are representative blots or pictures and summarized values as median values with single data points, unless indicated otherwise. Significance was determined using one-way ANOVA and post hoc Bonferroni multiple comparison test (*p<0.05; **p<0.01; ***p<0.001; digits indicate exact p values). ANOVA, analysis of variance; aPD-L1, anti-programmed cell death ligand-1; CM, central memory; EM, effector memory; EMRA, effector memory CD45RA re-expressing; FACS, fluorescence activated cell sorting; ICB, immune checkpoint blockade; MCT, monocarboxylate transporter; MCTi, MCT inhibitor; NV, naïve; 3D, three-dimensional.
Figure 4
Figure 4
MCT4 blockade improves the efficacy of immune checkpoint blockade in vivo. (A) Mct1 and Mct4 expression in MC38 cells, cultured either as monolayer, spheroids or in ex vivo tumor tissue, was determined by western blot analysis (n=3) or in tumor tissue by immunohistochemistry. One representative blot out of three independent experiments is shown. (B) Protocol for in vivo experiments. 1×10⁶ MC38 cells were injected subcutaneously into the flank of C57BL/6 mice. Treatment was started on day 6 after cell implantation. MCT inhibitors were administered p.o. daily (AZD3965 MCT1 inhibitor (MCT1i) 100 mg/kg body weight; MSC-4381 MCT4 inhibitor (MCT4i) 30 mg/kg body weight). Murine anti-PD-L1 antibody or respective isotype (10 mg/kg body weight) were administered i.p. every third day). For survival studies, animals were treated until the endpoint was reached. For immune infiltration and tumor pH studies, animals were treated and tumors collected on days 11–13 (two complete treatment cycles). Created with BioRender.com. (C) Individual tumor growth curves. Each line represents one mouse. (D) Survival was plotted as Kaplan-Meier estimation curves. Significance was calculated by applying the log-rank (Mantel-Cox) test with correction for multiple testing (Bonferroni correction of the p value for the number of statistical tests (n=10) performed (significant differences: *compared with vehicle, # compared with aPD-L1 antibody, + compared with to MCT4i; **p<0.01 ***p<0.001; ##p<0.01; +++p < 0.001). (E) Tumor volume of MC38wt and MC38Mct4−/− tumors was monitored over time. Mean±SEM is shown. Significance was determined by two-way ANOVA and post hoc Bonferroni multiple comparison test (significant differences: *compared with vehicle, #compared with aPD-L1 antibody, +compared with to MCT4i; ***p<0.001; ##p<0.01; +++p < 0.001). (F–I) Gated on single, viable cells. (F) Percentage of CD3+ T cells among CD45+ cells determined by flow cytometry. (G) Percentage of CD8+ T cells among CD45+ cells determined by flow cytometry. (H) Percentage of interferon γ (IFNγ+) or CD25 positive cells among CD3+ T cells determined by flow cytometry. (I) Percentage of IFNγ+ or CD25 positive cells among CD8+ T cells determined by flow cytometry. (F–I) Representative plots and median values with single data points are shown. Significance was determined using one-way ANOVA and post hoc Bonferroni multiple comparison test (*p<0.05), unless indicated otherwise. ANOVA, analysis of variance; aPD-L1, anti-programmed cell death ligand-1; i.p., intraperitoneally; Iso, isotype; MCT, monocarboxylate transporter; p.o., orally.
Figure 5
Figure 5
MCT4 inhibition attenuates the Warburg phenotype of MC38 tumors. 1×10⁶ MC38 cells were injected subcutaneously into the flank of C57BL/6 mice. Treatment was started on day 6 after cell implantation. MCT inhibitors were administered p.o. daily (AZD3965 MCT1 inhibitor (MCT1i) 100 mg/kg body weight; MSC-4381 MCT4 inhibitor (MCT4i) 30 mg/kg body weight). Murine anti-PD-L1 antibody or respective isotype (10 mg/kg body weight) were administered i.p. every third day, one treatment cycle consists of 2 days of MCTi alone+1 day of MCTi combined with aPD-L1 antibody. For tumor pH studies, animals were treated and tumors collected on days 11–13 (two complete treatment cycles). (A) Intratumoral concentrations of glucose (Glc), pyruvate (Pyr), citrate, succinate (Succ) and malate were determined in interstitial fluid (interst. fluid) and total tissue (snap-frozen in liquid nitrogen after extraction of interstitial fluid) by gas chromatography-mass spectrometry. Glucose plotted against lactate (Lac) concentrations in total tumor tissue and interstitial fluid. Correlation was computed using Pearson correlation test. (B) Tumor pH was measured using a microprobe pH meter at a depth of 1, 2 and 3 mm. Median values with single data points are shown. (C) Glucose uptake by viable CD45 cells was determined by 2-deoxy-2-[(7-nitro-2,1,3-benzoxadiazol-4-yl)amino]-D-glucose (2NBDG) staining and analysis by flow cytometry. MFI, median fluorescence intensity. (D) 2NBDG signal in viable cell leukocyte populations (CD3+ T cells, NK1.1+ cells, Gr-1+ and Gr-1- tumor-associated myeloid cells and F4/80+ macrophages). (A–D) Single data points and median values are shown. Significance was determined using one-way ANOVA and post hoc Bonferroni multiple comparison test (*p<0.05). Graphics depicting cells are created with BioRender.com. ANOVA, analysis of variance; aPD-L1, anti-programmed cell death ligand-1; i.p., intraperitoneally; Iso, isotype; MCT, monocarboxylate transporter; MCTi, MCT inhibitor; p.o., orally; TCA, tricarboxylic acid cycle.

References

    1. Hanahan D, Weinberg RA. Hallmarks of cancer: the next generation. Cell 2011;144:646–74. 10.1016/j.cell.2011.02.013 - DOI - PubMed
    1. Siska PJ, Singer K, Evert K, et al. . The immunological Warburg effect: can a metabolic-tumor-Stroma score (Mets) guide cancer Immunotherapy Immunol Rev 2020;295:187–202. 10.1111/imr.12846 - DOI - PubMed
    1. Walenta S, Wetterling M, Lehrke M, et al. . High lactate levels predict likelihood of metastases, tumor recurrence, and restricted patient survival in human Cervical cancers. Cancer Res 2000;60:916–21. - PubMed
    1. Pinheiro C, Longatto-Filho A, Azevedo-Silva J, et al. . Role of Monocarboxylate transporters in human cancers: state of the art. J Bioenerg Biomembr 2012;44:127–39. 10.1007/s10863-012-9428-1 - DOI - PubMed
    1. Choi J-W, Kim Y, Lee J-H, et al. . Prognostic significance of lactate/proton Symporters Mct1, Mct4, and their chaperone Cd147 expressions in urothelial carcinoma of the bladder. Urology 2014;84. 10.1016/j.urology.2014.03.031 - DOI - PubMed

Publication types