. 2023 Oct 25;14(1):6793.
doi: 10.1038/s41467-023-42338-8.

Three-dimensional ultrasound matrix imaging

Affiliations

Three-dimensional ultrasound matrix imaging

Flavien Bureau et al. Nat Commun. .

Abstract

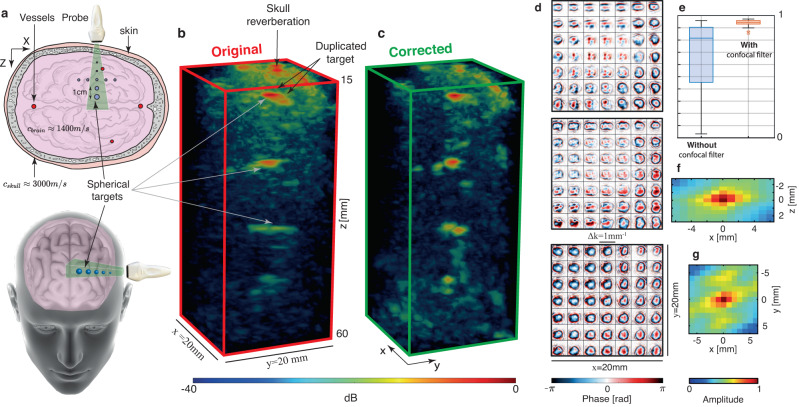
Matrix imaging paves the way towards a next revolution in wave physics. Based on the response matrix recorded between a set of sensors, it enables an optimized compensation of aberration phenomena and multiple scattering events that usually drastically hinder the focusing process in heterogeneous media. Although it gave rise to spectacular results in optical microscopy or seismic imaging, the success of matrix imaging has been so far relatively limited with ultrasonic waves because wave control is generally only performed with a linear array of transducers. In this paper, we extend ultrasound matrix imaging to a 3D geometry. Switching from a 1D to a 2D probe enables a much sharper estimation of the transmission matrix that links each transducer and each medium voxel. Here, we first present an experimental proof of concept on a tissue-mimicking phantom through ex-vivo tissues and then, show the potential of 3D matrix imaging for transcranial applications.


Conflict of interest statement

A.A., M.F., and W.L. are inventors of a patent related to this work held by CNRS (no. US11346819B2, published May 2022). W.L. had his PhD funded by the SuperSonic Imagine company and is now an employee of this company. All authors declare that they have no other competing interests.

Figures

Fig. 1
Fig. 1. 3D Ultrasound Matrix Imaging (UMI).
ac The R-matrix can be acquired in the (a) transducer or (b) plane-wave basis in transmit and (c) recording the back-scattered wave field on each transducer in receive. d Confocal imaging consists in a simultaneous focusing of waves at input and output. e In UMI, the input (rin) and output (rout) focusing points are decoupled. f  x−cross-section of the focused R−matrix. g Four-dimensional structure of the focused R-matrix. h UMI enables a quantification of aberrations by extracting a local RPSF (displayed here in amplitude) from each antidiagonal of Rρρ(z). i UMI then consists in a projection of the focused R-matrix in a correction (here transducer) basis at output. The resulting dual R-matrix connects each focusing point to its reflected wave-front. j UMI then consists in realigning those wave-fronts to isolate their distorted component from their geometrical counterpart, thereby forming the D-matrix. k An iterative phase reversal algorithm provides an estimator of the T-matrix between the correction basis and the mid-point of input focusing points considered in panel (i). l The phase conjugate of the T-matrix provides a focusing law that improves the focusing process at output. m RPSF amplitude after the output UMI process. The ultrasound data shown in this figure corresponds to the pork tissue experiment at depth z = 40 mm.
Fig. 2
Fig. 2. Ultrasound Matrix Imaging of a tissue-mimicking phantom through a pork tissue.
a Schematic of the experiment. b Maps of original RPSFs (in amplitude) at depth z = 29 mm. c Aberration phase laws extracted at the different steps of the UMI process. d Corresponding RPSFs after aberration compensation at each step. e, f 3D confocal and UMI images with one longitudinal and transverse cross-section.
Fig. 3
Fig. 3. Convergence of the UMI process towards the T-matrix.
a Normalized scalar product Pin/out extracted at a point r1 (c) as a function of the size w1 of the considered spatial window W1 for 2D (orange) and 3D (green) imaging. b Corresponding bias intensity estimator, ∣δT2 = 1 − Pin/out, as a function of the number of resolution cells NW contained in the window W1. The plot is in log-log scale and the theoretical power law (Eq. (6)) is shown with a dashed black line for comparison. c Cross-section of the confocal volume showing the location of W1 in green and W2 in yellow. The green box W1, centered around the point r1 = (5, − 5, 41) mm, denotes the region where the T^-matrix is extracted, while the yellow box W2, of fixed size w2 = 2 mm and centered around the point r2 = (5, − 5, 45) mm, is the area where the effect of aberration correction is investigated by means of the RPSF. d Spatial windows W1 considered for the calculation of C(r1). From left to right: Boxes of dimension w = 0 mm, w = 0.75 mm, w = 1.25 mm, rectangle of dimension w = 1.25 mm. ef Corresponding input T^in and output T^out aberration laws, respectively. The scalar product Pin/out is displayed in each sub-panel of (f). g, h RPSF associated with the yellow box W2 (g) before correction and (h) after correction using the corresponding T^-matrices displayed in panels (e) and (f).
Fig. 4
Fig. 4. Ultrasound Matrix Imaging of the head phantom.
a Top and oblique views of the experimental configuration. Image credits: Harryarts and kjpargeter on Freepik. b, c Original and UMI images, respectively. d Aberration laws at 3 different depths. From top to bottom: z = 20 mm, z = 32 mm, z = 60 mm. e Reciprocity criterion Pin/out with or without the use of a confocal filter: Each box chart displays the median, lower and upper quartiles, and the minimum and maximum values. f, g. Correlation function of the T^-matrix in the (x, z)-plane (f) and (x, y)-plane (g), respectively. We attribute the sidelobes along the y-axis (g) to the inactive rows separating each block of 256 elements of the matrix array.
Fig. 5
Fig. 5. Aberrations and multiple scattering quantification in the head phantom.
a Single scattering (green), multiple scattering (blue) and noise (red) rate at z = 32 mm. b Single scattering, multiple scattering, and noise rates as a function of depth. c, d Maps of local RPSFs (in amplitude) before and after correction, respectively, at three different depths (From top to bottom: z = 20 mm, 32 mm and 60 mm. Black boxes in panel (a) and (c) corresponds to the same area. e Resolution δρ(−3dB) as a function of depth. Initial resolution (red line) and its value after UMI (green line) are compared with the ideal (diffraction-limited) resolution (Eq. (5)).
Fig. 6
Fig. 6. 2D versus 3D matrix imaging in a head phantom.
a Aberration law extracted with 2D UMI for a target located at z = 38 mm. b, c Original and corrected images of the same target with 2D UMI, respectively. d Aberration law extracted with 3D UMI. e, f Original and corrected images of the same target with 3D UMI, respectively. g Imaging PSF before (red) and after (green) 2D (dotted line) and 3D (solid line) UMI. The depth range considered in each panel corresponds to the echo of the target located at z = 38 mm.

References

    1. Lambert W, Cobus LA, Couade M, Fink M, Aubry A. Reflection matrix approach for quantitative imaging of scattering media. Phys. Rev. X. 2020;10:021048.
    1. Ntziachristos V. Going deeper than microscopy: the optical imaging frontier in biology. Nat. Methods. 2010;7:603. doi: 10.1038/nmeth.1483. - DOI - PubMed
    1. Yilmaz, O. Seismic Data Analysis (Society of Exploration Geophysicists, 2001).
    1. Babcock HW. The possibility of compensating astronomical seeing. Publ. Astron. Soc. Pac. 1953;65:229. doi: 10.1086/126606. - DOI
    1. Roddier, F. ed. Adaptive Optics in Astronomy (Cambridge University Press, 1999).