. 2023 Oct 25;14(1):6796.
doi: 10.1038/s41467-023-42504-y.

Single-cell morphological and topological atlas reveals the ecosystem diversity of human breast cancer

Affiliations

Single-cell morphological and topological atlas reveals the ecosystem diversity of human breast cancer

Shen Zhao et al. Nat Commun. .

Abstract

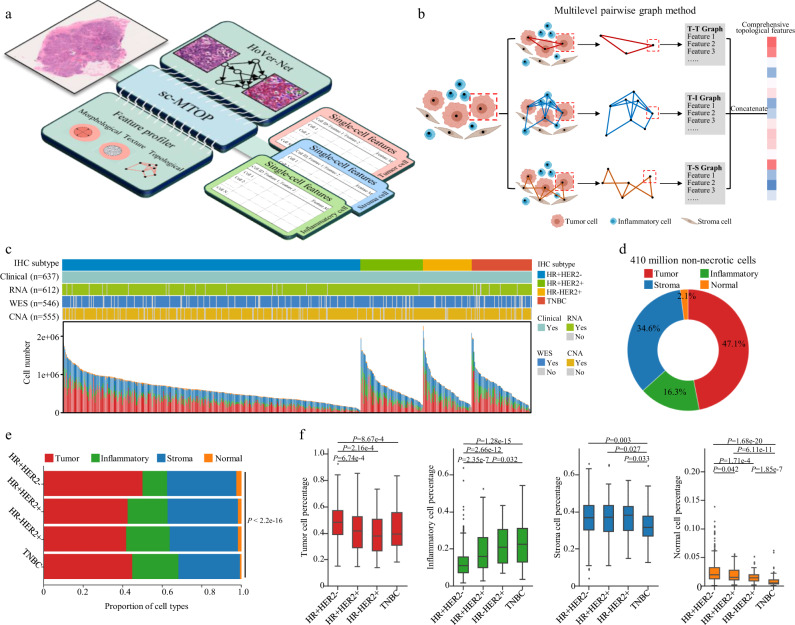
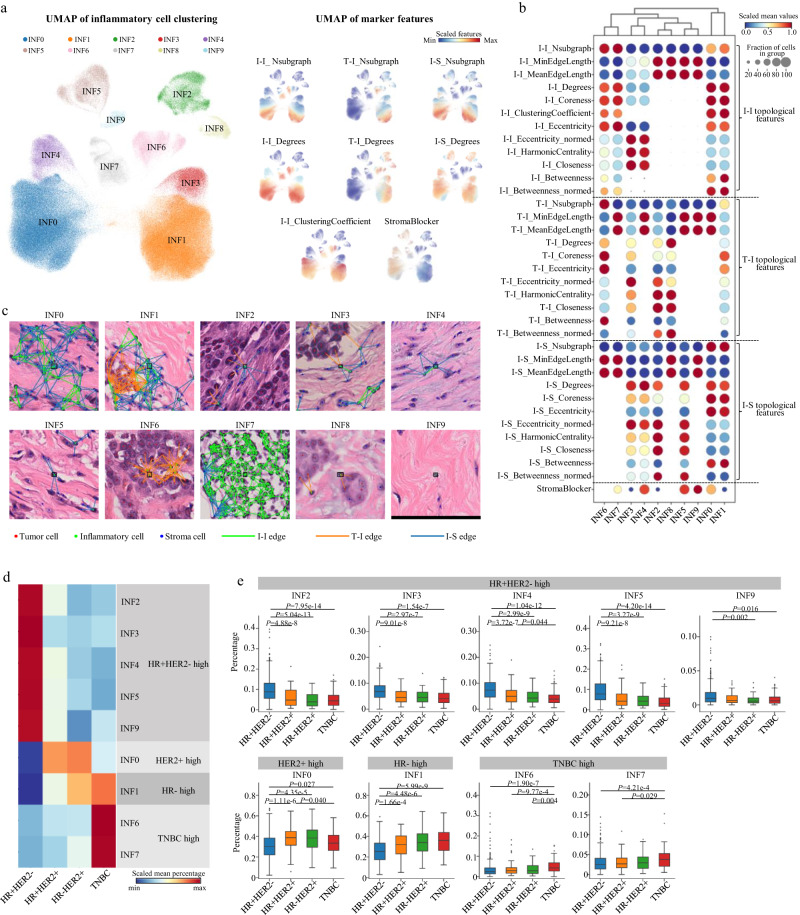
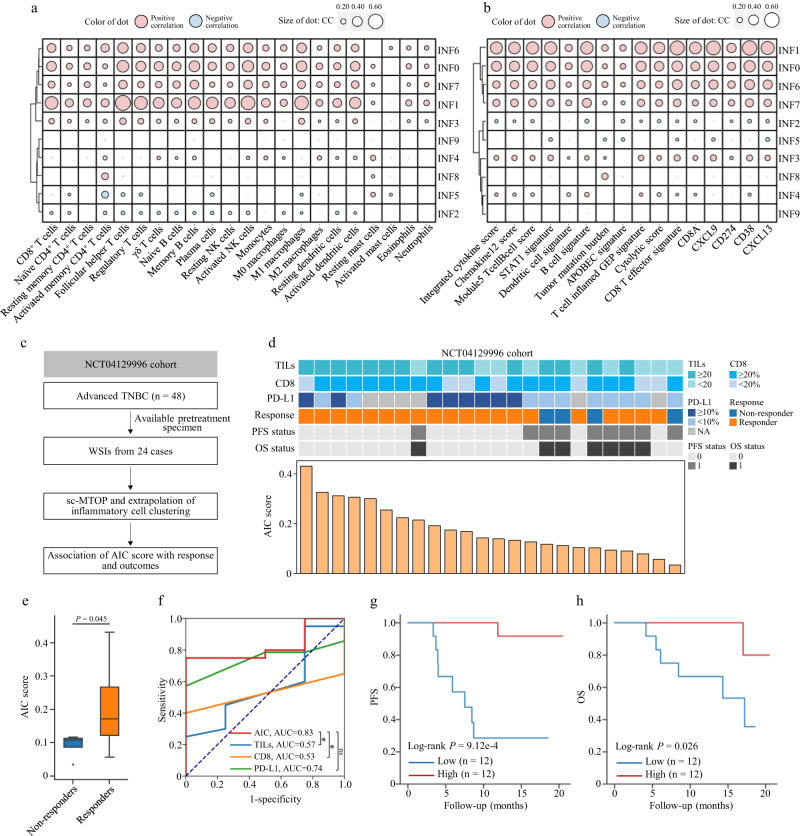
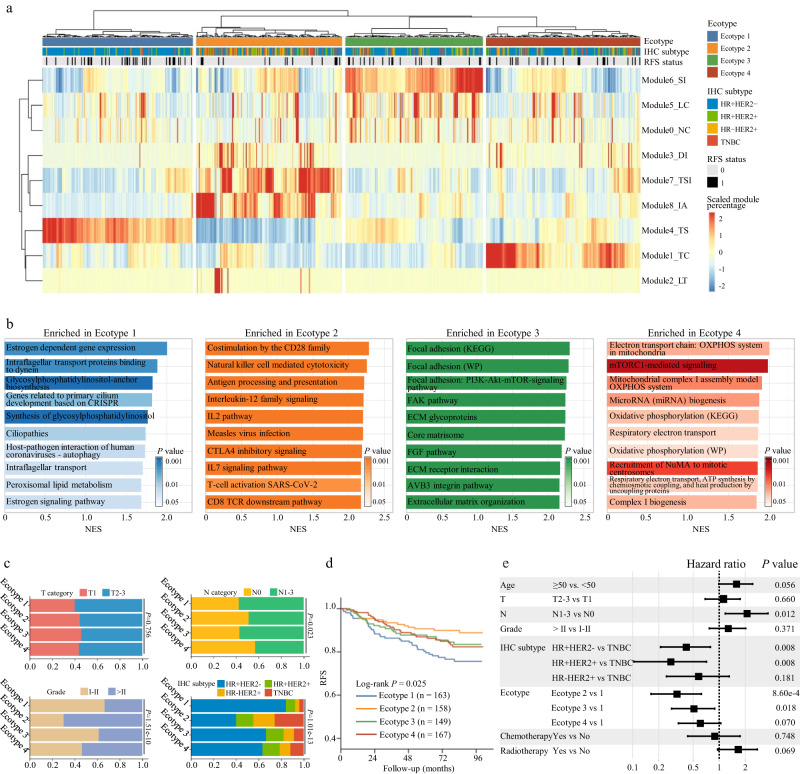
Digital pathology allows computerized analysis of tumor ecosystem using whole slide images (WSIs). Here, we present single-cell morphological and topological profiling (sc-MTOP) to characterize tumor ecosystem by extracting the features of nuclear morphology and intercellular spatial relationship for individual cells. We construct a single-cell atlas comprising 410 million cells from 637 breast cancer WSIs and dissect the phenotypic diversity within tumor, inflammatory and stroma cells respectively. Spatially-resolved analysis identifies recurrent micro-ecological modules representing locoregional multicellular structures and reveals four breast cancer ecotypes correlating with distinct molecular features and patient prognosis. Further analysis with multiomics data uncovers clinically relevant ecosystem features. High abundance of locally-aggregated inflammatory cells indicates immune-activated tumor microenvironment and favorable immunotherapy response in triple-negative breast cancers. Morphological intratumor heterogeneity of tumor nuclei correlates with cell cycle pathway activation and CDK inhibitors responsiveness in hormone receptor-positive cases. sc-MTOP enables using WSIs to characterize tumor ecosystems at the single-cell level.


Conflict of interest statement

The authors declare no competing interests.

Figures

Fig. 1
Fig. 1. Single-cell morphological and topological profiling and the generated dataset.
a Schematic diagram of single-cell morphological and topological profiling (sc-MTOP). It first employs Hover-Net to implement nuclear segmentation and classification on WSIs. Then, for individual cells, nuclear morphological, texture and topological features are extracted based on the nuclear contour and the intercellular spatial relationship. Created with BioRender.com. b Schematic diagram of multilevel pairwise graph method to model the spatial relationship of cells within the same and across cell types (taking a tumor cell as an example). T, I and S denote tumor, inflammatory and stroma cell respectively. Created with BioRender.com. c Cohort information about the cell composition of whole slide images and patients’ clinical and multiomics data. Each column represents a patient. d Cell composition of the entire sc-MTOP dataset. e Cell composition according to the breast cancer IHC subtypes (HR+HER2-: n = 405; HR+HER2+: n = 85; HR-HER2+: n = 66; TNBC: n = 81). P value is calculated using the chi-square test. f Boxplots of the percentage of tumor, inflammatory, stroma and normal cells of WSIs according to the breast cancer IHC subtypes (HR+HER2-: n = 405; HR+HER2+: n = 85; HR-HER2+: n = 66; TNBC: n = 81). The center lines of boxplots indicate the median values; box limits show upper and lower quartiles; whiskers extend from box limits to the farthest data point within 1.5 × interquartile range; points beyond whiskers are outliers. P values are calculated using the two-sided Mann-Whitney U test with false discovery rate-correction for multiple testing. sc-MTOP single-cell morphological and topological profiling; IHC immunohistochemistry; WES whole-exome sequencing; CNA copy number alteration.
Fig. 2
Fig. 2. Single-cell atlas of inflammatory cells.
a UMAP plot of unsupervised clustering results of 329,572 inflammatory cells sampled from 637 breast cancer whole slide images. The scaled values of selected features are shown on the right. b Dotplot of topological features according to the inflammatory cell clusters. The scaled mean values within each cluster (visualized by dot color) and the fraction of cells with positive values in the cluster (visualized by dot size) are shown. Note: If a cell is not connected to any other cells in a certain graph, the edge length-related features (MinEdgeLength and MeanEdgeLength) are set to 100 (pixel) which is the upper limit of distance between two connected cells. c Local nuclear graph visualization of the inflammatory cells of different clusters. A representative cell of each cluster is shown in the center of the images with a black bounding box. The edges between inflammatory and inflammatory cells (I-I edges), between tumor and inflammatory cells (T-I edges) and between inflammatory and stroma cells (I-S edges) are shown. Scale bar: 100 μm. d Comparison of the abundance of inflammatory cell clusters among the breast cancer IHC subtypes. Heatmap shows the scaled mean percentage of inflammatory cell clusters that are significantly different among the IHC subtypes. e Boxplots of the percentage of inflammatory cell clusters according to the IHC subtypes (HR+HER2-: n = 405; HR+HER2+: n = 85; HR-HER2+: n = 66; TNBC: n = 81). The center lines of boxplots indicate the median values; box limits show upper and lower quartiles; whiskers extend from box limits to the farthest data point within 1.5 × interquartile range; points beyond whiskers are outliers. P values are calculated using the two-sided Mann-Whitney U test with false discovery rate-correction for multiple testing.
Fig. 3
Fig. 3. Abundance of locally aggregated inflammatory cells indicates immunotherapy response.
Correlation between the abundance of inflammatory cell clusters and a abundance of microenvironment immune cells and b biomarkers indicating favorable immunotherapy response reported in the previous studies. Two-sided Spearman correlation analysis is performed with P values corrected for multiple testing. Red/blue dots represent positive/negative correlation respectively. The size of the dots is proportional to the Spearman correlation coefficient. The outlined dots indicate false discovery rate corrected P values < 0.05. Rows are ordered by hierarchical clustering. c Diagram of using the NCT04129996 cohort to investigate the association between the abundance of aggregated inflammatory cells and immunotherapy response. d NCT04129996 cohort information in TILs, CD8 IHC score, PD-L1 IHC score, treatment response, PFS status, OS status and AIC score. e Comparison of AIC score between the responders (patients who achieved objective response, n = 20) and non-responders (n = 4). The center lines of boxplots indicate the median values; box limits show upper and lower quartiles; whiskers extend from box limits to the farthest data point within 1.5 × interquartile range; points beyond whiskers are outliers. P value is calculated using the two-sided Mann-Whitney U test. f Receiver operating characteristic curves for using the AIC score, TILs, CD8 IHC score and PD-L1 IHC score to identify the responders. P values for the comparison of AUC are calculated using the two-sided bootstrap test (AIC score vs. TILs: P = 0.022; AIC score vs. CD8 IHC score: P = 0.012; AIC score vs. PD-L1 IHC score: P = 0.455). *P < 0.05; ns, not significant. g, h Kaplan–Meier curves of progression-free survival and overall survival of patients with high- and low-AIC score in the NCT04129996 cohort. CC correlation coefficient, AIC score aggregated inflammatory cell abundance score, TILs tumor-infiltrating lymphocytes, AUC area under the curve, PFS progression-free survival, OS overall survival.
Fig. 4
Fig. 4. Single-cell atlas of tumor cells and stroma cells.
a UMAP plot of unsupervised clustering results of 963,226 tumor cells sampled from 637 breast cancer whole slide images. The scaled values of selected features are shown on the right. b Dotplot of features according to the tumor cell clusters. The scaled mean values within each cluster (visualized by dot color) and the fraction of cells with positive values in the cluster (visualized by dot size) are shown. Note: If a cell is not connected to any other cells in a certain graph, the edge length-related features (MinEdgeLength and MeanEdgeLength) are set to 100 (pixel) which is the upper limit of distance between two connected cells. c Local nuclear graph visualization of the tumor cells of different clusters. A representative cell of each cluster is shown in center of the images with a black bounding box. The edges between tumor and tumor cells (T-T edges), between tumor and inflammatory cells (T-I edges), and between tumor and stroma cells (T-S edges) are shown. Scale bar: 100 μm. d UMAP plot of unsupervised clustering results of 705,367 stroma cells sampled from 637 breast cancer whole slide images. The scaled values of selected features are shown on the right. e Dotplot of features according to the stroma cell clusters. The scaled mean values within each cluster (visualized by dot color) and the fraction of cells with positive values in the cluster (visualized by dot size) are shown. f Local nuclear graph visualization of the stroma cells of different clusters. A representative cell of each cluster is shown in center of the images with a black bounding box. The edges between stroma and stroma cells (S-S edges), between tumor and stroma cells (T-S edges) and between inflammatory and stroma cells (I-S edges) are shown. Scale bar: 100 μm.
Fig. 5
Fig. 5. Morphological intratumor heterogeneity of tumor nuclei indicates cell cycle pathway activity and CDK inhibitor response in HR+breast cancer.
a Calculation of MITH. Created with BioRender.com. b Representative local images of high- and low-MITH tumors. Scale bar: 200 μm. c Correlation between MITH and genetic intratumor heterogeneity. Fitted linear regression line is shown. Two-sided Spearman correlation analysis is performed. d Association between MITH and clinicopathological features. P values are calculated using the two-sided Mann-Whitney U test. e Gene sets enriched in high-MITH samples in HR+ breast cancers revealed by GSEA. Cell cycle-related gene sets are marked in red. The NES and FDR output by GSEA are presented. f Comparison of Ki-67 index and MGPS between high- and low-MITH samples in HR+ breast cancers. P values are calculated using the two-sided Mann-Whitney U test. g Diagram depicting how Cyclin D/CDK4/6 and Cyclin E/CDK2 regulate G1/S phase progression and activate transcription of E2F target genes. h Comparison of phospho-Rb (S807/811) IHC score between high- (n = 164) and low-MITH (n = 163) samples in HR+ breast cancers. Representative images of IHC staining are presented. Scale bar: 100 μm. P value is calculated using the two-sided Mann-Whitney U test. i Heatmap of the mRNA expression of CCND1, CCND2, CCND3, CDK4, CDK6, CCNE1, CCNE2, CDK2, E2F1, E2F2, E2F3 and E2F target signature score in HR+ breast cancers. Their correlation with MITH is indicated by bar plot on the right through two-sided Spearman correlation analysis. ***P < 0.001; *P < 0.05; ns, not significant. j Experiment design to evaluate CDK inhibitor response of PDOs stratified by MITH. Created with BioRender.com. k Relative viability of PDOs treated with 1 μM CDK4/6 inhibitor Abemaciclib and 0.4 μM CDK2/4/6 inhibitor PF-06873600 (High-MITH: n = 12; low-MITH: n = 9). P values are calculated using two-sided Mann–Whitney U test. For Fig. 5d, f, h and k, the center lines of boxplots indicate median values; box limits show upper and lower quartiles; whiskers extend from box limits to the farthest data point within 1.5 × interquartile range; points beyond whiskers are outliers. In Fig. 5e, f, h and k, high- and low-MITH subgroups are defined using the median MITH value (0.8798) of HR+ breast cancers. MITH morphological intratumor heterogeneity, CC correlation coefficient, NES normalized enrichment score, FDR false discovery rate, MGPS multigene proliferation score, IHC immunohistochemistry.
Fig. 6
Fig. 6. Recurrent micro-ecological modules characterize the spatial diversity of breast cancer ecosystem.
a Diagram for the identification of micro-ecological modules (MEMs). b Hierarchical clustering of spatial correlation matrix of tumor, inflammatory and stroma cell clusters identifies eight micro-ecological modules: i) Module1_TC, Module1 tumor core; ii) Module2_LT, Module2 loosely distributed tumor cells; iii) Module3_DI, Module3 discrete inflammatory cell infiltration; iv) Module4_TS, Module4 colocalization of tumor cells and stroma cells; v) Module5_LC, Module5 low cellularity; vi) Module6_SI, Module6 colocalization of stroma and inflammatory cells; vii) Module7_TSI, Module7 colocalization of tumor, stroma and inflammatory cells; viii) Module8_IA, Module8 local inflammatory cell aggregation. Rows and columns are ordered by hierarchical clustering. c Spatial patterns of MEMs based on Moran’s I statistics. d Heatmap of MEM scores of all spots. Spots (columns) are classified into the eight MEMs according to its maximum MEM score. Spots where all module scores are zero are classified as Module0_NC. e Thumbnail of a whole slide image with manually histological annotation (left) and with MEM mapping (right). In histological annotation, a pathologist manually delineated the regions of different histological patterns including two types of tumor regions (red and purple), stroma (blue), immune cell aggregation in stroma (green) and immune infiltration in tumor (yellow). Scale bar: 4 mm. f Composition of MEMs of different histological regions. g Mapping the spatial diversity of histological regions of immune infiltration, tumor and stroma based on MEMs. Scale bar: 200 μm. MEM micro-ecological module, ROI regions of interest.
Fig. 7
Fig. 7. Micro-ecological module-based breast cancer ecotypes associated with molecular features and patient prognosis.
a Hierarchical clustering of micro-ecological module composition identifies four breast cancer ecotypes. b Gene sets enriched in the samples of each ecotype revealed by gene sets enrichment analysis. The NES and P value output by GSEA are presented. c Association between breast cancer ecotypes and tumor T category, N category, grade and IHC subtypes. P values are calculated using the chi-square test. d Kaplan-Meier curves of recurrence-free survival according to the breast cancer ecotypes. e Multivariate Cox regression analysis reveals breast cancer ecotype as an independent prognostic factor of recurrence-free survival (n = 537). Squares and whiskers represent point estimates and the 95% confidence interval of hazard ratios. RFS recurrence-free survival, IHC immunohistochemistry, NES normalized enrichment score.
Fig. 8
Fig. 8. Summary of the present study.
Left panel: The analytic workflow of generating and using sc-MTOP data to dissect the ecosystem diversity of human breast cancer at multiple levels. Right panel: The ecosystem features with therapeutic and prognostic implications. Created with BioRender.com. sc-MTOP single-cell morphological and topological profiling, MEM micro-ecological module, AIC score aggregated inflammatory cell abundance score, MITH morphological intratumor heterogeneity.

References

    1. McAllister SS, Weinberg RA. Tumor-host interactions: a far-reaching relationship. J. Clin. Oncol. 2010;28:4022–4028. - PubMed
    1. Hanahan D, Weinberg RA. Hallmarks of cancer: the next generation. Cell. 2011;144:646–674. - PubMed
    1. Merlo LMF, Pepper JW, Reid BJ, Maley CC. Cancer as an evolutionary and ecological process. Nat. Rev. Cancer. 2006;6:924–935. - PubMed
    1. Salgado R, Loi S. Tumour infiltrating lymphocytes in breast cancer: increasing clinical relevance. Lancet Oncol. 2018;19:3–5. - PubMed
    1. Schmid P, et al. Atezolizumab and Nab-Paclitaxel in Advanced Triple-Negative Breast Cancer. N. Engl. J. Med. 2018;379:2108–2121. - PubMed

Publication types

Substances