. 2023 Oct 25;14(1):6777.
doi: 10.1038/s41467-023-42458-1.

Mutant p53 sustains serine-glycine synthesis and essential amino acids intake promoting breast cancer growth

Affiliations

Mutant p53 sustains serine-glycine synthesis and essential amino acids intake promoting breast cancer growth

Camilla Tombari et al. Nat Commun. .

Erratum in

Abstract

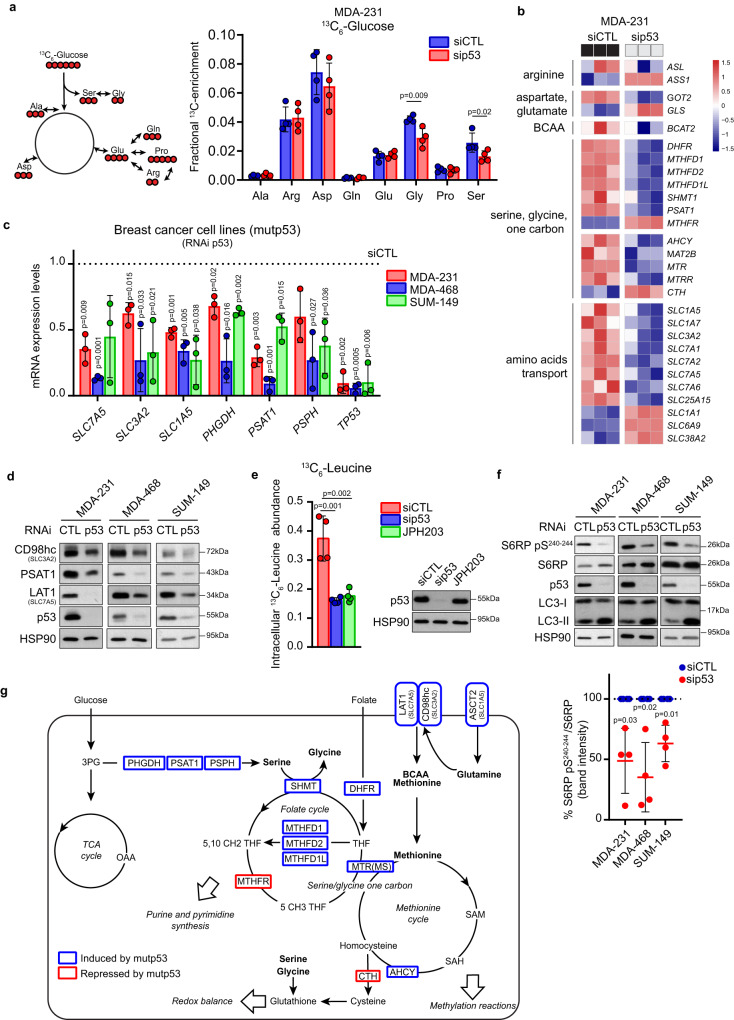
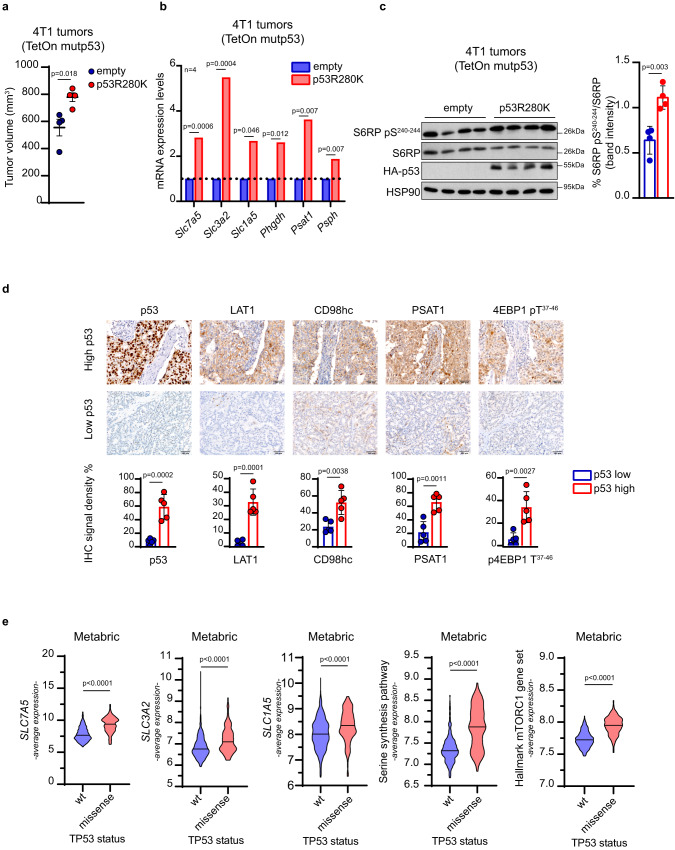
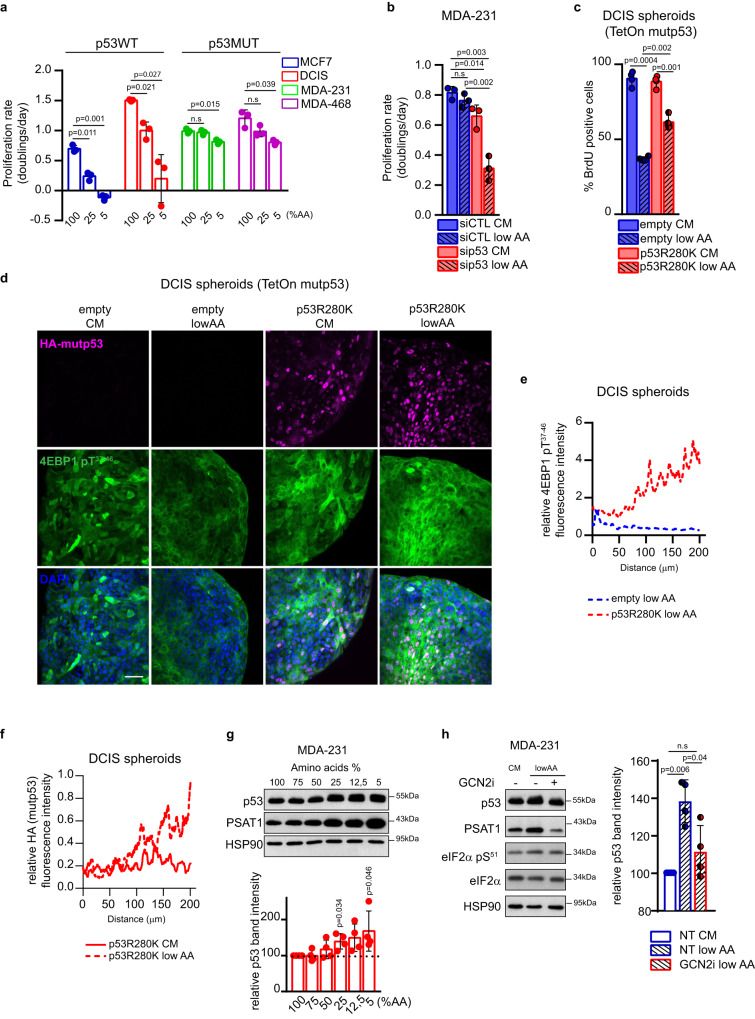
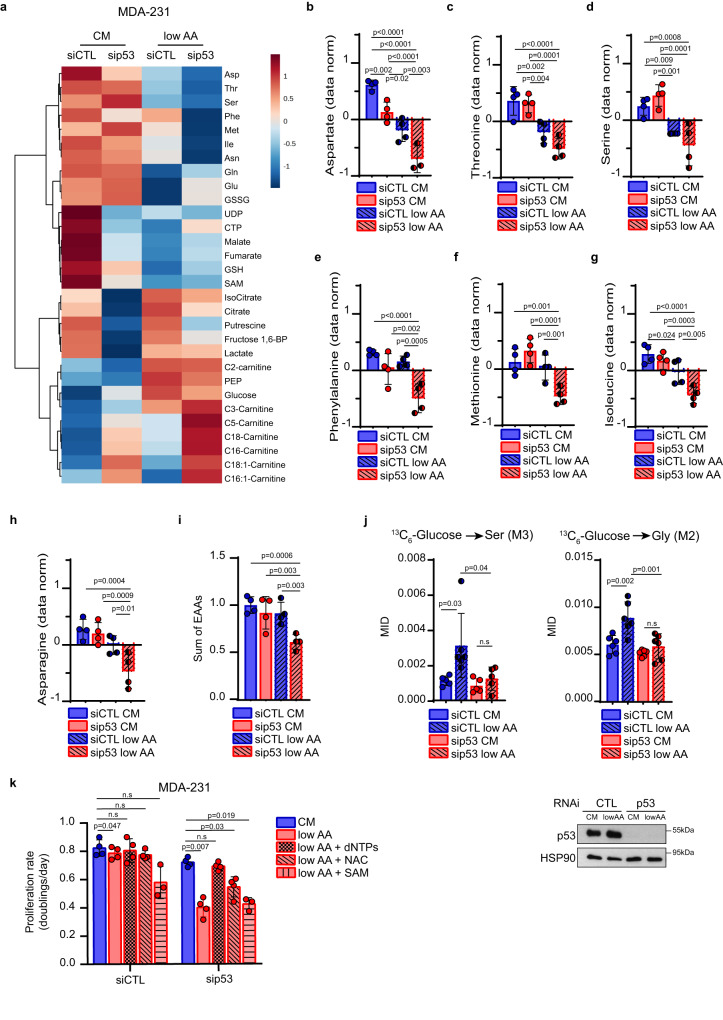
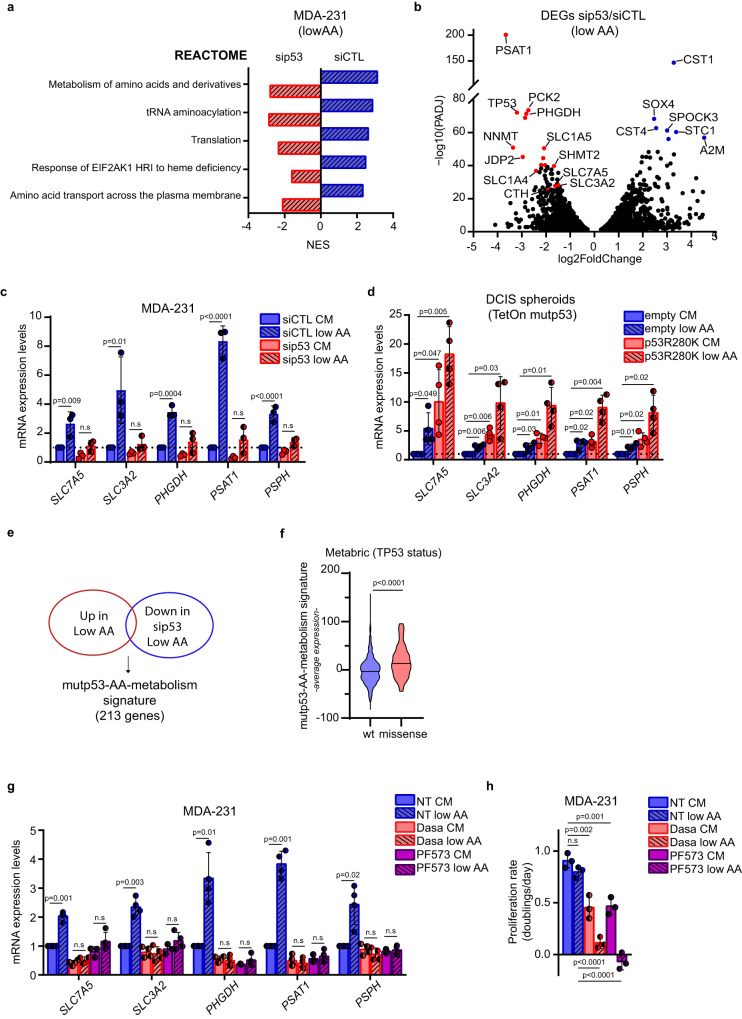
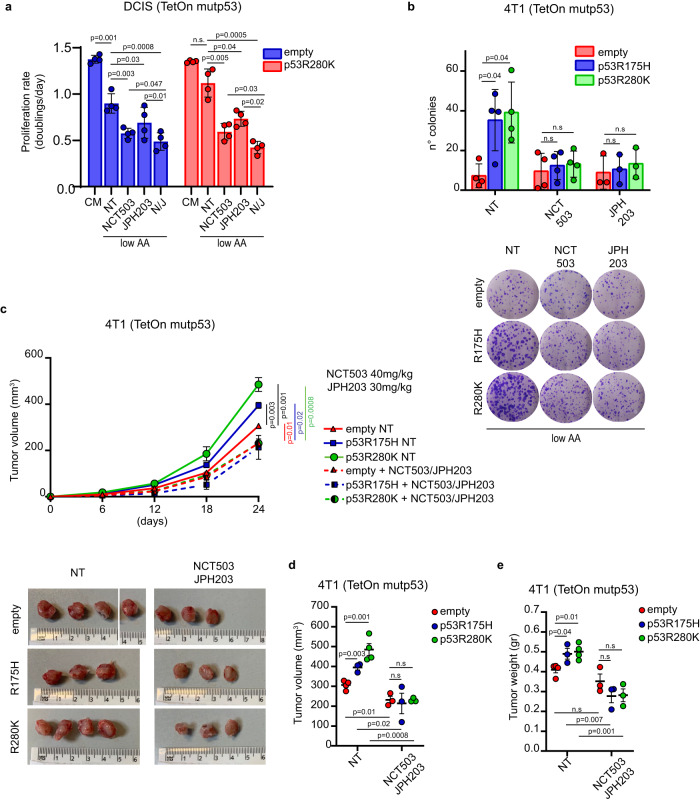
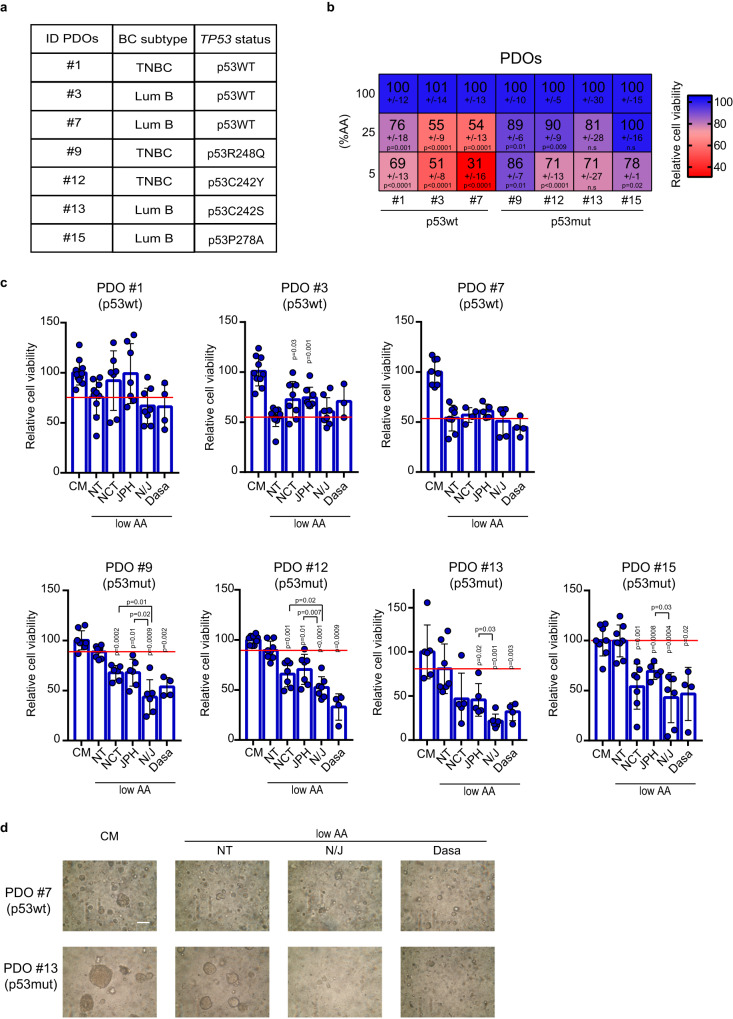
Reprogramming of amino acid metabolism, sustained by oncogenic signaling, is crucial for cancer cell survival under nutrient limitation. Here we discovered that missense mutant p53 oncoproteins stimulate de novo serine/glycine synthesis and essential amino acids intake, promoting breast cancer growth. Mechanistically, mutant p53, unlike the wild-type counterpart, induces the expression of serine-synthesis-pathway enzymes and L-type amino acid transporter 1 (LAT1)/CD98 heavy chain heterodimer. This effect is exacerbated by amino acid shortage, representing a mutant p53-dependent metabolic adaptive response. When cells suffer amino acids scarcity, mutant p53 protein is stabilized and induces metabolic alterations and an amino acid transcriptional program that sustain cancer cell proliferation. In patient-derived tumor organoids, pharmacological targeting of either serine-synthesis-pathway and LAT1-mediated transport synergizes with amino acid shortage in blunting mutant p53-dependent growth. These findings reveal vulnerabilities potentially exploitable for tackling breast tumors bearing missense TP53 mutations.


Conflict of interest statement

The authors declare no competing interests.

Figures

Fig. 1
Fig. 1. Mutp53 promotes a specific AA metabolic program.
a Left panel: scheme of glucose-derived AAs where glucose-derived carbons are indicated in red. Right panel: mass isotopomer distribution (MID) of AAs from [U-13C6]-glucose in MDA-MB 231 cells upon control (siCTL) or p53 (sip53) silencing (isotopomers displayed in the scheme are those reported in the graph). For labeling experiments, cells were transfected with control or p53 siRNAs on the day of seeding and cultivated for 24 h followed by incubation with [U-13C6]-glucose in the medium for additional 24 h; n = 4 biological replicates. b Heatmap of RNA-seq data of genes related to AA biosynthesis, intake, and metabolism in MDA-MB 231 cells upon control (siCTL) or p53 (sip53) silencing. Three columns for each condition represent n = 3 biological replicates. c qRT-PCR analysis of indicated genes in MDA-MB 231, MDA-MB 468, and SUM-149 cells upon silencing of p53. mRNA levels relative to control condition (dotted line) are shown; n = 3 biological replicates. d Western blot analysis of indicated proteins in MDA-MB 231, MDA-MB 468, and SUM-149 cells upon silencing of p53. CD98hc is encoded by SLC3A2 and LAT1 by SLC7A5. HSP90 was used as loading control; n = 3. e Left panel: intracellular level of 13C6-Leucine (Mass isotopomer distribution (MID) of M6 Leucine) in MDA-MB 231 cells upon control (siCTL) or p53 (sip53) silencing and treated with 10 μM JPH203 (LAT1i) as a positive control. Right panel: western blot analysis of p53 levels in the above-described condition. HSP90 was used as loading control; n = 4 biological replicates. f Upper panel: western blot analysis of indicated proteins in MDA-MB 231, MDA-MB 468, and SUM-149 cells upon silencing of p53. HSP90 was used as loading control. Lower panel: quantification of depicted western blot bands expressed as percentage of S6RP pS240-244 relative to S6RP; n = 4 biological replicates. g Schematic overview of genes encoding for AA enzymes and transporters downregulated (blue) and upregulated (red) upon silencing of mutp53. Graph bars represent mean±s.d. Two-tailed Student’s t-test or Exact test p-value (FDR) cutoff 0.05. Source data are provided as a Source Data file.
Fig. 2
Fig. 2. BCs with mutp53 express higher levels of SSP enzymes, LAT1, and mTORC1 activation.
a Quantification of tumor volume in mice injected with indicated 4T1 TetOn inducible clones at day 24; n = 4/condition. b qRT-PCR analysis of the indicated genes in 4T1 TetOn clones used in (a); n = 4/condition. c Left panel: western blot analysis of the indicated proteins in lysates of tumor samples from (a). HSP90 was used as loading control. Right panel: quantification of depicted western blot bands expressed as percentage of S6RP pS240-244 relative to S6RP. In vivo data (a) are shown as mean ± SE. In scatter dot plots, each dot represents one mouse. Graph bars in b represent mean of n = 4 mice per group. Graph bars in c represent mean ± s.d. n = 4 mice per group. d Upper panels: representative images of immunohistochemical (IHC) analysis of 10 breast cancer samples stratified on the basis of p53 protein levels (high and low) (n = 5 for each condition). Samples were stained with anti-p53, anti-PSAT1, anti-LAT1, anti-CD98hc, and anti-Phospho-4EBP1 antibodies. CD98hc is encoded by SLC3A2 and LAT1 by SLC7A5. Original magnification, x200. Scale bar, 100 µm. Lower panels: quantitative analyses of IHC markers analyzed. e Average expression levels of SLC7A5, SLC3A2, SLC1A5, SSP genes (i.e., PHGDH, PSAT1, and PSPH), and a gene set of mTORC1 activation in human breast cancer samples of the Metabric dataset (n = 701) classified according to p53 status (wt and missense TP53 mutations). Two-tailed Student’s t-test. Source data are provided as a Source Data file.
Fig. 3
Fig. 3. Mutp53 enables cancer cells to cope with AA restriction.
a Proliferation rate (doubling times/day) of indicated cell lines in medium containing 100%, 25%, and 5% of AAs for 3 days; n = 3 biological replicates. b Proliferation rate (doublings /day) of MDA-MB 231 cells cultured in complete medium (CM) or medium containing 25% of AAs (low AA) upon silencing of p53 for 3 days; n = 3 biological replicates. c BrdU incorporation analysis in indicated MCF10DCIS.COM TetOn inducible spheroids grown in complete medium (CM) or medium containing 25% of AAs (low AA), in presence of doxycycline 1 μg/mL for 72 h. BrdU was added 12 h before harvesting. The percentage of BrdU positive cells in 900 nuclei/spheroid is shown; n = 4 biological replicates. d Immunofluorescence analysis of HA-mutp53 and p4EBP1 in MCF10DCIS.COM spheroids maintained for 72 h in complete medium (CM) or medium containing 25% of AAs (low AA) upon overexpression of mutp53 R280K (in presence of doxycycline 1 μg/mL for 72 h); n = 4 biological replicates. Scale bar 40 μm. e Quantification of the relative fluorescence intensity profile of p4EBP1, normalized according to nuclei staining (DAPI). f. Quantification of the relative fluorescence intensity profile of HA-mutp53, normalized according to nuclei staining (DAPI). g Upper panel: western blot analysis of the indicated proteins in MDA-MB 231 cells grown for 72 h in the indicated percentage of AAs. Lower panel: quantification of p53 levels relative to HSP90 in western blot; n = 4 h Left panel: western blot analysis of the indicated proteins in MDA-MB 231 cells grown for 72 h in complete medium (CM) and in medium containing 25% of AAs (low AA) with (+) or without (-) GCN2i 1 μM for 72 h. Right panel: quantification of p53 levels relative to HSP90 in western blot; n = 4 biological replicates. Graph bars represent mean±s.d. Two-tailed Student’s t-test. Source data are provided as a Source Data file.
Fig. 4
Fig. 4. Mutp53 reprograms AA metabolism in AA restriction to sustain proliferation.
a Heatmap of top 30 significantly regulated metabolites analyzed by steady-state metabolomic analysis in MDA-MB 231 cells cultured for 3 days in complete medium (CM) or medium containing 25% of AAs (low AA) upon control (siCTL) or p53 (sip53) silencing. Each column represents the average of each experimental group; n = 4 independent replicates (one single experiment). b–h Histograms showing the normalized abundance of top 7 regulated AAs emerged from a. n = 4 independent replicates (one single experiment). i Histogram showing the sum of EAAs (normalized values of Val, Thr, Leu, Ile, Met, His, Phe, Trp, Lys) from LC-MS analysis. n = 4 independent replicates (one single experiment). j Upper panels: mass isotopomer distribution (MID) of serine M3 (left) and glycine M2 (right) from [U-13C6]-Glucose in MDA-MB 231 cells under above-described conditions. For labeling experiments, [U-13C6]-Glucose was added in the medium 24 h before harvesting. Lower panel: western blot analysis of p53 levels in the above-described condition. HSP90 was used as loading control; n = 6 biological replicates. k Proliferation rate (doublings/day) of MDA-MB 231 cells cultured in complete medium (CM) or medium containing 25% of AAs (low AA) upon silencing of p53 for 3 days and, where indicated, supplemented with dNTPs 100 μM, N-Acetylcysteine (NAC) 1.25 mM and S-adenosylmethionine (SAM) 200 μM; n = 4 (n = 3 in low AA + SAM) biological replicates. Two-tailed Student’s t-test or Ordinary one-way ANOVA test (Fisher’s LSD). Source data are provided as a Source Data file.
Fig. 5
Fig. 5. Mutp53 controls a specific AA metabolic transcriptional program in AA restriction.
a. Blue bars: reactome gene sets significantly enriched (padj value < 0.05) in control-silencing MDA-MB-231 cells (siCTL) cultured in low AA vs complete medium. Red bars: reactome gene sets significantly enriched (padj value < 0.05) in MDA-MB-231 cells cultured in low AA upon p53 silencing (sip53) vs low AA upon control silencing. The positive and negative normalized enrichment score (NES) indicates the degree to which Reactome gene sets are overrepresented in the conditions described above. n = 2 biological replicates (GSE214494). b Volcano plot of genes significantly upregulated (blue dots) and downregulated (red dots) (padj value < 0.05) in MDA-MB-231 cells cultured in low AA upon p53 silencing vs low AA upon control silencing (sip53/siCTL). n = 2 biological replicates. c qRT-PCR of indicated genes in MDA-MB 231 cells cultivated for 72 h in complete medium (CM) or medium containing 25% of AAs (low AA) upon silencing of p53. mRNA levels relative to control condition (dotted line) are shown; n = 3 biological replicates. d qRT-PCR of indicated genes in MCF10DCIS.COM TetOn inducible spheroids grown in complete medium (CM) or medium containing 25% of AAs (low AA), in presence of doxycycline 1 μg/mL for 72 h. mRNA levels relative to control condition (dotted line) are shown; n = 4 biological replicates. e Venn Diagram depicting common genes significantly upregulated (padj value < 0.05) in MDA-MB-231 siCTL cells when cultured in low AA and significantly downregulated upon silencing of p53 in low AA. f Average expression levels of mutp53-AA-metabolism signature in human BC samples of the Metabric dataset (n = 701) classified according to p53 status. g qRT-PCR of the indicated genes in MDA-MB 231 cells cultured in complete medium (CM) or medium containing 25% AAs (low AA) and treated with DMSO (NT), Dasatinib (Dasa) 0,5 μM or PF573228 (PF573) 10 μM for 72 h. mRNA levels relative to untreated condition in complete medium (NT CM) are shown; n = 4 biological replicates. h Proliferation rate (doublings/day) of MDA-MB 231 cells cultured as in g; n = 3 biological replicates. Graph bars represent mean±s.d. Two-tailed Student’s t-test or Ordinary one-way ANOVA test or Wilcoxon Rank Sum test or Wald test (pval) and bonferroni correction (padj). Cutoff padj<0.05. Source data are provided as a Source Data file.
Fig. 6
Fig. 6. LAT1 and SSP inhibition dampens mutp53-dependent tumor growth.
a Proliferation rate (doubling times/day) of MCF10DCIS.COM TetOn inducible clones cultured in complete medium (CM) or medium containing 25% of AAs (low AA) in presence of doxycycline 1 μg/mL for 72 h and treated with DMSO (NT), NCT-503 10 μM, JPH203 10 μM or combination of NCT503 10μM-JPH203 10 μM (N/J); n = 4 biological replicates. b Upper panel: quantification of the number of colonies formed by the indicated 4T1 TetOn inducible clones grown in medium containing 25% AAs (low AA) in presence of doxycycline 1 μg/mL, treated with DMSO (NT), NCT-503 1 μM or JPH203 1μ. Lower panel: representative images of colonies described above; n = 4 (n = 3 in JPH203) biological replicates. c Upper panel: tumor growth rate in mice after injection of indicated 4T1 TetOn inducible clones upon treatment with placebo (NT) or combination of NCT503/JPH203. Lower panel: images of tumors on day 24 after injection. n = 3/condition except for n = 4 in empty NT and p53R280K NT. d, e Quantification of difference in tumor volume and weight at day 24 after injection of the above-described tumors. n = 3/condition except for n = 4 in empty NT and p53R280K NT. Graph bars (a, b) represent mean±s.d. In vivo data (ce) are shown as mean ± SE. In scatter dot plots, each dot represents one mouse. Two-tailed Student’s t-test. Source data are provided as a Source Data file.
Fig. 7
Fig. 7. Viability of mutp53-bearing tumor organoids in AA restriction is dampened by inhibition of SSP/LAT1 or mechanosignaling.
a Table depicting PDOs ID, BC subtype, and TP53 status. b Heatmap showing relative viability percentage of patient-derived BC organoids grown in medium containing 100%, 25%, or 5% AAs. Data are normalized to complete medium (100%) and expressed as mean±s.d. of n = 3 experiments with at least 2 independent replicates each. P values are calculated vs complete medium (100%). c Quantification of relative viability percentage of patient-derived BC organoids grown in complete medium (CM) or in medium containing 25% AAs (low AA) and treated with DMSO (NT), NCT-503 10 μM, JPH203 10 μM, combination of NCT503 10 μM-JPH203 10 μM (N/J), Dasatinib (Dasa) 100 nM for 7 days. At the endpoint, organoids were quantified using Cell Titre Glo reagent. Data are normalized to control treatment (CM). Graph bars represent mean±s.d. of n = 3 (NCT503 10 μM-JPH203 10 μM; N/J) and n = 2 (Dasatinib) experiments with at least 2 independent replicates each (individual replicates are shown). P values above each bar are calculated vs medium containing 25% AAs (low AA) and treated with DMSO (NT) (red line). P values calculated comparing specific conditions are indicated using square brackets. d Representative images of one wtp53-expressing PDO (#7) and one mutp53-expressing PDO (#13), grown in complete medium (CM) or in medium containing 25% AAs (low AA), treated with DMSO (NT), combination of NCT503 10 μM-JPH203 10 μM (N/J) or Dasatinib (Dasa). Scale bar 50 μm. Two-tailed Student’s t-test. Source data are provided as a Source Data file.

Similar articles

Cited by

References

    1. Vander Heiden MG, DeBerardinis RJ. Understanding the Intersections between Metabolism and Cancer Biology. Cell. 2017;168:657–669. doi: 10.1016/j.cell.2016.12.039. - DOI - PMC - PubMed
    1. Martínez-Reyes I, Chandel NS. Cancer metabolism: looking forward. Nat. Rev. Cancer. 2021;21:669–680. doi: 10.1038/s41568-021-00378-6. - DOI - PubMed
    1. Gaude E, Frezza C. Tissue-specific and convergent metabolic transformation of cancer correlates with metastatic potential and patient survival. Nat. Commun. 2016;7:13041. doi: 10.1038/ncomms13041. - DOI - PMC - PubMed
    1. Sullivan MR, et al. Quantification of microenvironmental metabolites in murine cancers reveals determinants of tumor nutrient availability. Elife. 2019;8:e44235. doi: 10.7554/eLife.44235. - DOI - PMC - PubMed
    1. Pathria G, Ronai ZA. Harnessing the Co-vulnerabilities of Amino Acid-Restricted Cancers. Cell Metab. 2021;33:9–20. doi: 10.1016/j.cmet.2020.12.009. - DOI - PMC - PubMed

Publication types