. 2023 Oct 25;14(1):6537.
doi: 10.1038/s41467-023-42077-w.

Presynaptic gating of monkey proprioceptive signals for proper motor action

Affiliations

Presynaptic gating of monkey proprioceptive signals for proper motor action

Saeka Tomatsu et al. Nat Commun. .

Abstract

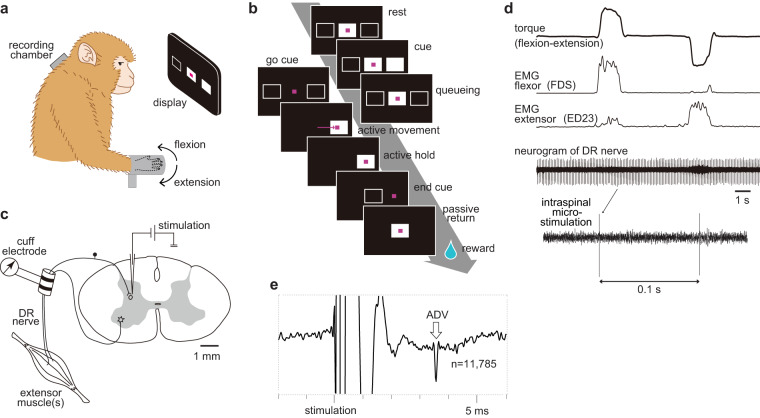
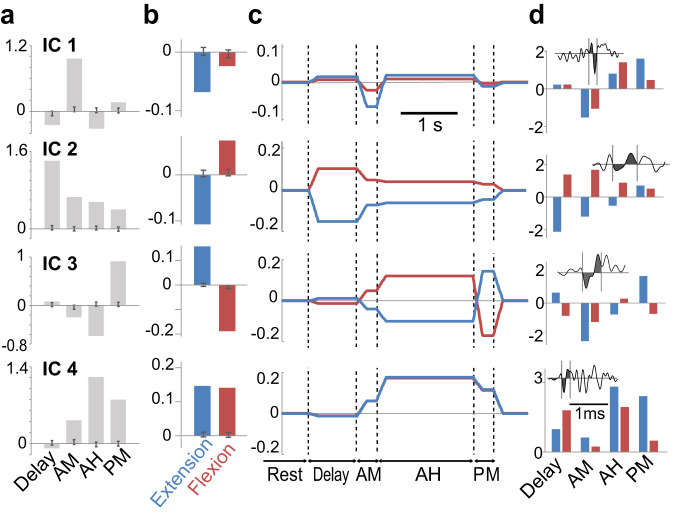
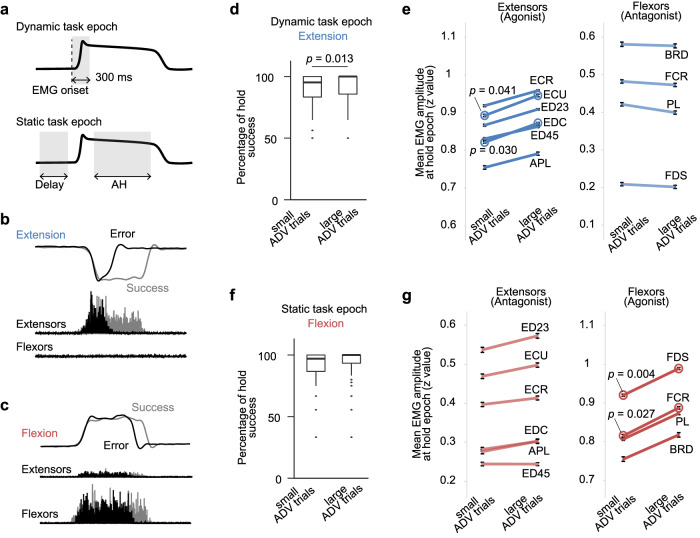
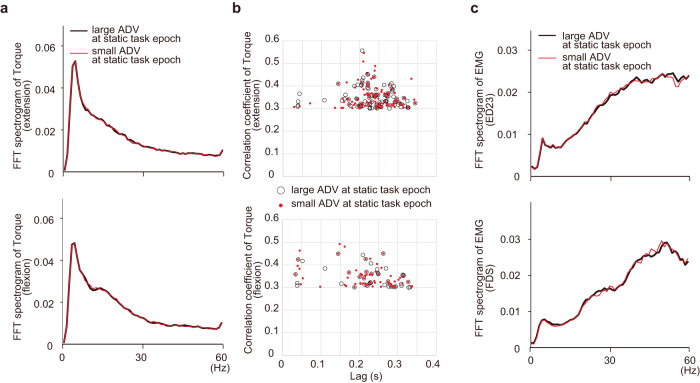
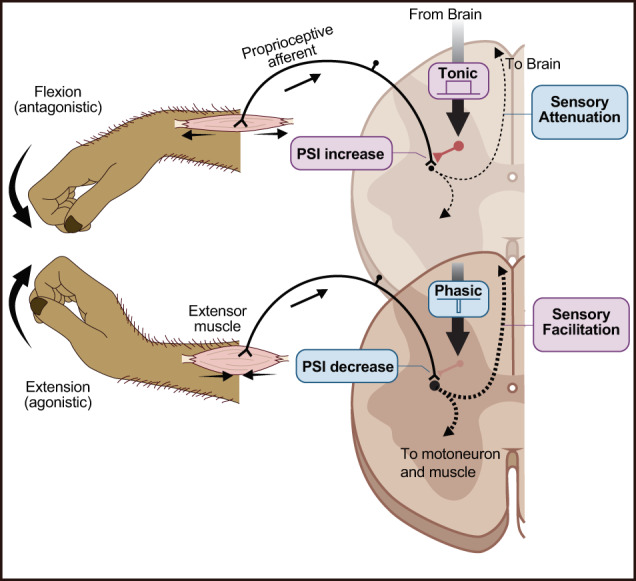
Our rich behavioural repertoire is supported by complicated synaptic connectivity in the central nervous system, which must be modulated to prevent behavioural control from being overwhelmed. For this modulation, presynaptic inhibition is an efficient mechanism because it can gate specific synaptic input without interfering with main circuit operations. Previously, we reported the task-dependent presynaptic inhibition of the cutaneous afferent input to the spinal cord in behaving monkeys. Here, we report presynaptic inhibition of the proprioceptive afferent input. We found that the input from shortened muscles is transiently facilitated, whereas that from lengthened muscles is persistently reduced. This presynaptic inhibition could be generated by cortical signals because it started before movement onset, and its size was correlated with the performance of stable motor output. Our findings demonstrate that presynaptic inhibition acts as a dynamic filter of proprioceptive signals, enabling the integration of task-relevant signals into spinal circuits.


Conflict of interest statement

The authors declare no competing interests.

Figures

Fig. 1
Fig. 1. Experimental setup and examples of antidromic volleys.
a Monkey with a recording chamber on the cervical spinal cord performing the movement task with visual cues. Adapted with permission of Kazuhiko Seki, from Principles of Neural Science, Kandel, Erik R, 5th Edition, 2013; permission conveyed through Copyright Clearance Center, Inc. b Task sequence for an extension trial. Magenta cursor, feedback of wrist torque. c Electrophysiological recording setup. d An example of wrist torque (upwards reflects flexion), electromyography (EMG) traces from a flexor and an extensor, and a neurogram from the deep radial (DR) nerve. ED23, extensor digitorum-2,3; FDS, flexor digitorum superficialis. e A typical example of antidromic volleys (ADVs, #17 in Supplementary Table 1).
Fig. 2
Fig. 2. Modulation of presynaptic inhibition during different task epochs.
a An illustration of the wrist torque and task epochs. Blue; extension. Red; flexion. The colour code is consistent for all panels. AM, Active Movement; AH, Active Hold; PM, Passive Return Movement. b Measurement of antidromic volley (ADV) area and its modulation during the movement task. Data from the same ADVs shown in Fig. 1e are displayed in this figure. Inset, ADVs obtained using all intra-spinal microstimulations (n = 11,785) while the monkeys performed the task. Prominent negative (rectangle) and positive (inverted rectangle) peaks were found and the onsets and offsets (vertical grey lines, baseline-crossing points) were detected. Grey-shaded areas indicate the area measured for the ADVs. Bottom left, and top and bottom right, Averaged ADV area modulation in different task epochs. Waveforms obtained with a global average (same as in inset) are overlayed in each panel (black). Vertical grey lines indicate the ranges of area calculation, with the same timing as shown in inset. The number of stimuli used for epoch averaging is shown for each waveform. c Density and box-whisker plots of the size of the ADVs (n = 77 ADVs) for each behavioural epoch. Black dots indicate the ADV elicited from an intraspinal site (site #58) where the activity of the first-order spinal neuron was successfully recorded as illustrated in (e and f). d Cumulative summation of the size of 77 ADVs. Black dots indicate the minimum value of each curve. e Raster plot and peristimulus time histogram of a single first-order spinal neuron to a deep radial (DR) afferent. Zero indicates the timing of stimulation. The peristimulus time histogram summarizes the firing profile of the neuron in response to stimulation, with a 0.5-ms bin. Grey area indicates the range calculated as the response probability of this neuron. f Peak area of the neuronal response shown in (e) in each behavioural epoch. P values are from two-tailed binomial tests compared with Rest with Bonferroni’s correction (correction size = 4). Source data are provided as a Source data file.
Fig. 3
Fig. 3. Independent component analysis and presumed modulation of presynaptic inhibition.
a Four independent components (ICs) for the behavioural modulation of antidromic volleys (ADVs). Dark grey vertical lines indicate confidence intervals calculated by bootstrap datasets (n = 1000 times). AH, Active Hold; AM, Active Movement; PM, Passive Return Movement. b Median value of the weight of each IC (mixing weight, n = 77 ADVs). Dark grey vertical lines indicate confidence intervals calculated by bootstrap datasets (n = 1000 times). c Presumed pattern of ADV modulation, illustrated based on the extracted ICs (a) and mixing weights (b). d Example of four ADVs exhibiting pattern modulation of their size across different behavioural epoch and their waveforms (inset). Source data are provided as a Source data file.
Fig. 4
Fig. 4. Temporal modulation of antidromic volleys (ADVs) by motor commands or their consequences.
ad Upper traces, averaged pre-processed electromyography (EMG) traces for the extensor digitorum-2,3 (ED23) in the extension trials (top) and the flexor digitorum superficialis (FDS) in the flexion trials (middle), and smoothed torque traces (bottom) from 30 successful extension (blue) and flexion (red) trials. Lower traces, average (n = 77 ADVs, circles and lines) and 95% confidence interval (shaded area) of normalized ADV area. P values are from two-tailed t-test compared with 0 (Rest) using Bonferroni’s correction (correction size = 11). Dotted lines indicate events for data alignment: onset of EMG burst (a), onset of torque (b), offset of EMG burst (c), and offset of wrist torque (d). Source data are provided as a Source data file.
Fig. 5
Fig. 5. Relationship between antidromic volley (ADV) modulation and task performance.
a Assessment windows (shaded areas) for computing the mean ADV area for each trial. b Sample error (black) and successful (grey) trials of wrist torque and EMG during extension movements. c Sample error (black) and successful (grey) trials of wrist torque and EMG during flexion movements. d Hold success ratio in the extension trials classified by the mean ADV in the dynamic task epoch. P value is from two-tailed paired t-test (n = 77 ADVs). e Means and standard errors of the EMG amplitude of individual wrist extensor and flexor muscles during the Active Hold (AH) epoch of extension trials classified by the mean ADV in the dynamic task epoch. Circle, p values are from two-tailed paired t-test between large and small ADV trials (n = 77 ADVs). APL, abductor pollicis longus; BRD, brachioradialis; ECR, extensor carpi radialis; ECU, extensor carpi ulnaris; ED23, extensor digitorum-2,3; ED45, extensor digitorum-4,5; EDC, extensor digitorum communis; FCR, flexor carpi radialis; FCU, flexor carpi ulnaris; FDS, flexor digitorum superficialis; PL, palmaris longus; PT, pronator teres. f Same as for panel d, but the data were from flexion trials classified by the mean ADV in the static task epoch. g Same as for panel (e), but the data were from flexion trials classified by the mean ADV in the static task epoch. dg are also illustrated in Supplementary Fig. 3. Source data are provided as a Source data file.
Fig. 6
Fig. 6. Relationship between antidromic volley (ADV) area and potential oscillatory motor output.
a Grand average of the power spectrogram (n = 77 ADVs) for wrist torque during extension (top) and flexion (bottom). The fast Fourier transformation (FFT) spectrogram for each trial was categorized by ADV area during the static task epoch and averaged for each ADV. Red and black lines, averages of the small and large ADV trials, respectively (n = 77 ADVs). The torque signals just after movement onset (0–1 s after movement onset) were analysed. A small peak in the range of physiological oscillations was noted (5–20 Hz), but there was no significant difference between the large and small trials at any frequency (two-tailed paired t-tests with Bonferroni’s correction, correction size = 60, n = 77 ADVs, ps > 0.05). b Lag and correlation coefficient of the second peak from the autocorrelation of wrist torque (0.3–1 s after movement onset). The second peaks were detected from trial-based autocorrelations, which were observed within 25–350 ms from lag 0 and whose correlation coefficients were >0.3. According to trial categorization, open black circles indicate that the data were obtained from large ADV trials and closed red circles indicate they were from small ADV trials. Only a few trials (<3.3%) showed second peaks. No significant differences were observed between the large and small ADV trials in mean lag or mean coefficient (two-tailed t-tests, extension, lag, p = 0.810, correlation coefficient, p = 0.611, df = 242 trials; flexion, lag, p = 0.180, correlation coefficient, p = 0.769, df = 111 trials). c Grand average of the power spectrogram for electromyography (EMG) traces (extensor digitorum-2,3 [ED23] and flexor digitorum superficialis [FDS]) calculated in the same way as in (a). No significant difference between trials was found at any frequency (two-tailed paired t-tests with Bonferroni’s correction, correction size = 60, n = 77 ADVs, ps > 0.05). Source data are provided as a Source data file.
Fig. 7
Fig. 7. A circuit model for gain modulation of proprioceptive afferent signals by presynaptic inhibition at the spinal cord during agonistic and antagonistic movement.
The gain of the proprioceptive afferent signal to the cervical spinal cord is modulated differentially depending on the role of the host muscles in the context of ongoing movements. For the wrist extensor muscle, wrist flexion is antagonistic, and extension is agonistic. During antagonistic movements (top), descending commands consistently facilitate primary afferent depolarization (PAD) at the afferent terminals, leading to an increase in presynaptic inhibition (PSI). As a result, the afferent-driven activity of first-order spinal interneurons, which project to either the ascending or reflex system, is attenuated, leading to sensory attenuation. In contrast, during agonistic movements (bottom), descending commands suppress PAD, resulting in a decrease in PSI. Consequently, the afferent-driven activity of first-order spinal interneurons is facilitated, leading to sensory facilitation. Created with BioRender.com.

Similar articles

Cited by

References

    1. Tuthill JC, Azim E. Proprioception. Curr. Biol. 2018;28:R194–R203. - PubMed
    1. Shadrach JL, Gomez-Frittelli J, Kaltschmidt JA. Proprioception revisited: where do we stand? Curr. Opin. Physiol. 2021;21:23–28. - PMC - PubMed
    1. Edin BB, Vallbo AB. Muscle afferent responses to isometric contractions and relaxations in humans. J. Neurophysiol. 1990;63:1307–1313. - PubMed
    1. Jones KE, Wessberg J, Vallbo AB. Directional tuning of human forearm muscle afferents during voluntary wrist movements. J. Physiol. 2001;536:635–647. - PMC - PubMed
    1. Jang IS, Jeong HJ, Katsurabayashi S, Akaike N. Functional roles of presynaptic GABA(A) receptors on glycinergic nerve terminals in the rat spinal cord. J. Physiol. 2002;541:423–434. - PMC - PubMed

Publication types