. 2023 Oct 25;14(1):6696.
doi: 10.1038/s41467-023-42283-6.

The endocannabinoid N-arachidonoyl dopamine is critical for hyperalgesia induced by chronic sleep disruption

Affiliations

The endocannabinoid N-arachidonoyl dopamine is critical for hyperalgesia induced by chronic sleep disruption

Weihua Ding et al. Nat Commun. .

Erratum in

Abstract

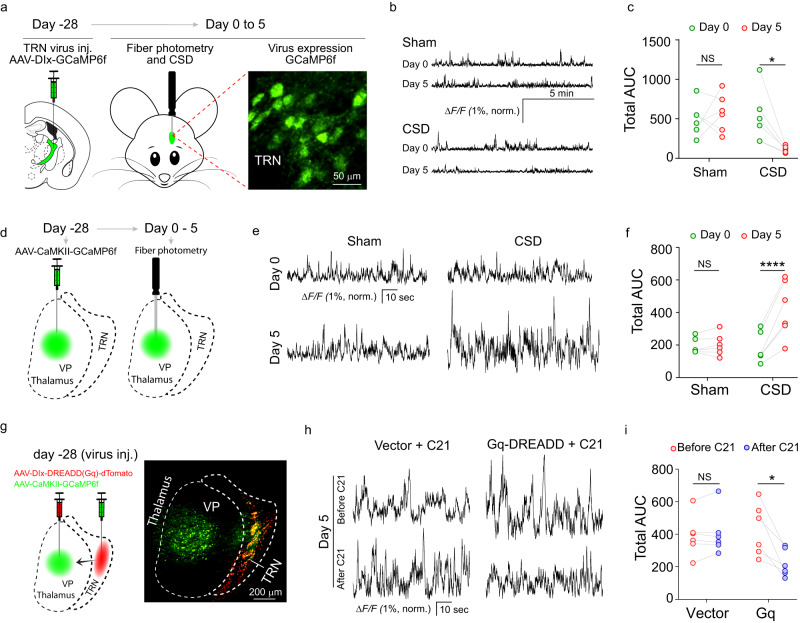
Chronic pain is highly prevalent and is linked to a broad range of comorbidities, including sleep disorders. Epidemiological and clinical evidence suggests that chronic sleep disruption (CSD) leads to heightened pain sensitivity, referred to as CSD-induced hyperalgesia. However, the underlying mechanisms are unclear. The thalamic reticular nucleus (TRN) has unique integrative functions in sensory processing, attention/arousal and sleep spindle generation. We report that the TRN played an important role in CSD-induced hyperalgesia in mice, through its projections to the ventroposterior region of the thalamus. Metabolomics revealed that the level of N-arachidonoyl dopamine (NADA), an endocannabinoid, was decreased in the TRN after CSD. Using a recently developed CB1 receptor (cannabinoid receptor 1) activity sensor with spatiotemporal resolution, CB1 receptor activity in the TRN was found to be decreased after CSD. Moreover, CSD-induced hyperalgesia was attenuated by local NADA administration to the TRN. Taken together, these results suggest that TRN NADA signaling is critical for CSD-induced hyperalgesia.


Conflict of interest statement

The authors declare no competing interests.

Figures

Fig. 1
Fig. 1. CSD induces hyperalgesia.
a Experimental diagram of the sleep deprivation experiment and behavioral testing. b Sample EEG recording using wireless EEG recording. Brown line-EEG trace. Gray line-EMG trace. A representative sleep attempt on EEG and EMG traces during sleep deprivation. Lower panel: time-frequency representation of an EEG signal (spectrogram) showing increased slow activity (0.5–4 Hz) during a manually detected sleep attempt. c Duration of non-REM sleep during the sleep deprivation session (7 am–1 pm; n = 4 mice; Day 0 vs day 1, 3, 5 p < 0.0001) and during the representative sleep opportunity period (1 pm–3 pm, Day 0 vs day 1 p = 0.0033; Day 0 vs day 3 p = 0.0002; Day 0 vs day 5 p < 0.0001). One-way ANOVA indicated a statistically significant difference. Tukey’s post hoc test. **p < 0.01, *** p < 0.001, ****p < 0.0001. d Total cumulative sleep time over 24 h (7 am-7 am; n = 3 mice; Day 0 vs day 5 p = 0.03). Two-sided paired t test, *p < 0.05. e Facial mechanical withdrawal threshold (Sham vs CSD at day 3 p = 0.0003, day 5 p = 0.0003), hindpaw mechanical withdrawal threshold (Sham vs CSD at day 3 p = 0.0039, day 5 p < 0.0001), and hindpaw thermal withdrawal latency (Sham vs CSD at day 3 p = 0.0003, day 5 p < 0.0001) at the indicated time points. Testing was performed within 1 h after the CSD session. (Sham n = 8 mice, CSD n = 16). Two-way ANOVA indicated that the differences in behavioral parameters between the two groups were statistically significant. The Bonferroni post hoc test indicated that the differences at the indicated time points were significant. Data are presented as mean ± SEM, **p < 0.01, ***p < 0.001, ****p < 0.0001. Source data are provided as a Source Data file. EEG electroencephalogram, EMG Electromyography, NREM non-rapid eye movement.
Fig. 2
Fig. 2. TRN is critical for CSD-induced hyperalgesia.
a, b Chemogenetic inhibition of the TRN promoted nociceptive behavior. a Experimental diagram of targeted TRN inhibition using AAV8-hDlx-Gi GREADD-dTomato or AAV8-hDlx-dTomato as a control. The images were tangential brain slices from a representative mouse to demonstrate dTomato expression in the TRN. This experiment was repeated independently three times with similar results. b Facial mechanical withdrawal threshold at the indicated time points post-C21 administration. (n = 8 mice, Vector+C21 vs Gi+C21 at 30 min p = 0.0206, 60 min p = 0.0055, 90 min p = 0.0015, 120 min p = 0.0342). Two-way ANOVA indicated that the differences in behavioral parameters between the two groups were statistically significant. The Bonferroni post hoc test indicated that the differences were statistically significant at the indicated time points; *p < 0.05, **p < 0.01. cg Chemogenetic activation of the TRN alleviated CSD-induced pain sensitivity. c Diagram of experimental design. AAV-hDlx-Gq GREADD-dTomato or the control AAV-hDlx-dTomato control was injected into the mouse TRN, and the mice were maintained for 4 weeks to allow virus expression. All mice were then subjected to CSD followed by C21 administration at 1 pm on the day of the last CSD session. d Representative image of TRN DREADDs expression and this experiment was repeated independently three times with similar results. The facial mechanical withdrawal threshold (Vector+C21 vs Gq+C21 at 60 min p = 0.0166) e hindpaw mechanical withdrawal threshold (Vector+C21 vs Gq+C21 at 60 min p < 0.0001, 90 min p = 0.0378) f and hindpaw thermal withdrawal latency (Vector+C21 vs Gq+C21 at 60 min p = 0.0095, 90 min p = 0.0407) g were examined at the indicated time points (n = 8 mice). Two-way ANOVA indicated that the differences in behavioral parameters between the two groups were statistically significant. The Bonferroni post hoc test indicated the differences were statistically significant at the indicated time points. Data are presented as mean ± SEM, *p < 0.05, **p < 0.01, ****p < 0.0001. Source data are provided as a Source Data file. DREADDs: designer receptors exclusively activated by designer drugs. VP ventral posterior nucleus of the thalamus.
Fig. 3
Fig. 3. Decreased neural activity in the TRN after CSD.
ac Neural dynamics in the TRN before and after CSD. a Experimental diagram of the experiment used to study neural dynamics in the TRN. Mice in the sham and CSD groups (n = 6 mice) were injected with AAV-hDlx-GCaMP6f into the TRN and maintained for 4 weeks to allow virus expression. Fiber photometry recording was performed on day 0 and day 5. The fluorescence picture shows virus expression in the TRN. b Sample traces of calcium signals in the TRN. c Statistical analysis of the area under the curve for calcium traces in the sham and CSD groups (n = 6 mice, Day 0 vs day 5 CSD p = 0.0147); *p < 0.05, two-sided paired t test. df Calcium dynamics in the VP. d Diagram of the experiment used to study neural dynamics in the VP. Mice in the sham and CSD groups (n = 6 mice) were injected with AAV-CaMKII-GCaMP6f into the VP and maintained for 4 weeks to allow virus expression. Fiber photometry recording was performed on day 0 and day 5. e Sample traces of calcium dynamics in the VP. f Statistical analysis of the area under the curve of calcium traces in the sham and CSD groups (n = 6 mice, Day 0 vs day 5 CSD p < 0.0001). Two-sided paired t test. gi Chemogenetic activation of the TRN attenuated CSD-induced VP hyperactivity. g Experimental diagram of virus injection to the TRN and VP. AAV-hDlx-Gq DREADD-dTomato (n = 6 mice) or AAV-hDlx-dTomato vector control (n = 6 mice) was injected into the TRN. AAV-CaMKII-GCaMP6f was injected into the VP of all mice. Four weeks were allowed for virus expression. Fiber photometry was performed to measure neural activity in the VP. A representative image of virus expression is shown. h Sample traces of neural activity in the VP after 5 sessions of CSD (before and 30 min after C21 administration). i Statistical analysis of the area under the curve of calcium traces before and after C21 administration (n = 6 mice, Gq before vs after C21 p = 0.0312). Two-sided paired t test. * p < 0.05. Source data are provided as a Source Data file. AUC area under the curve.
Fig. 4
Fig. 4. The TRN to VP projection is critical for CSD-induced hyperalgesia.
ae Chemogenetic inhibition of VP neurons receiving inputs from the TRN alleviated CSD-induced hyperalgesia. AAV1-hSyn-eGFP-Cre was injected into the TRN. AAV-hSyn-DIO-Gi DREADD-mCherry (n = 8 mice) or AAV-hSyn-DIO-mCherry vector control (n = 8 mice) was injected into the VP. All mice were subjected to CSD sessions, and C21 was administered at the end of the 5th CSD session. Behavioral testing was performed at the indicated time points. a Diagram of the virus targeting strategy. b A representative virus expression picture for the TRN and VP regions. Green: GFP; red: mCherry. The facial mechanical withdrawal threshold (vector+C21 vs Gi+C21 at 60 min p = 0.0287) c hindpaw mechanical withdrawal threshold (vector+C21 vs Gi+C21 at 30 min p = 0.0004, 60 min p = 0.0002, 90 min p = 0.0002) d and hindpaw thermal withdrawal latency (vector+C21 vs Gi+C21 at 60 min p = 0.002, 90 min p = 0.0273) e of mice that received Gi DREADD and vector control were examined at the indicated time points. f–j Chemogenetic activation of the TRN neuron that were retrogradely targeted from the VP alleviated CSD-induced pain sensitivity. f AAVretro-hSyn-eGFP-Cre was injected into the VP. AAV-hSyn-DIO-Gq DREADD-mCherry (n = 8) or the control AAV-hSyn-DIO-mCherry vector (n = 8 mice) was injected into the TRN. g A representative virus expression picture for the TRN and VP regions. Green: GFP; red: mCherry. All mice were subjected to CSD sessions, and C21 was administered at the end of the 5th CSD session. Behavioral testing was performed at the indicated time points. The facial mechanical withdrawal threshold (vector+C21 vs Gq+C21 at 60 min p = 0.0448) h hindpaw mechanical withdrawal threshold (vector+C21 vs Gq+C21 at 30 min p = 0.0121, 60 min p < 0.0001, 90 min p = 0.0095) i and hindpaw thermal withdrawal latency (vector+C21 vs Gq+C21 at 60 min p = 0.0009, 90 min p = 0.0046) j of mice that received Gq DREADD and vector control were shown. Two-way ANOVA followed by Bonferroni’s multiple comparisons test was used. Data are presented as mean ± SEM, *p < 0.05, **p < 0.01, ***p < 0.001, ****p < 0.0001 at the indicated time points. Experiments of b and g were repeated independently three times with similar results. Source data are provided as a Source Data file. VP ventroposterior thalamus.
Fig. 5
Fig. 5. The level of NADA is decreased in the TRN after CSD.
ab Targeted metabolomics analysis of the TRN. Mice in the CSD and sham groups (n = 8 mice). a Volcano plot of metabolites. Differential abundant metabolites were identified using a fold change of 2 and p value (t test) <0.05 as cutoffs. b Relative abundance of NADA (n = 8 mice, Sham vs CSD p = 0.0132). *p < 0.05, two-sided t test. c, d Expression of the CB1 receptor in the TRN. c The picture is representative of six independently stained samples. d TRPV1 expression was negligible in the TRN. Anti-PV, anti-TRPV1, and anti-CB1 receptor antibodies were used. eg Decreased CB1 receptor activity after CSD. AAV-hSyn-GRAB-eCB2.0 was injected into the TRN (n = 6 mice). Four weeks were allowed for virus expression. Mice were then subjected to CSD. CB1 receptor activity was examined on days 0 and 5. e Diagram of the virus expression and fiber photometry experiments. The image was obtained after staining with an anti-GFP antibody. f Representative traces of CB1 receptor activity. g Area under the curve of TRN CB1 receptor activity traces (n = 6 mice, Day 0 vs day 5 CSD p = 0.0014). **p < 0.01, two-sided paired t test; NS: p > 0.05. Source data are provided as a Source Data file. NADA N-arachidonoyl dopamine, PV parvalbumin, CB1 cannabinoid receptor type 1, TRPV1 transient receptor potential vanilloid 1.
Fig. 6
Fig. 6. NADA in the TRN is critical for CSD-induced hyperalgesia.
a–d Administration of NADA into the TRN alleviated CSD-induced hyperalgesia. The TRN was cannulated for NADA or ACSF administration. b The hindpaw mechanical withdrawal threshold (CSD + ACSF vs CSD + NADA at 30 min p = 0.0049, 60 min p < 0.0001, 120 min p = 0.0005, 180 min p = 0.0031), c hindpaw thermal withdrawal latency (CSD + ACSF vs CSD + NADA at 30, 60, 120 min p < 0.0001, 180 min p = 0.0104), and d facial mechanical withdrawal threshold (CSD + ACSF vs CSD + NADA at 30 min p = 0.0050, 60 min p = 0.0007, 120 min p = 0.0009, 180 min p = 0.0096) were determined at the indicated time points (n = 8 mice). Two-way ANOVA followed by Bonferroni’s multiple comparisons test indicated that the differences between the two groups were statistically significant. Data are presented as mean ± SEM, *p < 0.05, ** p < 0.01, ***p < 0.001, ****p < 0.0001. eh Administration of NADA into the TRN dampened CSD-induced VP hyperactivity. The TRN was cannulated for NADA (n = 6 mice) or ACSF (n = 6 mice) administration, and AAV-CaMKII-GCaMP6f was injected into the VP. Four weeks were allowed for virus expression. Fiber photometry was performed on animals that received ACSF and NADA. ef Diagram of TRN cannulation and fiber photometry of the VP. g Sample traces of VP calcium signals on day 5 of CSD before and after NADA administration. h Area under the curve of calcium traces in the VP (n = 6 mice, before vs after NADA infusion p = 0.005). **p < 0.01, two-sided paired t test. Source data are provided as a Source Data file. NADA: N arachidonoyl dopamine; ACSF artificial cerebral spinal fluid.

References

    1. Dahlhamer J, et al. Prevalence of chronic pain and high-impact chronic pain among adults - united states, 2016. MMWR Morb. Mortal. Wkly. Rep. 2018;67:1001–1006. - PMC - PubMed
    1. Doan L, Manders T, Wang J. Neuroplasticity underlying the comorbidity of pain and depression. Neural Plast. 2015;2015:504691. - PMC - PubMed
    1. Husak AJ, Bair MJ. Chronic pain and sleep disturbances: a pragmatic review of their relationships, comorbidities, and treatments. Pain Med. 2020;21:1142–1152. - PubMed
    1. Finnerup NB. Nonnarcotic methods of pain management. N. Engl. J. Med. 2019;380:2440–2448. - PubMed
    1. Bhaskar S, Hemavathy D, Prasad S. Prevalence of chronic insomnia in adult patients and its correlation with medical comorbidities. J. Family Med. Prim. Care. 2016;5:780–784. - PMC - PubMed

Publication types