. 2023 Oct 25;14(1):6769.
doi: 10.1038/s41467-023-42247-w.

Localized cardiac small molecule trajectories and persistent chemical sequelae in experimental Chagas disease

Affiliations

Localized cardiac small molecule trajectories and persistent chemical sequelae in experimental Chagas disease

Zongyuan Liu et al. Nat Commun. .

Abstract

Post-infectious conditions present major health burdens but remain poorly understood. In Chagas disease (CD), caused by Trypanosoma cruzi parasites, antiparasitic agents that successfully clear T. cruzi do not always improve clinical outcomes. In this study, we reveal differential small molecule trajectories between cardiac regions during chronic T. cruzi infection, matching with characteristic CD apical aneurysm sites. Incomplete, region-specific, cardiac small molecule restoration is observed in animals treated with the antiparasitic benznidazole. In contrast, superior restoration of the cardiac small molecule profile is observed for a combination treatment of reduced-dose benznidazole plus an immunotherapy, even with less parasite burden reduction. Overall, these results reveal molecular mechanisms of CD treatment based on simultaneous effects on the pathogen and on host small molecule responses, and expand our understanding of clinical treatment failure in CD. This link between infection and subsequent persistent small molecule perturbation broadens our understanding of infectious disease sequelae.


Conflict of interest statement

K.M.J., A.L.K., A.C.L., J.P., M.E.B., and P.J.H. currently are involved in a Chagas vaccine development program. M.E.B. and P.J.H. are listed among the inventors on a Chagas disease vaccine patent, submitted by Baylor College of Medicine. The remaining authors declare no competing interests.

Figures

Fig. 1
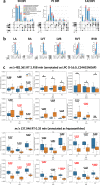
Fig. 1. Infection-induced small molecule perturbations are highly localized spatially and temporally.
a Heart sections analyzed. RA right atrium, LA left atrium, RVT right ventricle top, RVB right ventricle bottom, LVT left ventricle top, LVB left ventricle bottom. b PERMANOVA pseudo-F for PCoA distances between naïve and infected at 50, 75, and 142 days post-infection (DPI). *p-value < 0.05 by PERMANOVA. Pseudo-F is a measure of effect size: the greater the pseudo-F value, the greater the difference between infected and uninfected samples at that site and at that timepoint. c Site-specific PERMANOVA pseudo-F vs time. Star, p-value < 0.05 by PERMANOVA. Pseudo-F values increase between 75 and 142 DPI for left ventricle bottom and right ventricle bottom, indicating increasing impacts of infection on the overall small molecule profile. In contrast, pseudo-F values decrease between 75 and 142 DPI for all other tissue sections, indicating decreasing differences between infected and uninfected samples at these sites and these timepoints. N = 15 mice per group and per position. Source data are provided as a Source Data file.
Fig. 2
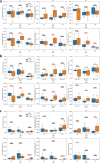
Fig. 2. Impact of infection progress on individual small molecules.
a UpSet plot demonstrating limited overlap between infection-impacted small molecules at each heart section, for each timepoint post-infection. Bars are colored by superclass from ClassyFire annotation, as implemented in MolNetEnhancer,. Dark circles represent intersections between groups, with the size of that intersection on top of the colored bar graph. Total number of features impacted by infection at each sampling site is represented on the left barplot. b UpSet plot demonstrating limited overlap between infection-impacted small molecules at each timepoint, for each of the heart sections. c Representative small molecules locally impacted by infection over time. Red line, p-value < 0.05 by Mann-Whitney U test, two-sided, FDR-corrected. Black line, p-value > 0.05 by Mann-Whitney U test, two-sided, FDR-corrected. Numbers on top of the lines are the corrected p-values. Boxplots represent median, upper and lower quartiles, with whiskers extending to show the rest of the distribution, except for points that are determined to be outliers by being beyond the interquartile range ±1.5 times the interquartile range. RA right atrium, LA left atrium, RVT right ventricle top, RVB right ventricle bottom, LVT left ventricle top, LVB left ventricle bottom, DPI days post-infection. N = 15 mice per group and per position. Source data are provided as a Source Data file.
Fig. 3
Fig. 3. Impact of infection duration on total glycerophosphocholines, glycerophosphoethanolamines and acylcarnitines.
Data represents summed peak areas for all glycerophosphocholines (a), all glycerophosphoethanolamines (b), and all acylcarnitines (c). identified as described in “Methods” section. RA right atrium, LA left atrium, RVT right ventricle top, RVB right ventricle bottom, LVT left ventricle top, LVB left ventricle bottom, DPI days post-infection. Red line, p-value < 0.05 by Mann-Whitney U test, two-sided, FDR-corrected. Black line, p-value > 0.05 by Mann-Whitney U test, two-sided, FDR-corrected. Numbers on top of the lines are the corrected p-values. Boxplots represent median, upper and lower quartiles, with whiskers extending to show the rest of the distribution, except for points that are determined to be outliers by being beyond the interquartile range ±1.5 times the interquartile range. N = 15 mice per group and per position. Source data are provided as a Source Data file.
Fig. 4
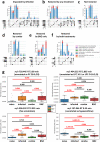
Fig. 4. BNZ does not fully restore small molecule alterations while vaccine-linked chemotherapy showed greater improvement.
a Treatment timeline. Created using BioRender.com. b Median parasite burden in each group (log scale). Right ventricle bottom values in naive mice not displayed due to log scale (median of zero). c PERMANOVA pseudo-F at 142 DPI for PCoA distances between naïve mice and the different treatment groups or between infected untreated mice and the different treatment groups. d PCoA distances between experimental groups at 142 DPI. In particular, BNZ-treated samples were not as distant from infected samples as combo-treated samples at RVB. Red lines, KW with post-hoc Dunn’s test, FDR-corrected p < 0.05. Black lines, p-value > 0.05. Numbers on top of the bars are the corrected p-values. Boxplots represent median, upper and lower quartiles, with whiskers extending to show the rest of the distribution, except for points that are determined to be outliers by being beyond the interquartile range ±1.5 times the interquartile range. BNZ benznidazole, RVT right ventricle top, RVB right ventricle bottom, LVT left ventricle top, LVB left ventricle bottom. N = 15 mice per group and per position. e Diagram of restoration of small molecule status based on distance analysis from panel d. f Parasite burden in individual samples. Gaps are positioned so that no data is hidden. Source data are provided as a Source Data file.
Fig. 5
Fig. 5. BNZ + Tc24 vaccine combination treatment restored more infection-perturbed small molecules than BNZ-only treatment.
All small molecules in panel (a) came from random forest analysis between naïve and infected mice at 142 DPI. Bars are colored by superclass annotation generated in Classyfire, implemented in MolNetEnhancer. a Small molecules impacted by infection. b Small molecules restored by any treatment (BNZ-only or combo treatment (BNZ+Tc24-C4/E6020-SE)). c Small molecules not restored by any treatment. d Small molecules only restored by BNZ + Tc24 vaccine treatment. e Small molecules only recovered by BNZ treatment. f Small molecules commonly restored by both treatments. RA right atrium, LA left atrium, LVT left ventricle top, LVB left ventricle bottom, RVT right ventricle top, RVB right ventricle bottom. g Representative small molecules restored by different treatments. Red line, p-value < 0.05 by Mann-Whitney U test, two-sided, FDR corrected. Black line, p-value > 0.05 by Mann–Whitney U test, two-sided, FDR-corrected. Numbers on top of the lines are the corrected p-values. Boxplots represent median, upper and lower quartiles, with whiskers extending to show the rest of the distribution, except for points that are determined to be outliers by being beyond the interquartile range ±1.5 times the interquartile range. N = 15 mice per group and per position throughout the figure. Source data are provided as a Source Data file.
Fig. 6
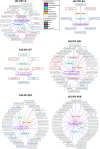
Fig. 6. Correlation between disease metadata and small molecule peak area at 142 DPI.
Solid lines indicate a positive correlation coefficient between disease metadata and small molecules; dotted lines indicate a negative correlation coefficient between disease metadata and small molecules. Correlation line colors relate to the specific correlated metadata category. Small molecule box colors indicate feature restoration status: green for features restored by combination treatment, red for features restored by BNZ treatment, blue for features restored by both treatments, and gray for features not restored by any treatment. Note the greater number of not-restored features correlated to the metadata. RA right atrium, LA left atrium, RVT right ventricle top, RVB right ventricle bottom, LVT left ventricle top, LVB left ventricle bottom, DPI days post-infection. N = 15 mice per group and per position. Source data are provided as a Source Data file.
Fig. 7
Fig. 7. Conceptual representation of the intersection between parasites, immune response and metabolism, in this parasite and mouse strain combination.
a Overall treatment design and expected impacts. b Interactions before antiparasitic treatment. c Interactions after antiparasitic treatment but without therapeutic vaccine. d Interactions after antiparasitic treatment and therapeutic vaccine. BNZ benznidazole, CCC chronic Chagasic cardiomyopathy, LPC lysophosphatidylcholines, PC phosphatidylcholines, MP macrophage, DC dendritic cell. Figure created using BioRender.com.

Update of

Similar articles

Cited by

References

    1. Rebman AW, Aucott JN. Post-treatment Lyme disease as a model for persistent symptoms in Lyme disease. Front. Med. 2020;7:57. - PMC - PubMed
    1. Hirschenberger, M., Hunszinger, V. & Sparrer, K. M. J. Implications of innate immunity in post-acute sequelae of non-persistent viral infections. Cells10, 2134 (2021). - PMC - PubMed
    1. Hanevik K, et al. Irritable bowel syndrome and chronic fatigue 6 years after giardia infection: a controlled prospective cohort study. Clin. Infect. Dis. 2014;59:1394–1400. - PMC - PubMed
    1. Phetsouphanh C, et al. Immunological dysfunction persists for 8 months following initial mild-to-moderate SARS-CoV-2 infection. Nat. Immunol. 2022;23:210–216. - PubMed
    1. Morillo CA, et al. Randomized trial of benznidazole for chronic chagas’ cardiomyopathy. N. Engl. J. Med. 2015;373:1295–1306. - PubMed

Publication types