. 2023 Nov;623(7985):202-209.
doi: 10.1038/s41586-023-06629-w. Epub 2023 Oct 25.

Structures of a sperm-specific solute carrier gated by voltage and cAMP

Affiliations

Structures of a sperm-specific solute carrier gated by voltage and cAMP

Valeria Kalienkova et al. Nature. 2023 Nov.

Abstract

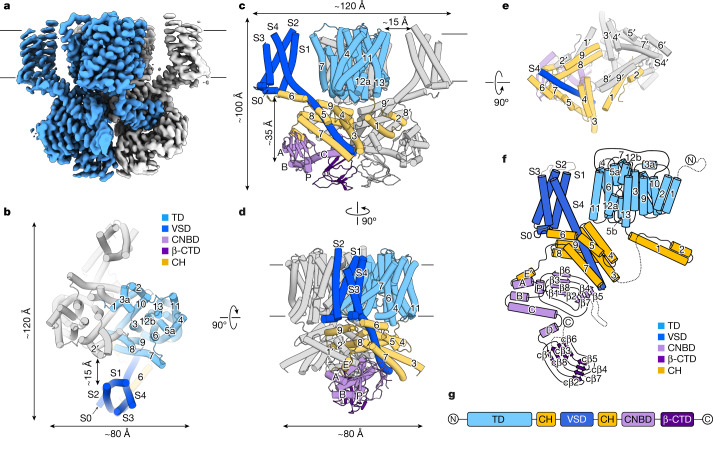
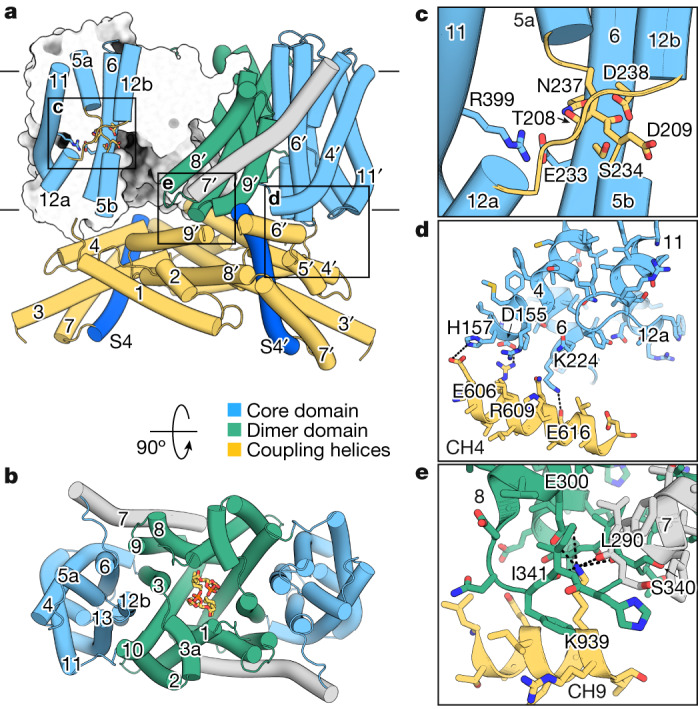
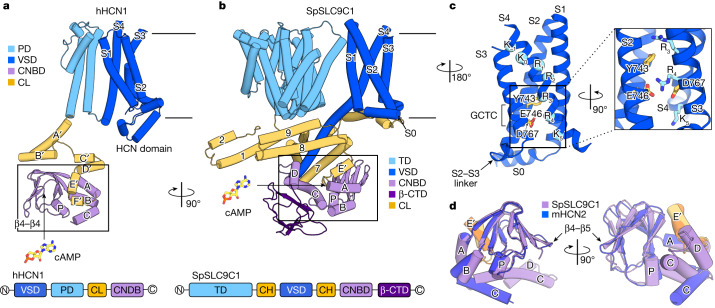
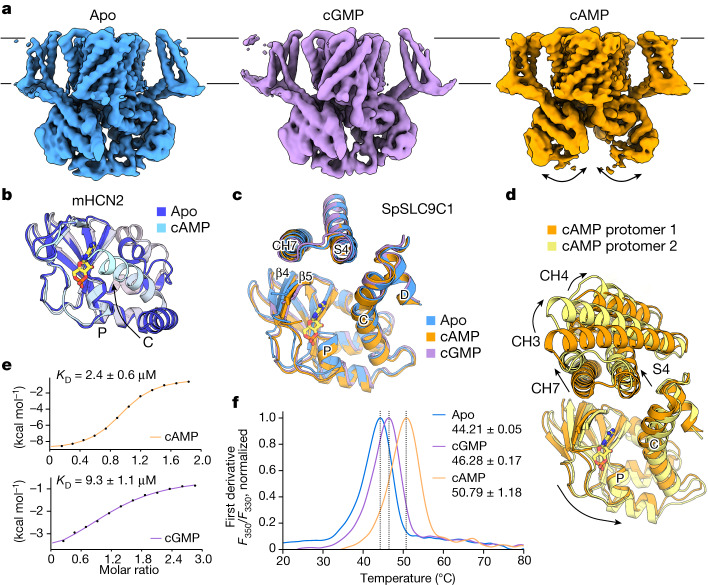
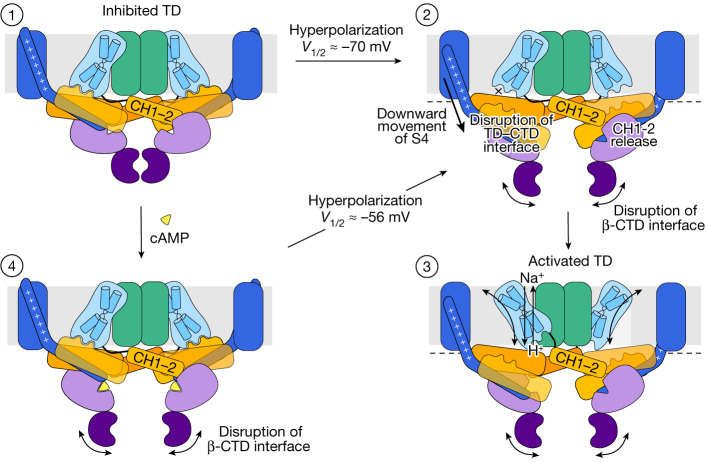
The newly characterized sperm-specific Na+/H+ exchanger stands out by its unique tripartite domain composition1,2. It unites a classical solute carrier unit with regulatory domains usually found in ion channels, namely, a voltage-sensing domain and a cyclic-nucleotide binding domain1,3, which makes it a mechanistic chimera and a secondary-active transporter activated strictly by membrane voltage. Our structures of the sea urchin SpSLC9C1 in the absence and presence of ligands reveal the overall domain arrangement and new structural coupling elements. They allow us to propose a gating model, where movements in the voltage sensor indirectly cause the release of the exchanging unit from a locked state through long-distance allosteric effects transmitted by the newly characterized coupling helices. We further propose that modulation by its ligand cyclic AMP occurs by means of disruption of the cytosolic dimer interface, which lowers the energy barrier for S4 movements in the voltage-sensing domain. As SLC9C1 members have been shown to be essential for male fertility, including in mammals2,4,5, our structure represents a potential new platform for the development of new on-demand contraceptives.


Conflict of interest statement

The authors declare no competing interests.

Figures

Fig. 1
Fig. 1. Architecture of SpSLC9C1.
a, Cryo-EM map of the SpSLC9C1 dimer in nanodiscs, in the absence of ligands at pH 7.6 and 150 mM Na+. Protomers are displayed in unique colours and membrane boundaries are indicated by horizontal lines. The map is contoured at 0.4σ. bd, Model of SpSLC9C1 in a ligand-free conformation displayed as cylinders viewed from top (b), as in panel a (c) and from the side, rotated (d). e, The arrangement of the cytoplasmic helices viewed from top; transmembrane part is not displayed. Selected helices are labelled and the relationship between views is indicated. Individual domains are displayed in unique colours used throughout the manuscript unless otherwise indicated, namely, the TD in light blue, the VSD in dark blue, the CHs in yellow, the CNBD in light purple and the β-CTD in dark purple. f, Planar schematic representation of the SpSLC9C1 architecture. Dashed lines indicate loops neither resolved nor modelled. g, Domain arrangement of SpSLC9C1 on a sequence level.
Fig. 2
Fig. 2. Structural features of the SpSLC9C1 transport domain.
a, Secondary structure of the transport domain of SpSLC9C1 shown as cylinders. Core and dimer domains are displayed in light blue and green, respectively, connecting TM7 is in grey, coupling helices of the CTD are in yellow and the extended cytoplasmic region of the VSD helix S4 is in dark blue. The left protomer is represented as a slice-through surface, revealing an inward-facing state. Helices forming the ion-binding site are displayed, with the unwound crossing region of TM5 and TM12 shown as yellow loops. Residues important for ion coordination and activity are displayed as sticks, including D209 and the backbone carbonyl of T208 in the unwound part of TM5, D238 and S234 on TM6, and R441 on TM12, as well as the conserved salt bridge between E233 on TM6 and R399 on TM11. Membrane boundaries are indicated. b, Top view of the transport domain. Lipids at the dimer interface are displayed as orange sticks. ce, Close-up views of regions boxed in a, highlighting the ion-binding site (c), potential interactions between the core domain of TD and the CTD (d) and the interface between the dimer domain of TD and the CTD (e).
Fig. 3
Fig. 3. The VSD and CNBD of SpSLC9C1 in comparison with canonical CNBD channels.
a,b, General architecture of hHCN1 (PDB: 5U6O) (a) and SpSLC9C1 (b). Top, structural comparison of the two proteins. A single protomer is displayed for clarity. Equivalent functional domains are coloured accordingly: VSD in dark blue; TD and PD in light blue; CL and CH in yellow; CNBD in light purple; and β-CTD in dark purple. The relationship between boxed regions is indicated by rotation. Bottom, primary sequence domain arrangement of hHCN1 and SpSLC9C1. c, Close-up of the membrane-embedded part of the VSD of SpSLC9C1. Gating charge transfer centre (GCTC, composed of Y743, E746 and D767) on S2–3 is indicated. Conserved positively charged residues are displayed as blue spheres and labelled according to the Shaker Kv nomenclature. Right, close-up of the GCTC. Conserved positively charged residues are shown as blue sticks and GCTC residues are shown as yellow sticks. d, Overlay of the SpSLC9C1 CNBD (yellow and light purple) with that of mHCN2 (PDB: 5JON, orange and dark purple). Selected structural elements of CNBDs are labelled.
Fig. 4
Fig. 4. Conformational changes associated with ligand binding in SpSLC9C1.
a, Intermediate refined unsharpened maps of SpSLC9C1 in apo (displayed at 4σ), cGMP-bound (4.2σ) and cAMP-bound (5.2σ) states illustrating the higher mobility of the CTD in the presence of cAMP. b, Overlay of the CNBD structure of mHCN2 in apo (dark blue, PDB: 5JON) and cAMP-bound (cyan, PDB: 3BPZ) conformations. The C and P helices are labelled, the movement of the former upon ligand binding is indicated by an arrow and cAMP is shown as a stick. c, Overlay of the CNBD structure of SpSLC9C1 observed in the dimeric apo (blue), cGMP (purple) and best-resolved cAMP-bound class (orange) conformations. Selected helices are indicated and cAMP is shown as a stick. d, Overlay of the two cAMP-bound protomer classes obtained through extensive 3D classification which discloses stronger movements within the CNBD as well as CHs, as seen for CH3, CH4 and CH7. e, ITC binding curves for the isolated SpSLC9C1–CTD construct (S946–E1193) titrated with cAMP (top) or cGMP (bottom). The mean binding affinity and s.d. for three biological replicates are given. f, nanoDSF measurement of the isolated SpSLC9C1–CTD construct for three technical replicates. The normalized first derivates of the ratio of the detected fluorescence signals at 350 nm (F350) and 330 nm (F330) for the apo protein (blue) and after addition of cGMP (purple) and cAMP (orange) are shown.
Fig. 5
Fig. 5. Putative activation model for the voltage-gated and cAMP modulated Na+/H+ exchange in SpSLC9C1.
A schematic representation of the proposed SpSLC9C1 activation mechanism. Under non-activating conditions, the TD is locked in an inward-facing state through interactions with coupling helices (state 1). Membrane hyperpolarization causes a downward S4 movement, which presumably leads to the disruption of the interfaces between the TD and CTD and between adjacent β-CTDs. The increased mobility of the CTD would also release the interactions of the CH1–2 helices within the adjacent protomer (state 2). The described changes unlock the arrested catalytic core domain of the TD, which allows Na+/H+ exchange by means of an elevator-like mechanism (state 3). Binding of the strong agonist cAMP increases the conformational dynamics of the CTD, thereby removing one of the barriers for activation (state 4). Ligand-free and various intermediate cAMP-bound states were observed in this study (state 1 and 4), whereas states 2 and 3 with S4 in a down conformation are postulated.
Extended Data Fig. 1
Extended Data Fig. 1. Cryo-EM of ligand-free SpSLC9C1 in lipid nanodiscs.
a) Size exclusion profiles of detergent-solubilized (blue) and 2N2-reconstituted (magenta) SpSLC9C1. Samples were analysed on Superose 6 Increase 10/300 column. b) SDS-PAGE of main peak fractions of SpSLC9C1 in lipid nanodiscs used for grid preparation. Protein purification and reconstitution was performed >3 times with similar appearance of size exclusion chromatograms, and similar migration behaviour in the SDS-PAGE gel. For gel source data, see Supplementary Fig. 1. Representative cryo-EM images out of 11,296 comparable images (c), 2D classes (d) and image processing workflow (e). During 3D classification of protomers, the mask encompassing only the VSD and CTD was applied to focus on less-resolved parts of the protein. f) Overlay of the CNBD (light purple) and the β-CTD (dark purple). The phosphate binding cassette (PBC) important for cNMP coordination found in β-CNBD and not in β-CTD is displayed in orange. g) Cytosolic inter-protomer interface of SpSLC9C1 mediated by β-CTD, selected residues are shown as sticks and labelled. As the local resolution of the cryo-EM map does not allow an unambiguous modelling of side chain rotamers in the β-CTD, a fit of the Alphafold model into the density was used instead. It reveals a number of charged residues possibly interacting between neighbouring β-CTD. h) cNMP-binding site in the CNBD, cryo-EM density map is displayed as grey mesh contoured at 4.7 σ, SpSLC9C1 model is shown in purple.
Extended Data Fig. 2
Extended Data Fig. 2. Validation of the ligand-free SpSLC9C1 in lipid nanodiscs dataset.
Shown are local resolution, angular distribution and Fourier shell correlation plots (0.143 criteria) of the SpSLC9C1 final dimer map, displayed at 0.4 σ (a), as well as of the protomer state 1, displayed at 1.3 σ (b), state 2, displayed at 1.6 σ (c), state 3, displayed at 0.6 σ (d) and state 4, displayed at 0.8 σ (e). f) Superposition of models obtained from the four distinct apo protomer states.
Extended Data Fig. 3
Extended Data Fig. 3. Cryo-EM of ligand-free SpSLC9C1 in detergent.
Representative cryo-EM images out of 7,090 comparable images (a) and 2D classes (b). c) Angular distribution of obtained final maps. d) Image processing workflow. e) Effect of the S4 conformation on micelle shape as seen in the obtained symmetric and asymmetric classes. Shown are refined unmasked maps lowpass-filtered to 5 Å. Protein is shown in grey, micelle in color. Asymmetric map is displayed at 3.8 σ, symmetric map at 3.5 σ. f) Overlay of the protomer state 1 obtained in nanodiscs and the asymmetric class in detergent, S4 is indicated. It is likely that the detergent micelle is not sufficiently rigid to stabilize VSDs in the upright position, in contrast to lipid bilayer disc provided by the nanodisc. Therefore, we believe that the tilted/collapsed S4 conformation observed in a fraction of particles in detergent is unlikely physiological. We chose to not deposit the model and only use it for illustrative purposes. g) Final deepEMhancer sharpened maps colored according to the local resolution and displayed at 0.7 σ. h) Fourier-shell correlation (0.143 criteria) of the final maps.
Extended Data Fig. 4
Extended Data Fig. 4. Lipid bilayer interactions and comparison to other NHEs.
a) Left, SpSLC9C1 apo map (blue), displayed at 0.4 σ overlayed with the unmasked refined map displayed at 2 σ (transparent) to indicate lipid bilayer boundaries. (*) marks a “cap” observed in the unmasked dimer map at a lower contour above the middle of TD, which might potentially be formed by the unresolved N-terminal region (residues 1-70). Right, slice-through of the SpSLC9C1 map (positions indicated on the left) refined with a mask encompassing the nanodisc region only, protein density is displayed in blue, surrounding lipid densities and MSP belt in yellow, map is contoured at 3 σ. b) Surface representation of apo SpSLC9C1 colored by hydrophobicity, membrane boundary is indicated. Amphipathic helices CH6 and S0 are displayed as cartoon. c) Schematic architecture of SLC9C1 in comparison to CNBD channels. Domains fulfilling equivalent functions are color-coded according to SpSLC9C1 – pore domain (PD) in light blue, VSD in dark blue, C-linker (CL) in yellow, CNBD in light purple. d) Primary sequence domain arrangement of SLC9C1 compared to CNBD channels, coloring as in (c). e) Overlay of the TD protomer of SpSLC9C1 with that of the archaeal MjNhaP1 (PDB: 4CZB), horse NHE9 (PDB: 6Z3Z) and bison NHA2 (PDB: 7P1K),r.m.s.d. values were calculated in coot using SSM superpose function and are indicated below individual overlays. f) Surface depiction of the TD colored by electrostatics of SpSLC9C1 and NHE9. Left, slice-through displaying the negatively charged cavity providing access to the ion-binding site (*) from the cytoplasm in the inward-facing conformation. Right, slice-through of the dimer interface (‡), showing the lipid filled extracellularly facing cavity (lipid densities not displayed). g) Top, close-up of the membrane-embedded dimer interface viewed from the top, protein is displayed in green, lipid molecules in orange. Selected helices are labelled. Refined unsharpened map is shown as grey mesh contoured at 4.7 σ. Bottom, view of the lipid densities from the side, one of the SpSLC9C1 protomers is not displayed for clarity.
Extended Data Fig. 5
Extended Data Fig. 5. Comparison of the SpSLC9C1 VSD to CNBD ion channels and potential interdomain interactions.
a) Sequence alignment of SpSLC9C1 VSD to that of selected VGICs. GCTC residues are highlighted in yellow and red, gating charges in blue. Gating charges are numbered according to Shaker Kv. b) VSD structures of selected VGICs in comparison to SpSLC9C1; models used are from the hyperpolarization-activated hHCN1 (PDB: 5U6O) and atKAT1 (PDB: 6V1X), and the depolarization-activated Shaker Kv (PDB: 7SIP), apo SpSLC9C1 protomer state 1 (PDB: 8PD2). c) SpSLC9C1 protomer state 1 (PDB: 8PD2) colored by domains, selected helices are labelled, and close-ups displayed in d)–f) are indicated. Interaction of cytoplasmic part of S4 with CH3, CH4 (d), CH7 (e) and CNBD helices C and D (f). The extended cytosolic region of S4 in SpSLC9C1 is indicated by blue dots. Y843 is displayed to facilitate the navigation between the panels.
Extended Data Fig. 6
Comparison of the SpSLC9C1 CNBD, ligand binding and ligand-induced conformational changes. a) Sequence alignment of the CNBD region of selected SLC9C1 homologs and CNBD channels. Residues interacting with cNMPs are highlighted according to their properties (hydrophobic in yellow, basic in blue, acidic in red, conserved glycine in grey. While HCN1 and SthK harbor cNMP-modulated CNBDs, KAT1 and KCNQ1 are cNMP insensitive as their CNBD do not carry the otherwise conserved arginine (R1053 in SpSLC9C1) that coordinates the cNMP phosphate group and is crucial for cNMP binding. b) Superposition of apo SpSLC9C1 protomer state 1 (PDB: 8PD2) with apo hHCN1 (PDB: 5U6O), rabbit HCN4 (PDB: 7NP3) and SthK (PDB: 6CJQ). Helices P and C of CNBDs are labelled. c) Superposition of CNBDs in apo (PDB-IDs as in (b)) and the respective cAMP-bound conformations (hHCN1 PDB: 5U6P, rHCN4 PDB: 7NP4, SpSLC9C1 PDB: 8PDV). P and C helices are labelled, conformational change observed in hHCN1 and rHCN4 upon cAMP binding is indicated by an arrow. d). Close-up of the cNMP-binding site observed for the CNBD in the apo (left), cAMP-bound (middle) and cGMP-bound (right) states, with cNMP molecules shown in yellow. Residues potentially important for cNMP coordination are shown in blue and labelled, these correspond to the conserved: L1008 on β4, F1032 and L1036 on β5, I1042 on β6, E1044 and M1045 on P-helix, R1053 on PBC and R1097 on C-helix. N1054 is stabilizing cGMP in a ‘syn’ conformation, equivalent to a Thr in HCN1, HCN2, HCN4 and SthK. e) Overlay of the transport domain of the apo (blue) and the best resolved cAMP-bound dimeric classes (orange), viewed from the top (left). Close-up of the TM1 in the two structures, the proline hinge is indicated (right). f) Representative ITC measurements for the isolated SpSLC9C1-CTD construct (S946-E1193) titrated with cAMP (upper panel) or cGMP (lower panel). The corresponding binding curves are shown in main text Fig. 4e.
Extended Data Fig. 7
Extended Data Fig. 7. Cryo-EM processing workflow of SpSLC9C1 in lipid nanodiscs supplemented with cGMP.
Representative cryo-EM images out of 8,482 comparable images (a) and 2D classes (b) of vitrified SpSLC9C1 in presence of cGMP. c) Angular distribution of the obtained dimeric map. d) Image processing workflow. During 3D classification of protomers, the mask encompassing only the VSD and CTD was applied to focus on less-resolved parts of the protein. e) Final dimer and protomer deepEMhancer sharpened maps colored according to the local resolution, dimer map is displayed at 0.85 σ, protomer at 1.2 σ. f) Fourier Shell correlation plots of the obtained maps (0.143 criteria). g) cNMP-binding site of the CNBD from the final protomer map displayed as grey mesh contoured at 4.7 σ, protein model in purple, cGMP molecule in yellow, density corresponding to bound cGMP is shown in magenta.
Extended Data Fig. 8
Extended Data Fig. 8. Cryo-EM processing workflow of SpSLC9C1 in lipid nanodiscs supplemented with cAMP.
Representative cryo-EM images out of 25,363 comparable images (a) and 2D classes (b) of vitrified SpSLC9C1 in presence of cAMP. c) Angular distribution of the best resolved dimeric class. d) Image processing workflow. Notably, the cytoplasmic domain displays a high degree of conformational heterogeneity throughout data processing, indicative of higher mobility. This is best exemplified by the intermediate processing step map at 3.78 Å resolution, by the various 3D classes obtained in the final 3D classification on a dimer and protomer level, as well as from the 3D variability analysis in CryoSparc (3DVA, see Supplementary Video 1). During 3D classification of protomers, the mask encompassing only the VSD and CTD was applied to focus on less-resolved parts of the protein. e) Final maps colored according to the local resolution, dimeric map is displayed at 0.5 σ, protomer 1 at 1 σ and protomer 2 at 0.8 σ, respectively. f) Fourier Shell Correlation plots (0.143 criteria) for the best dimer class (left), protomer 1 (middle) and protomer 2 (right) states. g) cNMP-binding site in the CNBD in protomer 1 map is displayed as grey mesh contoured at 4.7 σ, protein model is shown in purple, cAMP molecule in yellow, density corresponding to bound cAMP is displayed in magenta. h) Overlay of the best dimeric SpSLC9C1 structures in apo, cGMP-bound and cAMP-bound conformations. i) Overlay of the selected 3D classes (boxed in (d)), displaying the asymmetric movements of CTD between protomers. Class 3 is contoured at 1.3 σ and class 9 at 1.7 σ, respectively. j) Overlay of the two distinct protomer states displaying the largest conformational differences (see also Supplementary Video 2). Shown are refined masked maps contoured at 8.3 σ (protomer 1) and 8.4 σ (protomer 2).

Comment in

References

    1. Windler F, et al. The solute carrier SLC9C1 is a Na+/H+-exchanger gated by an S4-type voltage-sensor and cyclic-nucleotide binding. Nat. Commun. 2018;9:2809. doi: 10.1038/s41467-018-05253-x. - DOI - PMC - PubMed
    1. Wang D, King SM, Quill TA, Doolittle LK, Garbers DL. A new sperm-specific Na+/H+ exchanger required for sperm motility and fertility. Nat. Cell Biol. 2003;5:1117–1122. doi: 10.1038/ncb1072. - DOI - PubMed
    1. James ZM, Zagotta WN. Structural insights into the mechanisms of CNBD channel function. J. Gen. Physiol. 2018;150:225–244. doi: 10.1085/jgp.201711898. - DOI - PMC - PubMed
    1. Cavarocchi, E. et al. The sodium/proton exchanger SLC9C1 (sNHE) is essential for human sperm motility and fertility. Clin. Genet.10.1111/cge.13927 (2021). - PubMed
    1. Zhang Z, et al. Sodium-hydrogen-exchanger expression in human sperm and its relationship with semen parameters. J. Assist. Reprod. Genet. 2017;34:795–801. doi: 10.1007/s10815-017-0898-2. - DOI - PMC - PubMed

Publication types

MeSH terms

Substances