. 2023 Nov;623(7985):106-114.
doi: 10.1038/s41586-023-06630-3. Epub 2023 Oct 25.

Normative spatiotemporal fetal brain maturation with satisfactory development at 2 years

Affiliations

Normative spatiotemporal fetal brain maturation with satisfactory development at 2 years

Ana I L Namburete et al. Nature. 2023 Nov.

Abstract

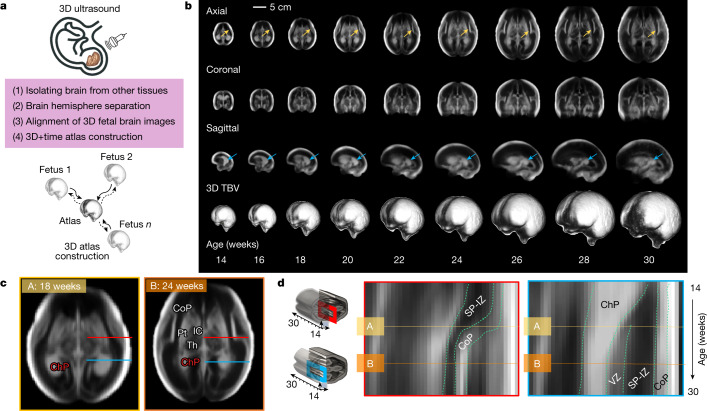
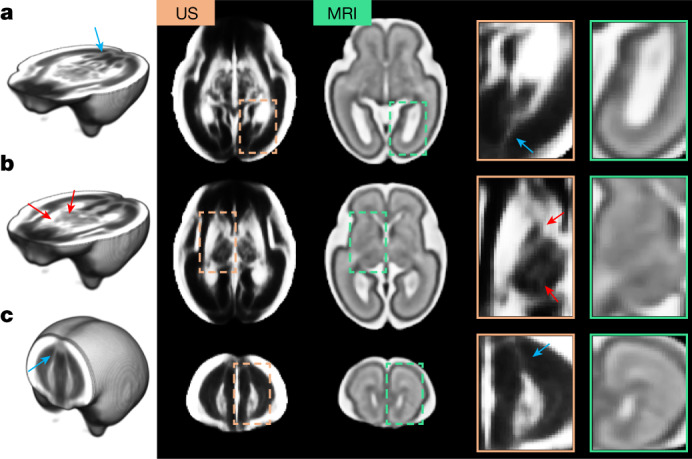
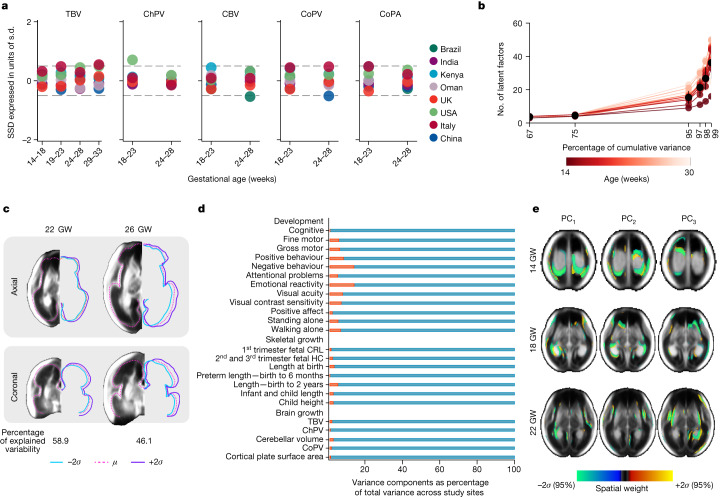
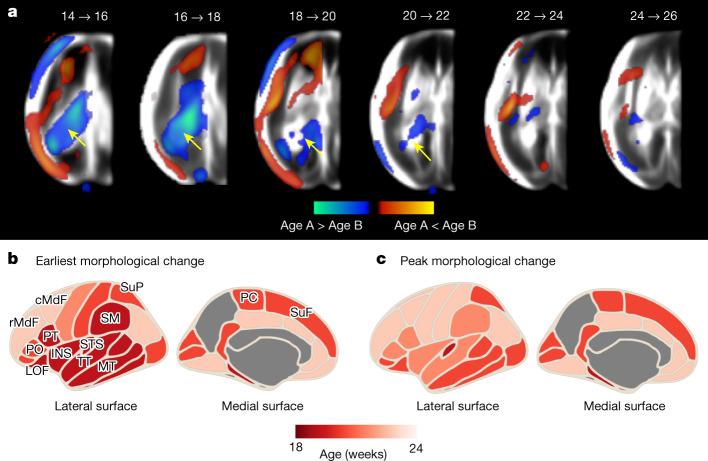
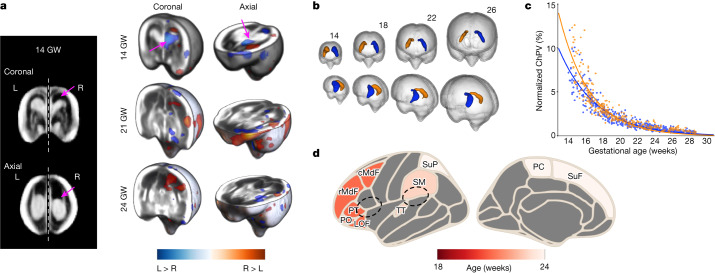
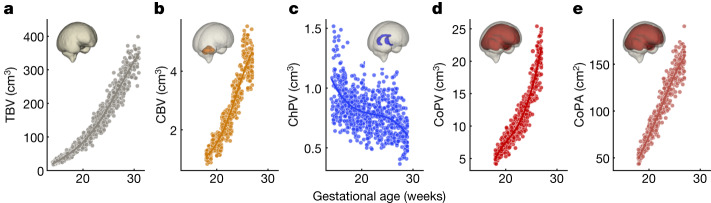
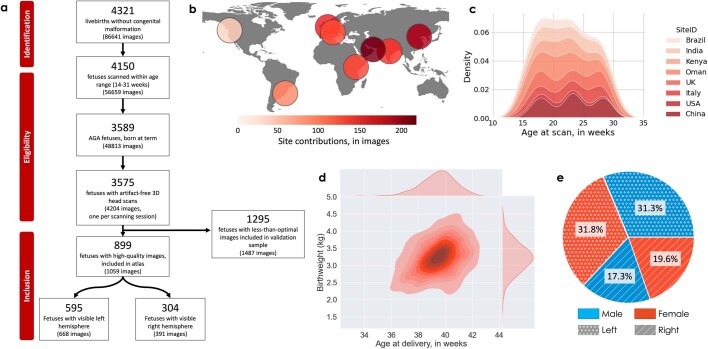
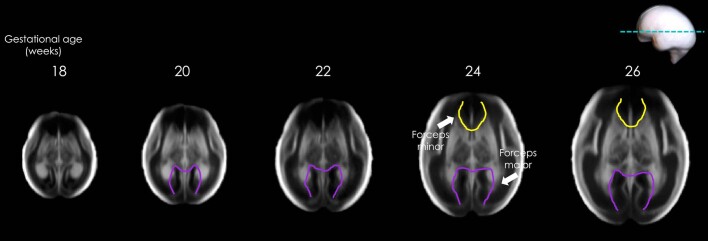
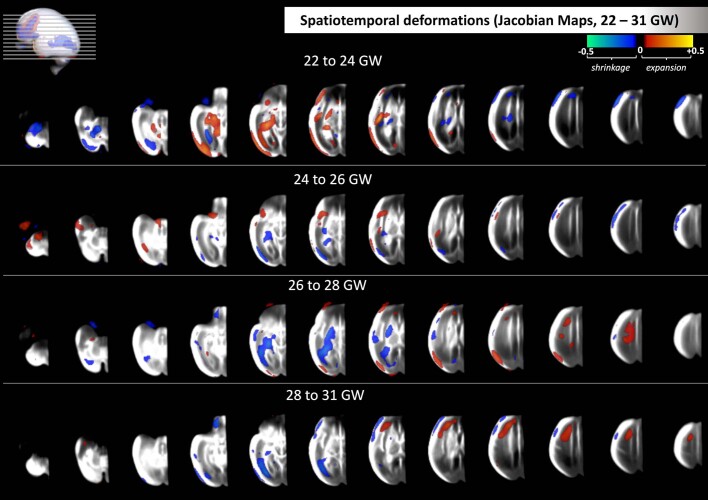
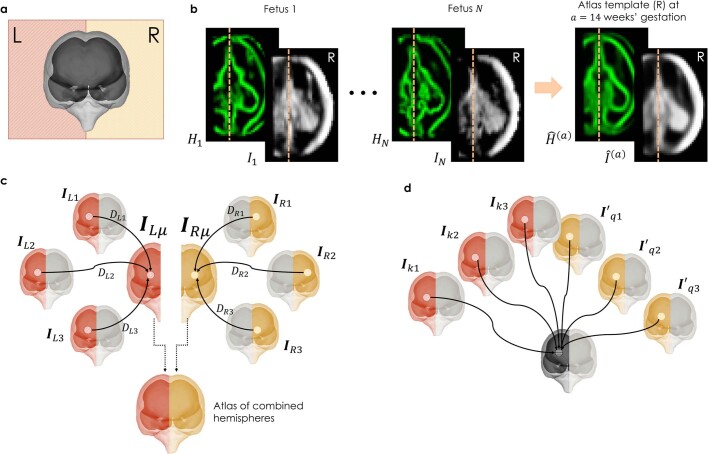
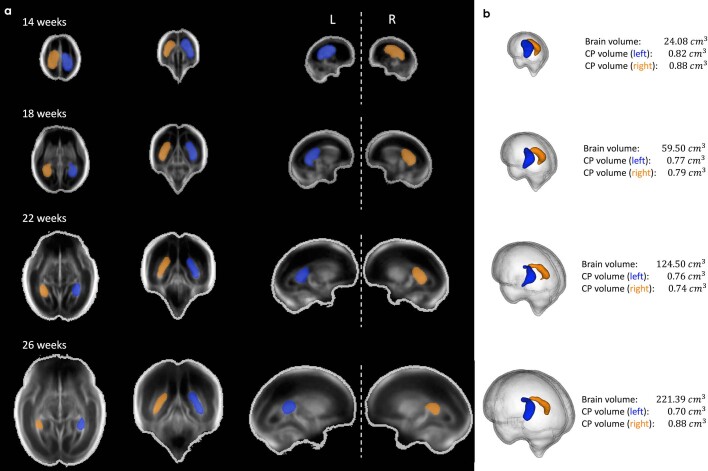
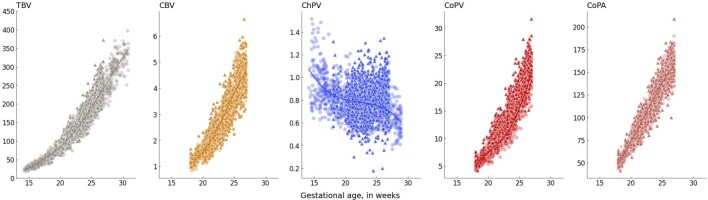
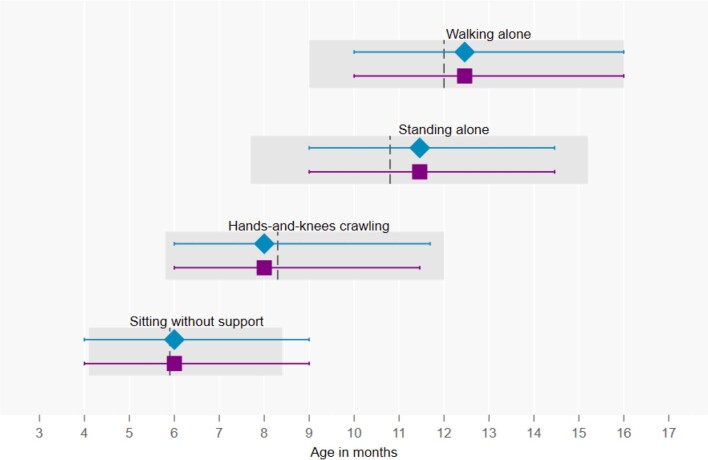
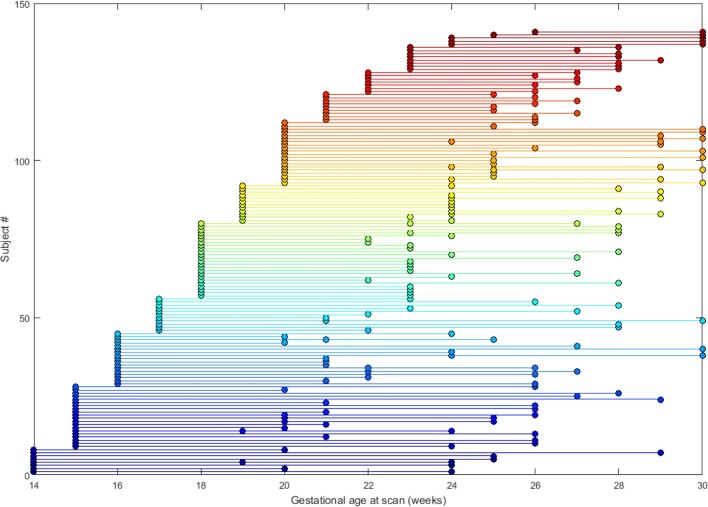
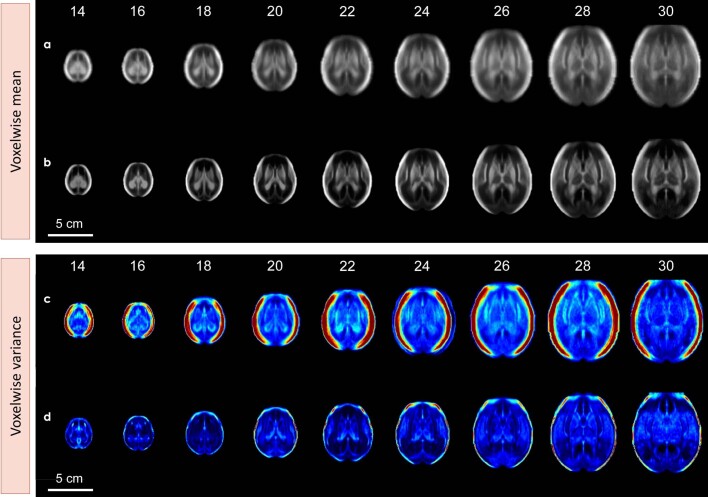
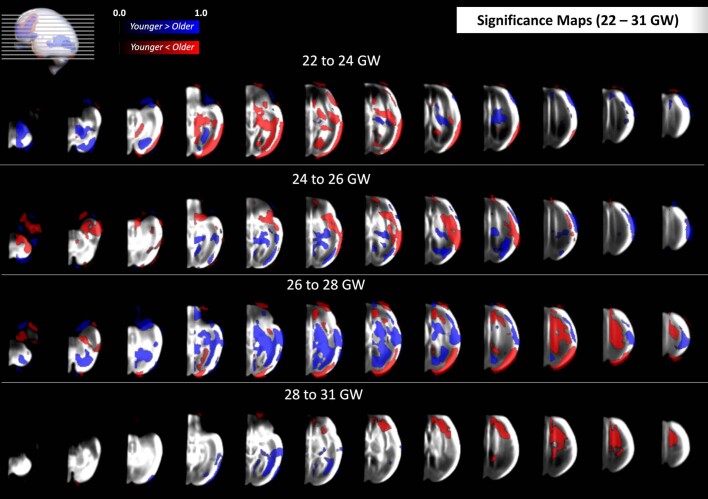
Maturation of the human fetal brain should follow precisely scheduled structural growth and folding of the cerebral cortex for optimal postnatal function1. We present a normative digital atlas of fetal brain maturation based on a prospective international cohort of healthy pregnant women2, selected using World Health Organization recommendations for growth standards3. Their fetuses were accurately dated in the first trimester, with satisfactory growth and neurodevelopment from early pregnancy to 2 years of age4,5. The atlas was produced using 1,059 optimal quality, three-dimensional ultrasound brain volumes from 899 of the fetuses and an automated analysis pipeline6-8. The atlas corresponds structurally to published magnetic resonance images9, but with finer anatomical details in deep grey matter. The between-study site variability represented less than 8.0% of the total variance of all brain measures, supporting pooling data from the eight study sites to produce patterns of normative maturation. We have thereby generated an average representation of each cerebral hemisphere between 14 and 31 weeks' gestation with quantification of intracranial volume variability and growth patterns. Emergent asymmetries were detectable from as early as 14 weeks, with peak asymmetries in regions associated with language development and functional lateralization between 20 and 26 weeks' gestation. These patterns were validated in 1,487 three-dimensional brain volumes from 1,295 different fetuses in the same cohort. We provide a unique spatiotemporal benchmark of fetal brain maturation from a large cohort with normative postnatal growth and neurodevelopment.


Conflict of interest statement

J.A.N. and A.T.P. are Senior Scientific Advisers of Intelligent Ultrasound but the company has no financial or intellectual property links with the research described in this paper and the described work is entirely based on their academic work. We declare that all the other authors have no competing interests as defined by Nature Research, or other interests that might be perceived to influence the results and/or discussion reported in this paper.

Figures

Fig. 1
Fig. 1. US-derived, normative atlas of the fetal brain with satisfactory growth and neurodevelopment up to 2 years of age.
a, Summary of image processing steps for atlas construction. A 3D image of the fetal head is collected using an US probe and, after a series of image processing steps (including brain extraction, hemispheric separation and brain alignment), each weekly atlas template is constructed using groupwise registration. b, 3D + time atlas templates depicting the fetal brain at even gestational weeks for the axial (top), coronal (middle) and sagittal (bottom) views. c, Axial views of the fetal brain at 18 (A) and 24 (B) weeks’ gestation. d, Kymograph showing the emergence and thickness changes of laminar tissues of the cerebral mantle at two locations (that is, the two gestational timepoints are marked by horizontal lines A and B). Horizontal lines in c correspond to the two cross-sectional locations of the kymograph: red at the level of the thalamus and postcentral gyrus; blue at the level of the ChP. IC, internal capsule; Th. thalamus; Pt. putamen; CB, cerebellum; SP, subplate; IZ, intermediate zone and VZ, ventricular zone (or germinal matrix).
Fig. 2
Fig. 2. Comparison between US and MRI atlases of the fetal brain.
ac, Age-matched templates shown at two axial views: level of the ventricles (a) and level of the thalami (b), and one coronal view (c). Structures colocalize in both modalities, but US templates showed sharper tissue boundaries in the subcortical grey matter areas (red arrows). Blue arrows indicate possible white matter fibre bundles in the US atlas, which are not visible in the MRI atlas. Note that the contrast of the US atlas has been edited to highlight the key structures.
Fig. 3
Fig. 3. Structural variability among normative fetuses with satisfactory growth and neurodevelopment until 2 years of age.
a, SSD for TBV (n = 1,059, 14–31 weeks’ gestation), ChPV (n = 851, 14–31 weeks’ gestation), CBV (n = 534, 18–26 weeks’ gestation), CoPV (n = 534, 18–26 weeks’ gestation) and CoPA (n = 534, 18–26 weeks’ gestation). SSD calculated by: (site mean of the given structure minus all sites’ mean of the same structure)/all sites’ s.d., all values across all gestational ages of the study. b, Scree plot showing the structural variability explained against the number of latent factors per gestational week, computed on the basis of PCA and tensor-based morphometry. c, Effect of changing the CoP with the first latent factor by +2 s.d. (in purple), mean shape (in dashed pink) and −2 s.d.s (in blue) at 22 and 26 weeks’ gestation, illustrating that size accounts for the most prominent structural differences across the fetal population. d, Variance component analysis of developmental, skeletal and brain growth (evaluated in this study). Red bars are the percentage of total variance explained by between-site variability for each growth measure. e, Illustrating the regions that explain 60.7, 56.5 and 60.1% of shape variability across the fetal population at 14, 18 and 22 weeks’ gestation, respectively, after size correction. GW, weeks’ gestation and PC, principal component.
Fig. 4
Fig. 4. Timing of the spatiotemporal changes among normative fetuses with satisfactory growth and neurodevelopment until 2 years of age.
a, Significant regions derived by the FSL RANDOMISE non-parametric permutation test (family-wise error-corrected, P < 0.05), overlaid on the US atlas templates for each 2-week gestational age interval. ChP shrinkage is indicated by the yellow arrow. b,c, Age and cortical regions at which morphological changes were first detected (b) or showed peak morphological change (c). Cortical surface maps were created using the Python-based ggseg package. The parcellation-based results do not apply before 18 weeks’ gestation.
Fig. 5
Fig. 5. Earliest detection of structural fetal brain hemispheric asymmetries.
a, 3D reconstructions at 14, 21 and 24 weeks’ gestation with the log-Jacobian maps overlayed on the US atlas template. Blue indicates regions where the left hemisphere is larger than the right (L > R; pink arrows) and vice versa (R > L). b, Physical configuration of the fetal ChP, shown at 4 week intervals starting from 14 weeks’ gestation. Average ChP shape for the left (blue) and right (orange) hemispheres are shown separately. c, Normalized ChPV, highlighting the rate of ChP shrinkage relative to TBV. d, Visual summary of the population average of cortical asymmetries. Colours indicate the gestational age at which asymmetry was first detected. Dashed lines indicate Broca’s and Wernicke’s areas. The parcellation-based results do not apply before 18 weeks’ gestation.
Fig. 6
Fig. 6. Distribution of fetal brain growth measures.
ae, Normative fetal trajectories for TBV (a), CBV (b), ChPV (c), CoPV (d) and CoPA (e).
Extended Data Fig. 1
Extended Data Fig. 1. Summary statistics of fetal subjects from the INTERGROWTH-21st FGLS included in the present study.
(a) Flowchart summarizing the inclusion criteria, the number of fetuses, and number of scans remaining at each step. (b) World map displaying the contribution of each of the eight countries to the image samples included in the fetal brain atlas. (c) Density plot highlighting the week-by-week contribution of each country. (d) Bivariate Gaussian plot showing the distribution of subjects by birthweight (kg) and gestational age at delivery (weeks). (e) Proportion of scans from male and female fetuses included in the present study, and their contributions to the construction of the left and right cerebral atlases.
Extended Data Fig. 2
Extended Data Fig. 2. White matter fibre bundles.
Evidence of visibility of possible white matter fibre bundles, as described in Jaimes et al. (Hum Brain Mapp. 41:3177–3185, 2020) (forceps minor in yellow; forceps major in purple).
Extended Data Fig. 3
Extended Data Fig. 3. Spatial deformation maps from 14 to 22 weeks’ gestation.
The Jacobian maps highlight the regions undergoing expansion (warm shades) or shrinkage (cool shades) within each two-week interval between 14- and 22-weeks’ gestation. Deformation maps are calculated as the difference between the mean log-Jacobian maps of each age group). This figure complements the single-slice views shown in Fig. 4 of the main text.
Extended Data Fig. 4
Extended Data Fig. 4. Spatial deformation maps from 22 to 31 weeks’ gestation.
The Jacobian maps highlight the regions undergoing expansion (warm shades) or shrinkage (cool shades) within each two-week interval between 22- and 31-weeks’ gestation. Deformation maps are calculated as the difference between the mean log-Jacobian maps of each age group). This figure complements the single-slice views shown in Fig. 4 of the main text.
Extended Data Fig. 5
Extended Data Fig. 5. Image data preprocessing for atlas construction and statistical analysis. The image processing steps are shown only for the right hemisphere, but the same process was carried out for the left hemisphere.
(a) Individual US scans were separated into left (L) and right (R) cerebral hemispheres, and only the hemisphere distal to the US probe was kept for subsequent analysis. The image processing steps are shown only for the right hemisphere but the same process was carried out for the left hemisphere. (b) Examples of brain axial slices from two individuals at 14 weeks’ gestation (in grayscale), and the edge map used to enhance features in the atlas construction step (in green). The resulting atlas template is shown on the right-hand side. (c) Separate atlas templates were constructed for each cerebral hemisphere using groupwise multi-channel registration, and combined for visualization purposes. Arrows represent diffeomorphic mapping between the atlas and each individual image. (d) Illustration of image orientation for statistical analysis (e.g. tensor-based volumetry to detect regions of asymmetry or temporal change). For asymmetry analysis, k=L and q=R in reference to the mirrored right hemispheres. For temporal change analysis, k=a and q=a+2, in reference to the gestational ages, in weeks, at the start (a) and end (a+2) of the interval.
Extended Data Fig. 6
Extended Data Fig. 6. Choroid plexus asymmetry.
Mean total brain volume, left and right choroid plexus volumes derived from the fetal brain atlas at four gestational timepoints. (a) Axial (left column), coronal (middle), and sagittal (right) views shown, overlayed with segmentation maps of the choroid plexus (left hemisphere shown in blue; right shown in yellow). (b) 3D rendering of choroid plexus segmentations, relative to total brain volume.
Extended Data Fig. 7
Extended Data Fig. 7. Growth trajectories for total brain volume (TBV), cerebellar volume (CBV), choroid plexus volume (ChPV), cortical plate volume (CoPV), and cortical surface area (CoPA).
For each structure, the raw data points are shown for the within-sample data (circles; used for atlas construction), and the out-of-sample data (triangles; used for validation), plotted against gestational age (x-axis). The y-axes are scaled to the units of the corresponding volumetric measure (cm3 for volume, cm2 for surface area). Growth trajectories of the mean (solid line) are also shown.
Extended Data Fig. 8
Extended Data Fig. 8. Median age of achievement (3rd and 97th centiles) of four gross motor development milestones.
Data are for infants who were included in the present study (blue) and those who were included in the INTERGROWTH-21st Fetal Growth Standards (purple). For comparison, the 3rd and 97th percentiles of the World Health Organization windows of achievement for the same milestones are presented in grey (with the median shown as a vertical line).
Extended Data Fig. 9
Extended Data Fig. 9. Number of subjects with longitudinal scans.
Of the 899 subjects included in the atlas, 141 of them (15.7%) were included more than once (but always at a different gestational week). None of the subjects was included in successive weeks (separated by approx. 4-5 weeks).
Extended Data Fig. 10
Extended Data Fig. 10. Voxelwise mean and variance maps.
before (a, c) and after (b, d) the non-rigid registration step shown for a mid-axial slice (at the level of the thalami) from 14 to 30 weeks’ gestation.
Extended Data Fig. 11
Extended Data Fig. 11. Regions undergoing significant morphological changes from 14 to 22 weeks’ gestation.
Statistical maps from our non-parametric analysis of temporal change, overlayed on a set of axial views from bottom (near the cerebellum) to top of the cerebral space. Maps highlight voxel clusters that survived the conservative threshold of p<0.05, shown here for two-week intervals between 14- and 22-weeks’ gestation. Red indicates regions in which the relative (normalised) volume is greater in the younger subgroup (a) than in the older subgroup (a+2), and vice-versa for blue regions. This figure supports results shown in Fig. 4 of the main text.
Extended Data Fig. 12
Extended Data Fig. 12. Regions undergoing significant morphological changes from 22 to 31 weeks’ gestation.
Statistical maps from our non-parametric analysis of temporal change, overlayed on a set of axial views from bottom (near the cerebellum) to top of the cerebral space. Maps highlight voxel clusters that survived the conservative threshold of p<0.05, shown here for two-week intervals between 22- and 31-weeks’ gestation. Red indicates regions in which the relative (normalised) volume is greater in the younger subgroup (a) than in the older subgroup (a+2), and vice-versa for blue regions. This figure supports results shown in Fig. 4 of the main text.

References

    1. Garel C, Chantrel E, Elmaleh M, Brisse H, Sebag G. Fetal MRI: normal gestational landmarks for cerebral biometry, gyration and myelination. Childs Nerv. Syst. 2003;19:422–425. doi: 10.1007/s00381-003-0767-4. - DOI - PubMed
    1. Villar J, et al. The likeness of fetal growth and newborn size across non-isolated populations in the INTERGROWTH-21st Project: the Fetal Growth Longitudinal Study and Newborn Cross-Sectional Study. Lancet Diabetes Endocrinol. 2014;2:781–792. doi: 10.1016/S2213-8587(14)70121-4. - DOI - PubMed
    1. de Onis M, Habicht JP. Anthropometric reference data for international use: recommendations from a World Health Organization Expert Committee. Am. J. Clin. Nutr. 1996;64:650–658. doi: 10.1093/ajcn/64.4.650. - DOI - PubMed
    1. Villar J, et al. The satisfactory growth and development at 2 years of age of the INTERGROWTH-21st Fetal Growth Standards cohort support its appropriateness for constructing international standards. Am. J. Obstet. Gynecol. 2018;218:S841–S854 e842. doi: 10.1016/j.ajog.2017.11.564. - DOI - PMC - PubMed
    1. Villar J, et al. Neurodevelopmental milestones and associated behaviours are similar among healthy children across diverse geographical locations. Nat. Commun. 2019;10:511. doi: 10.1038/s41467-018-07983-4. - DOI - PMC - PubMed

Publication types

MeSH terms