. 2023 Nov;623(7987):625-632.
doi: 10.1038/s41586-023-06676-3. Epub 2023 Oct 25.

Disruption of sugar nucleotide clearance is a therapeutic vulnerability of cancer cells

Affiliations

Disruption of sugar nucleotide clearance is a therapeutic vulnerability of cancer cells

Mihir B Doshi et al. Nature. 2023 Nov.

Abstract

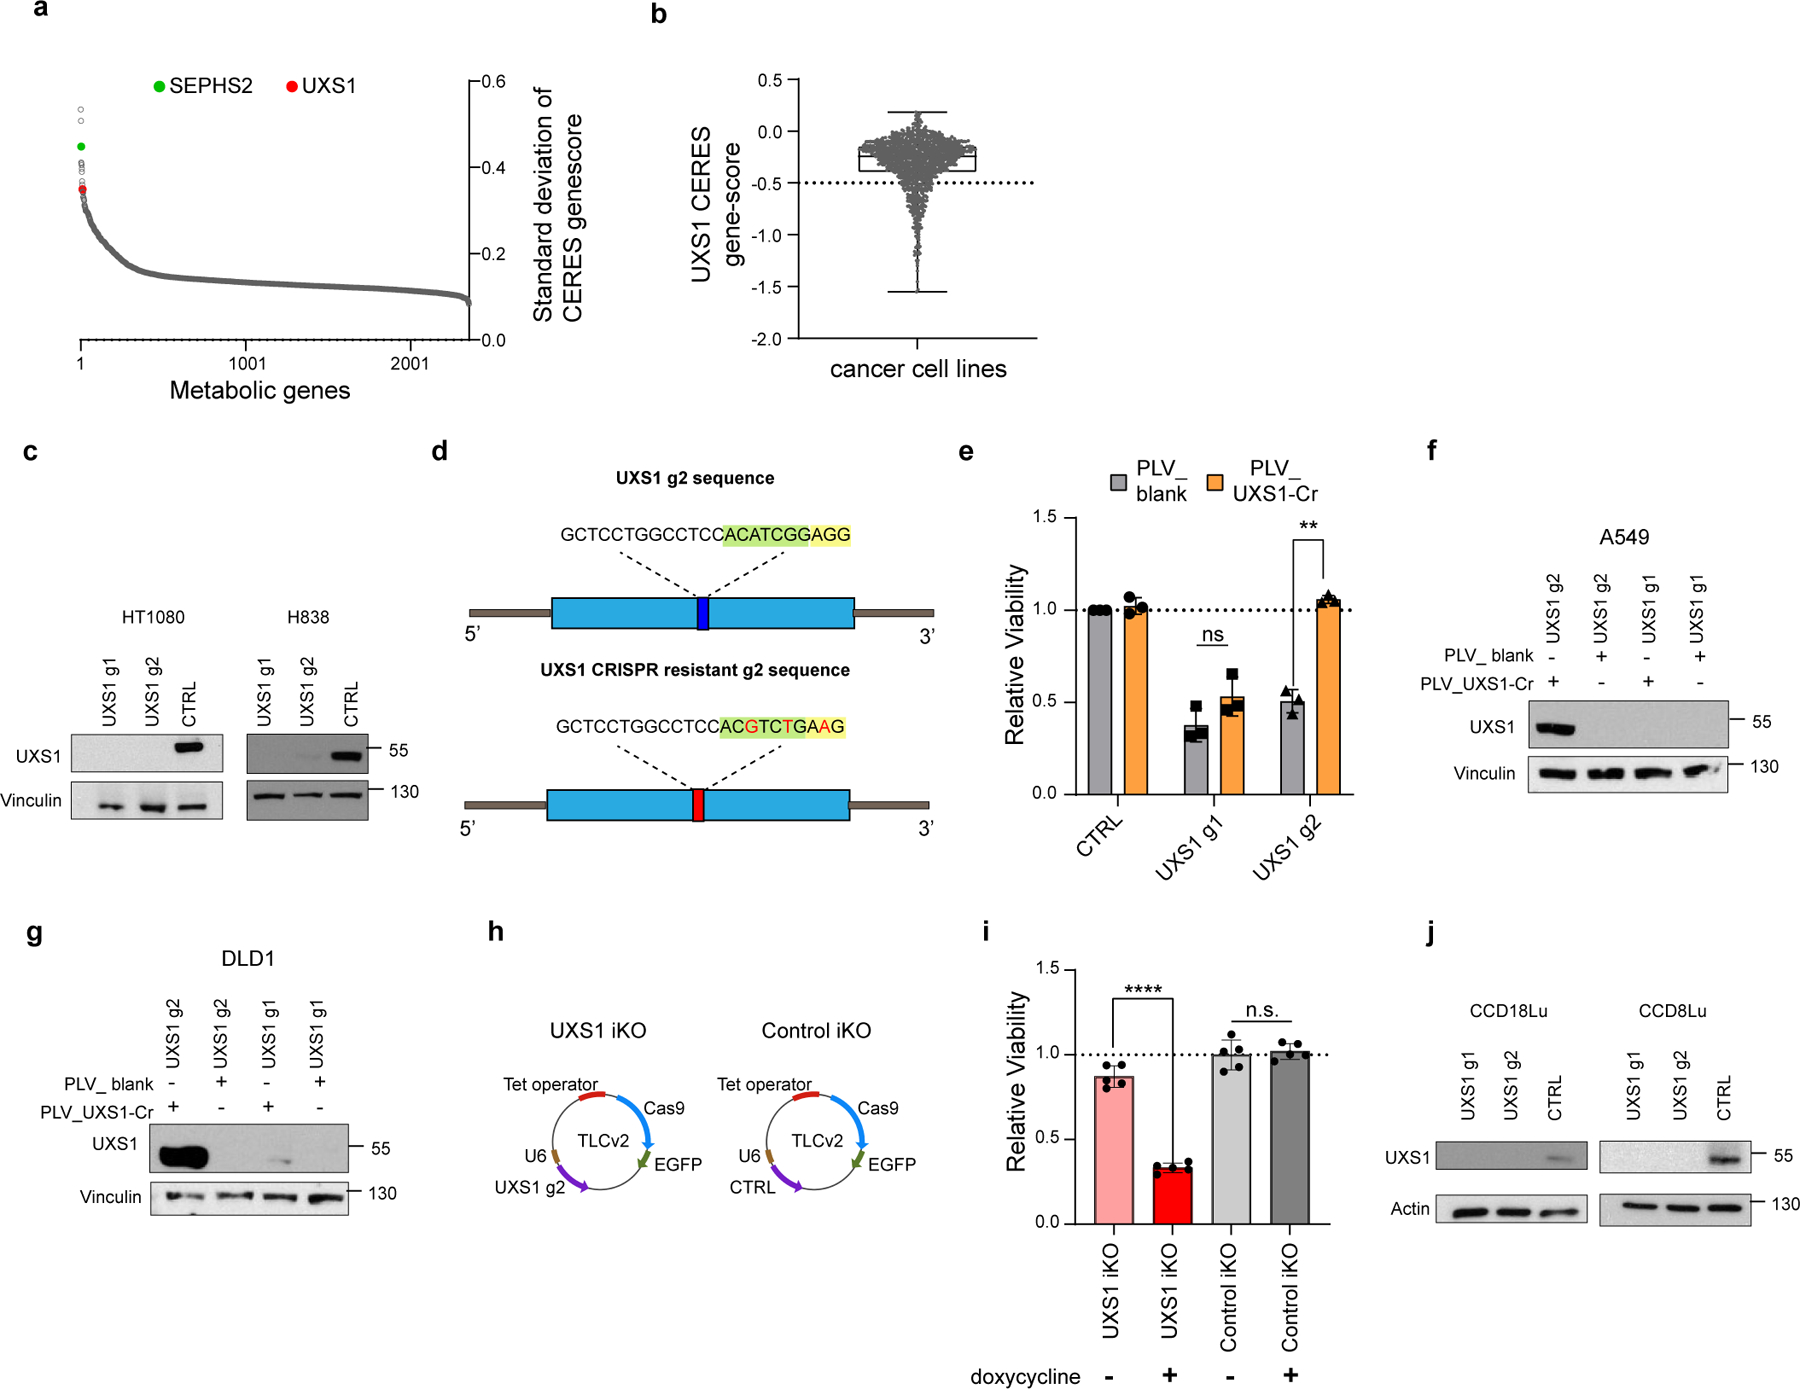
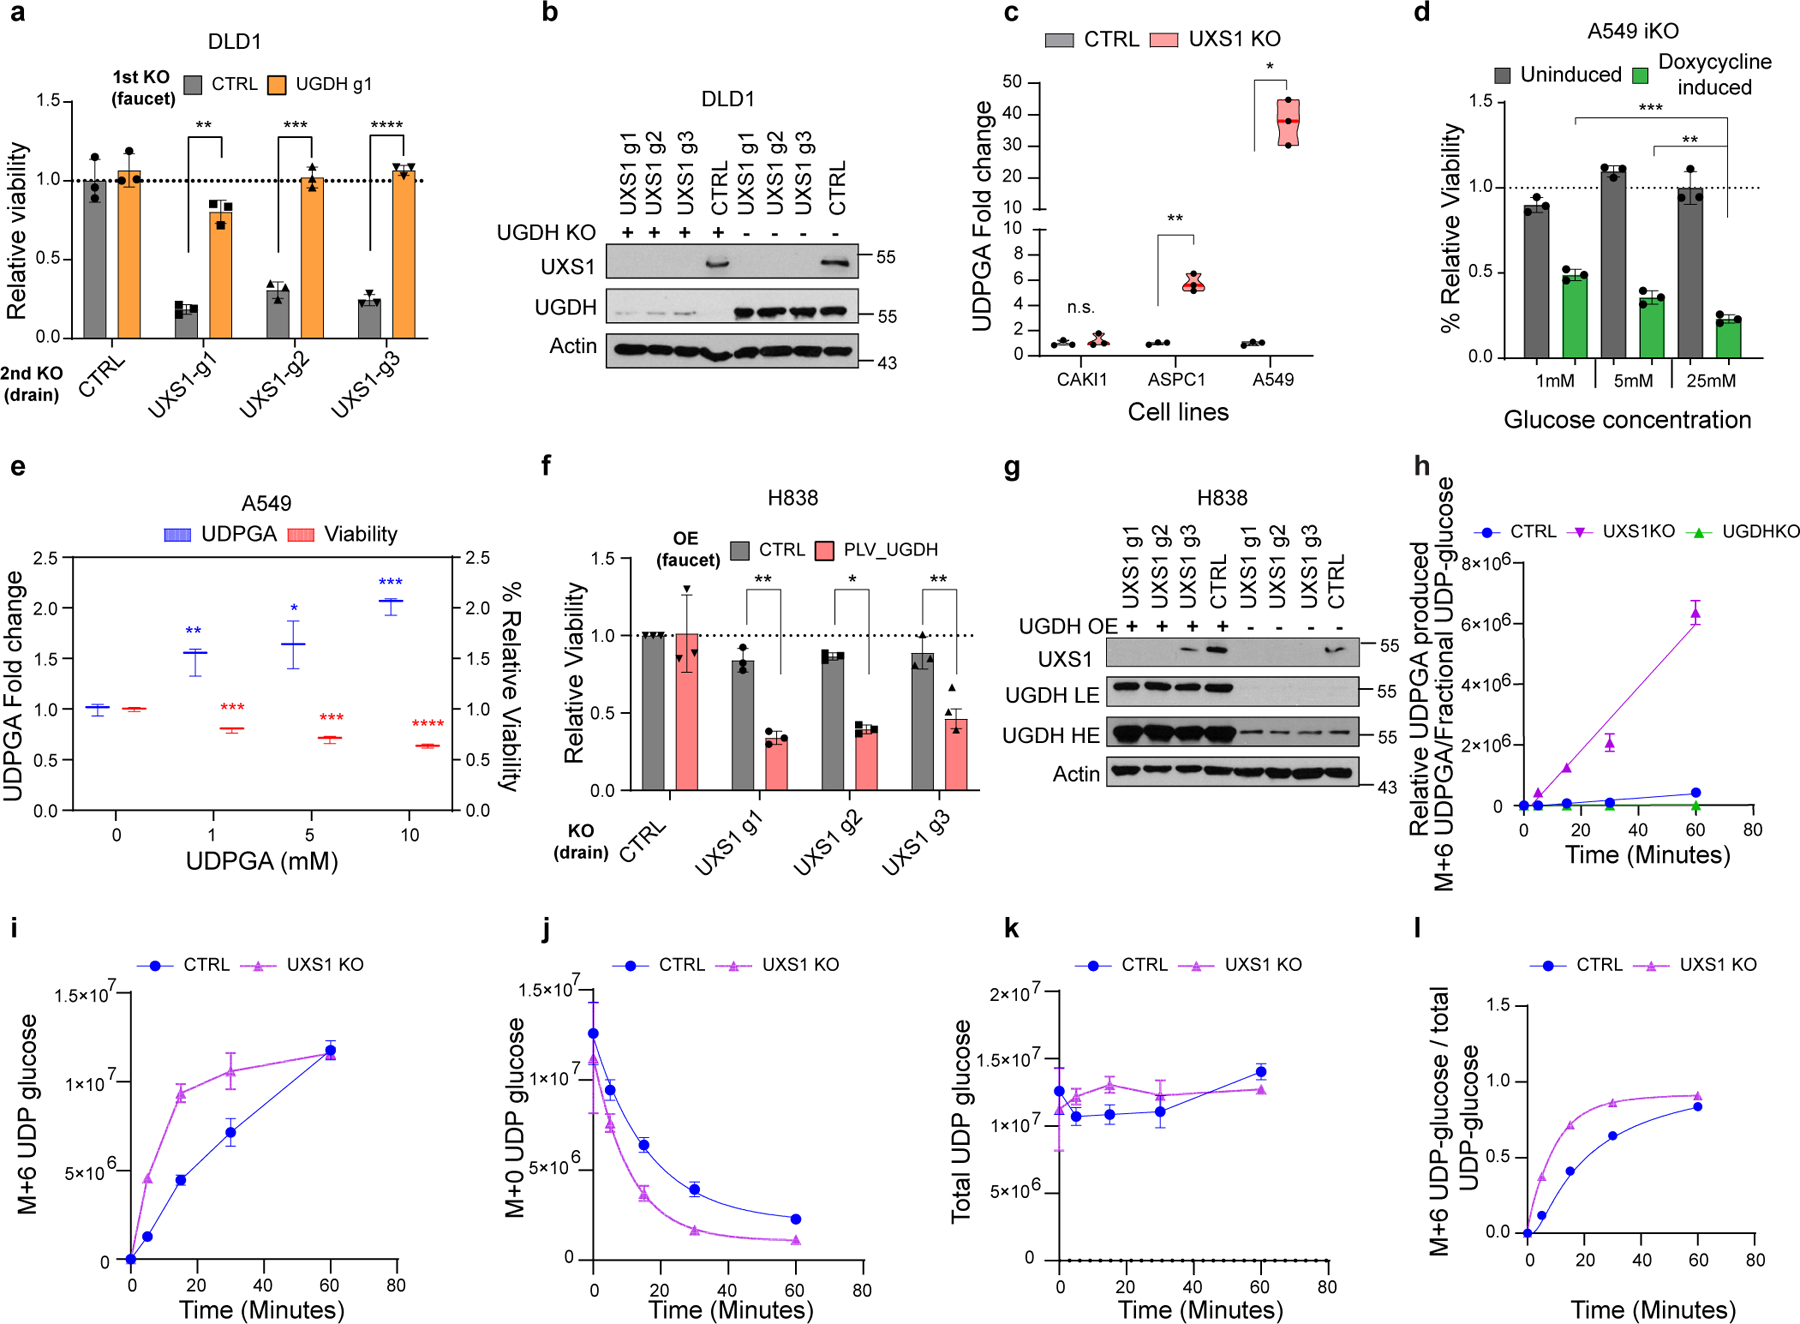
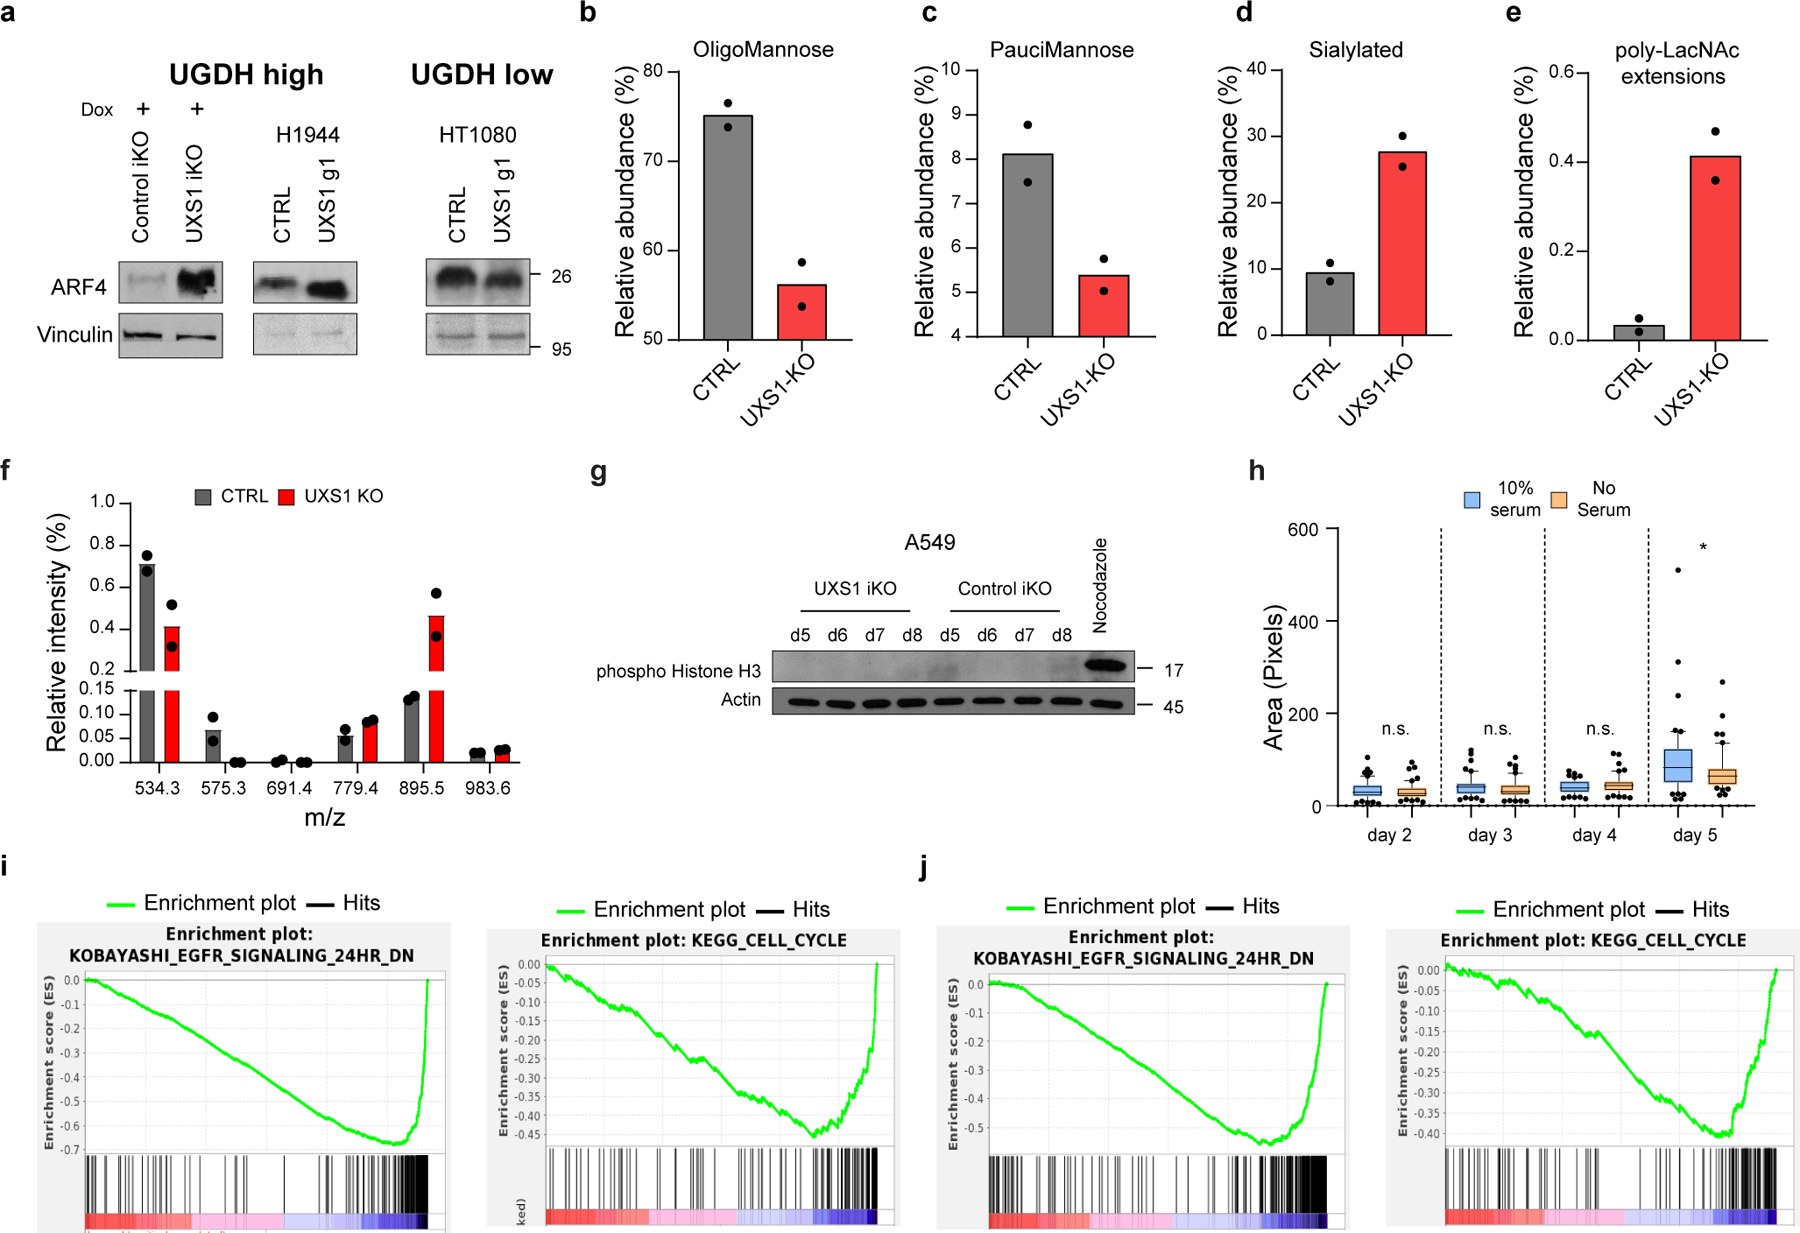
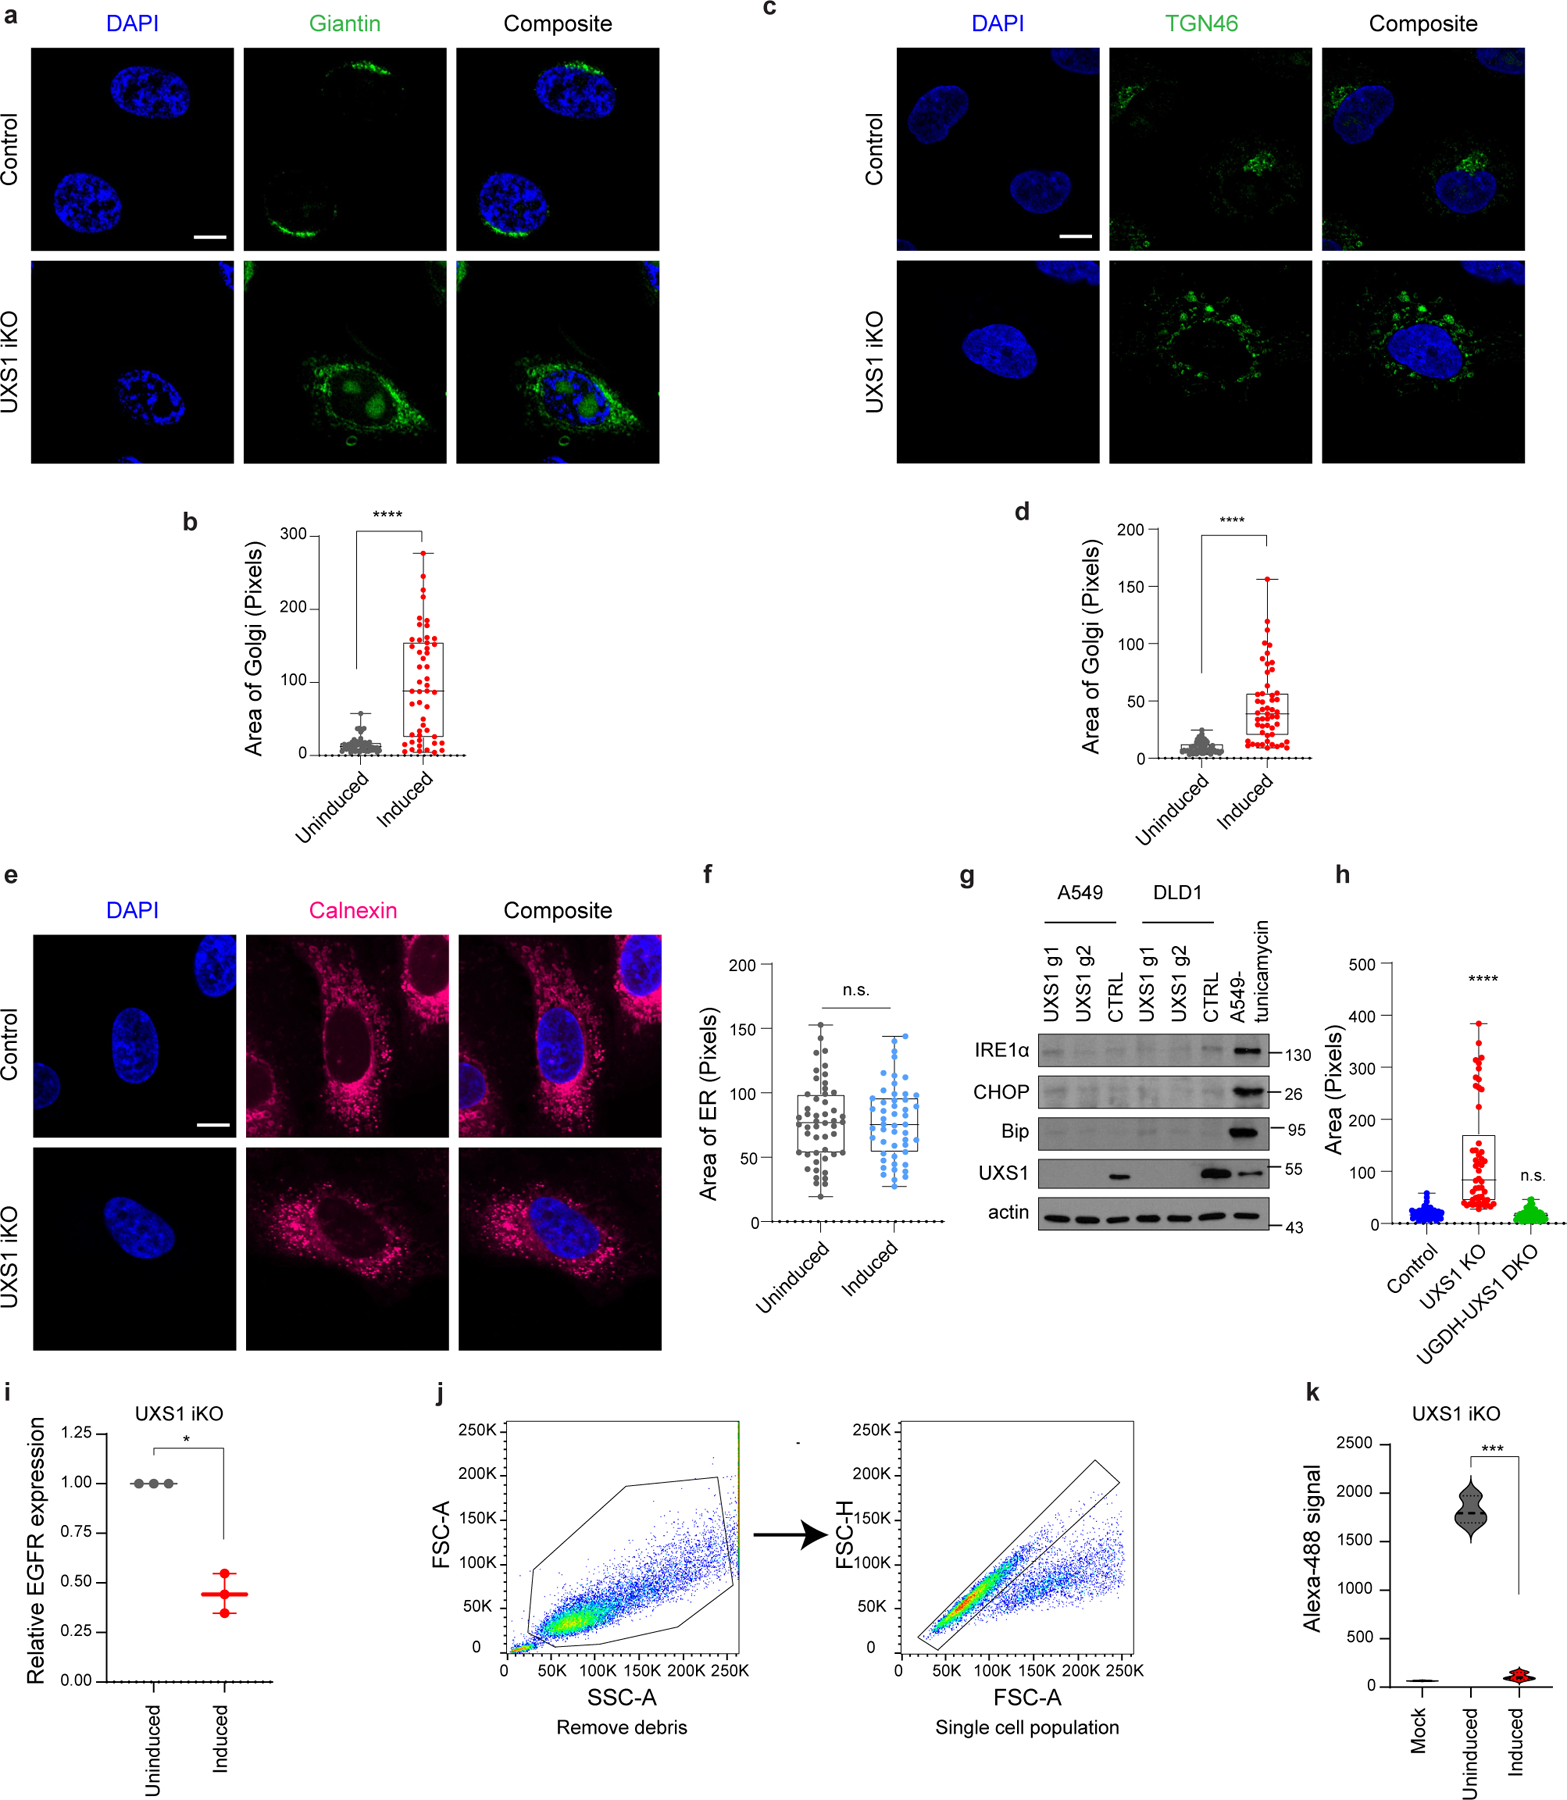
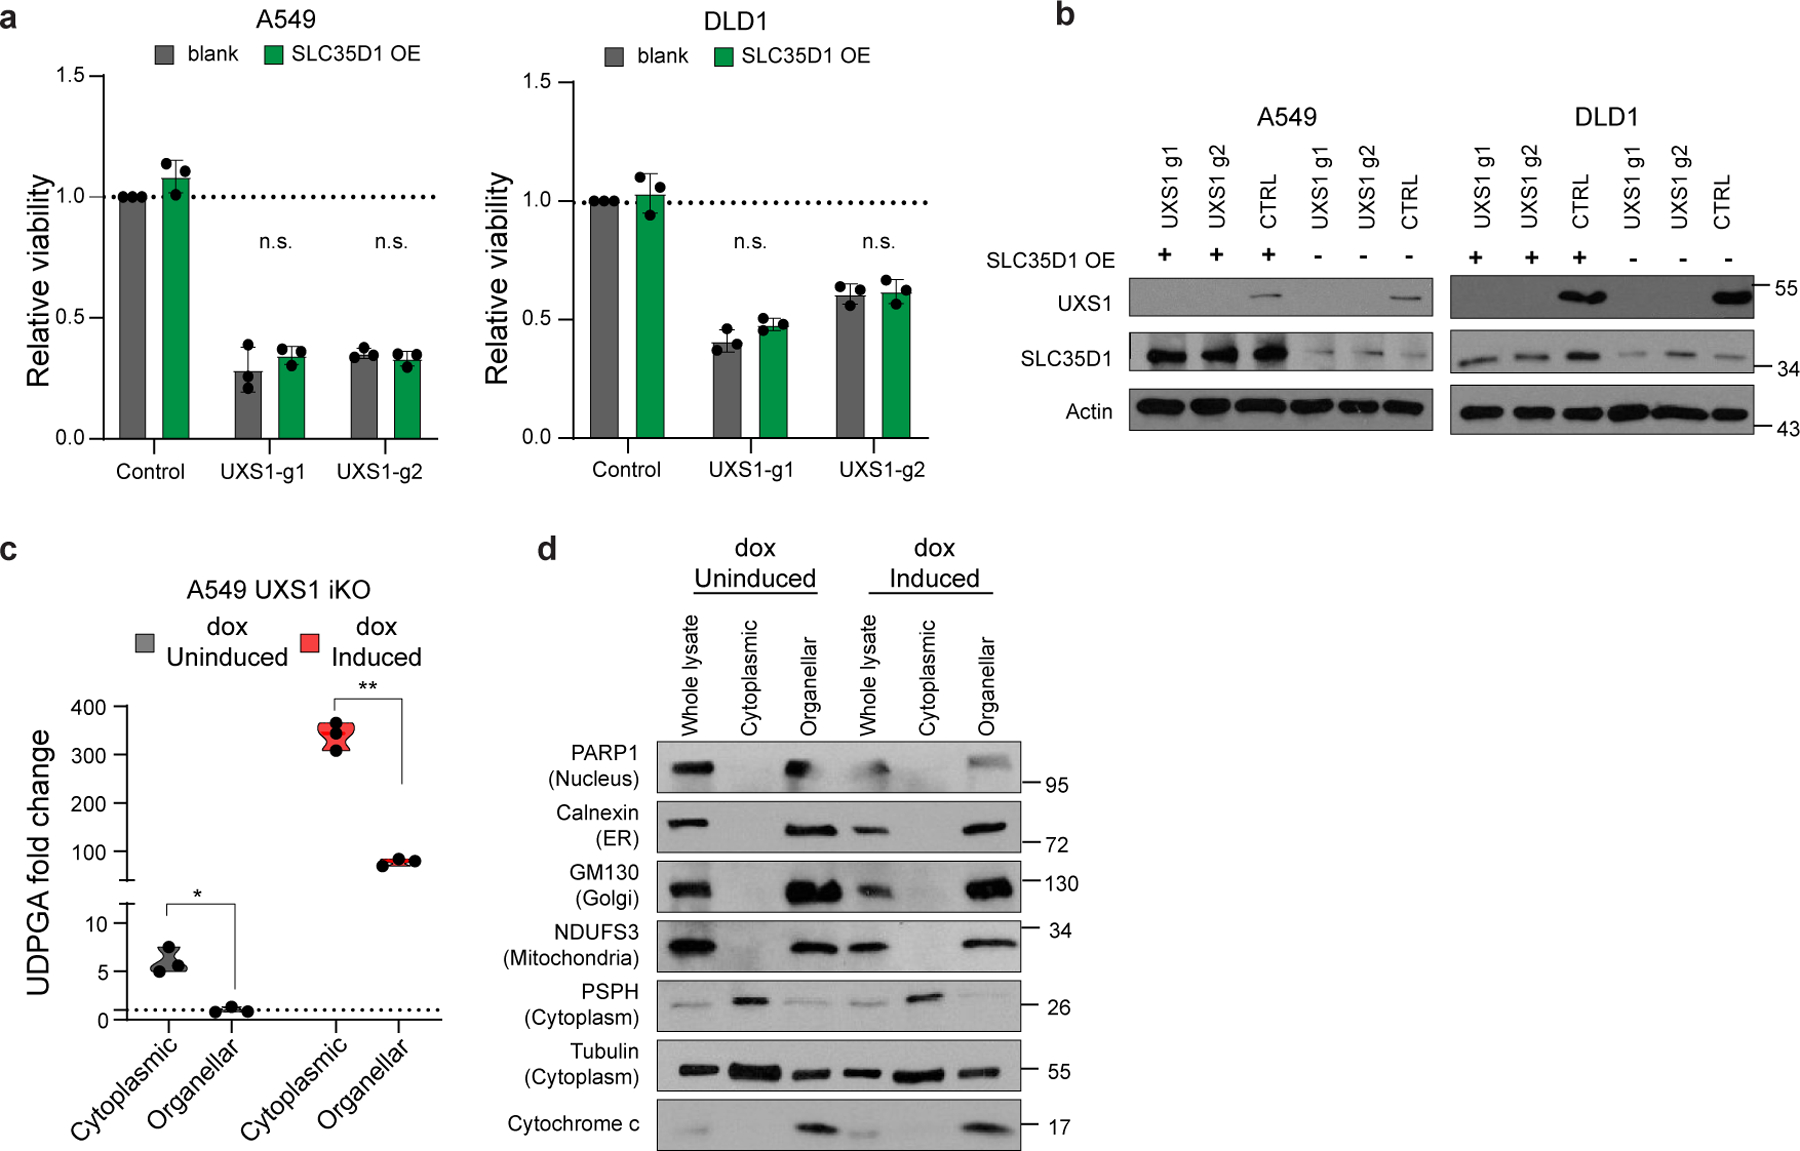
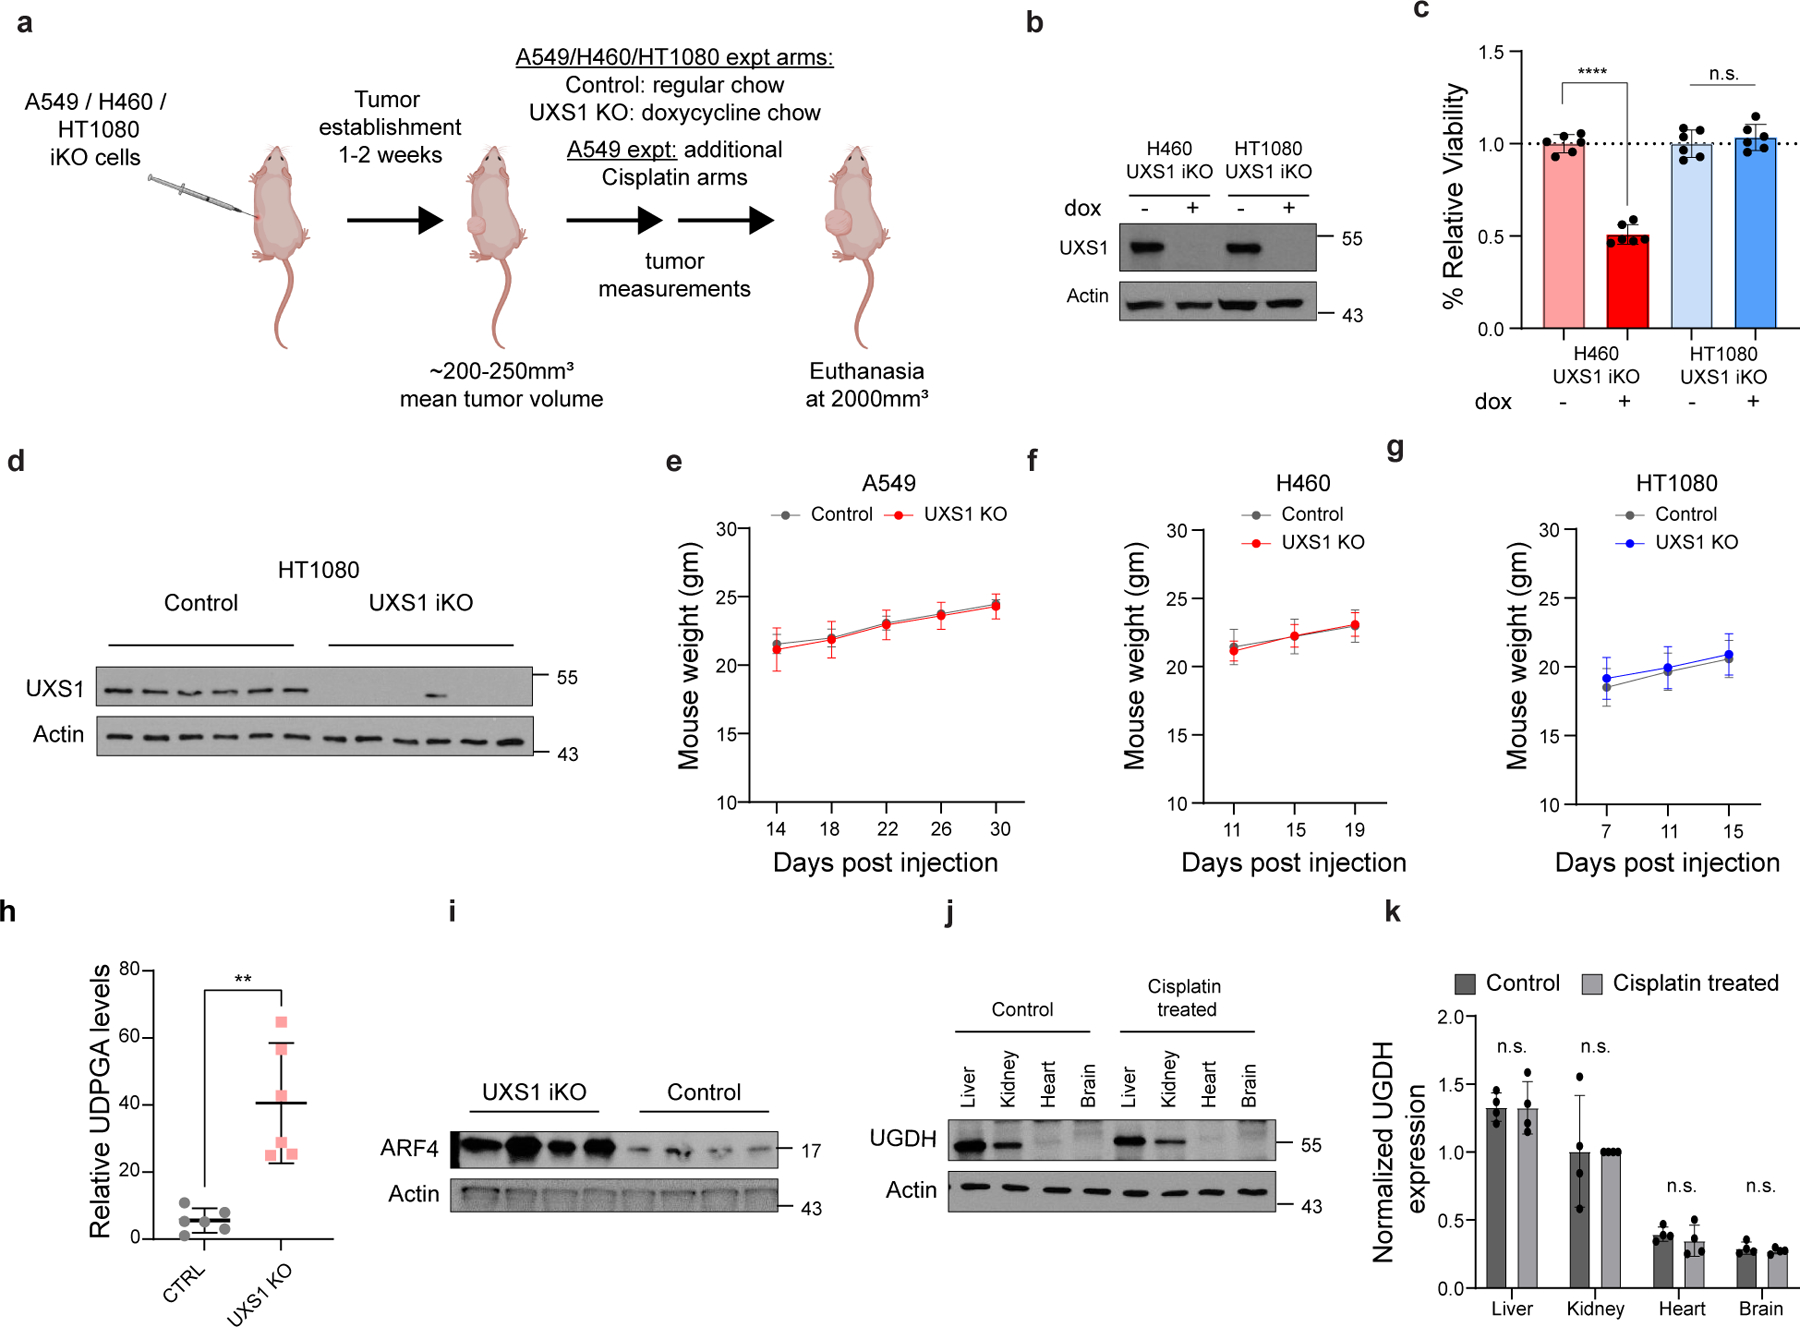
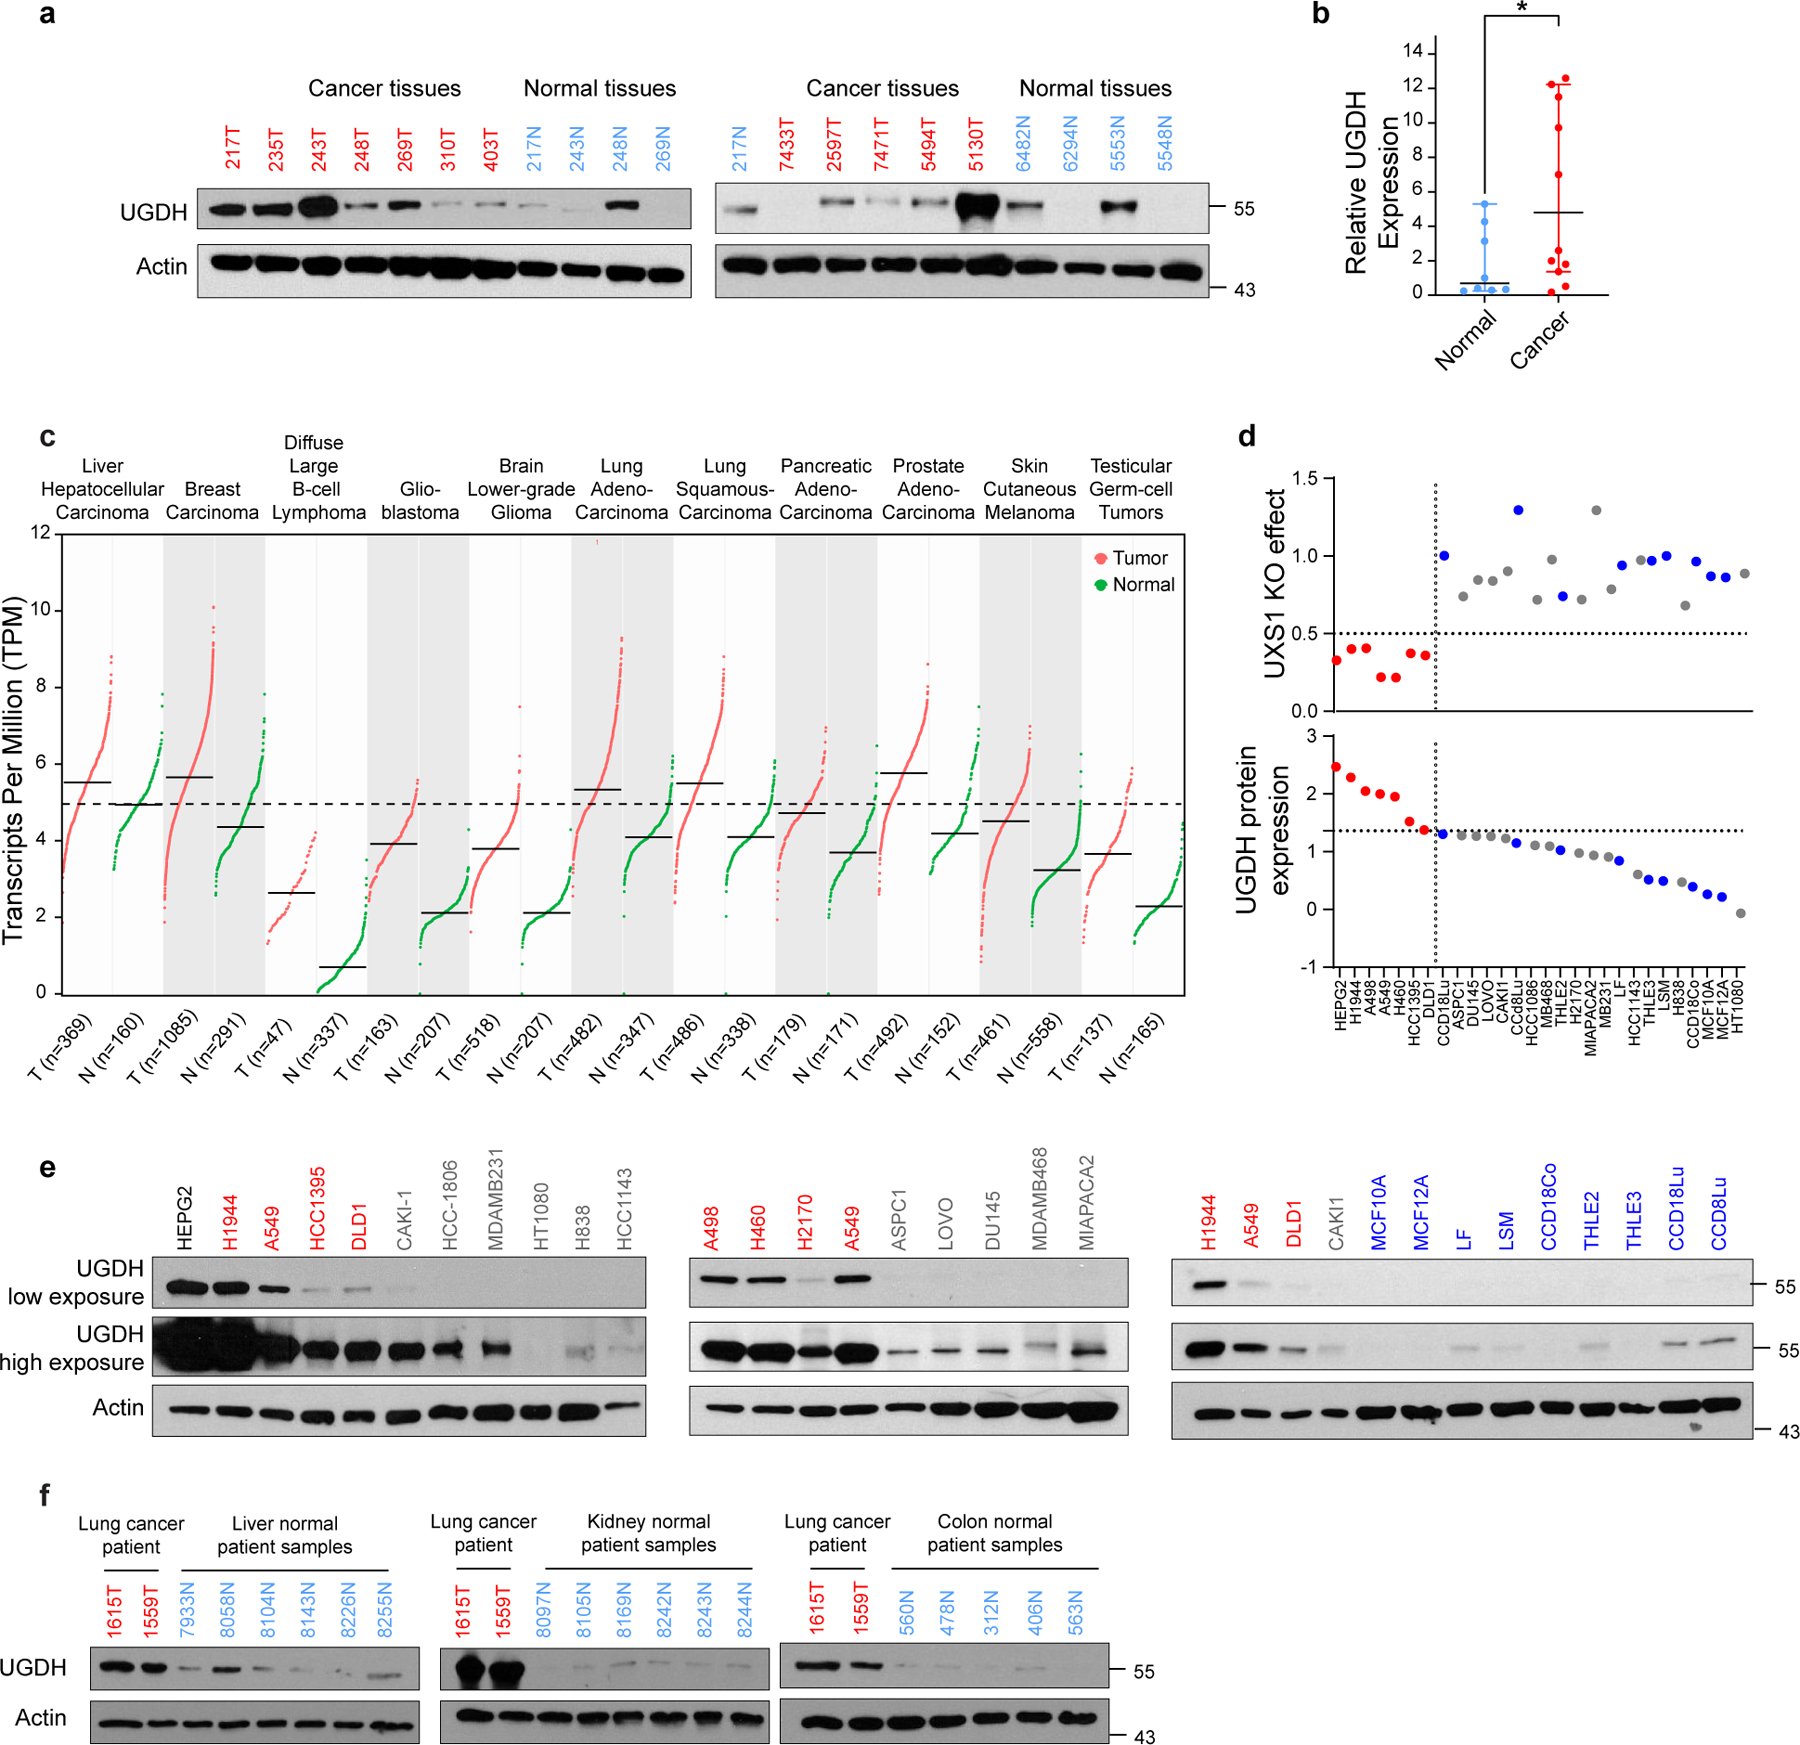
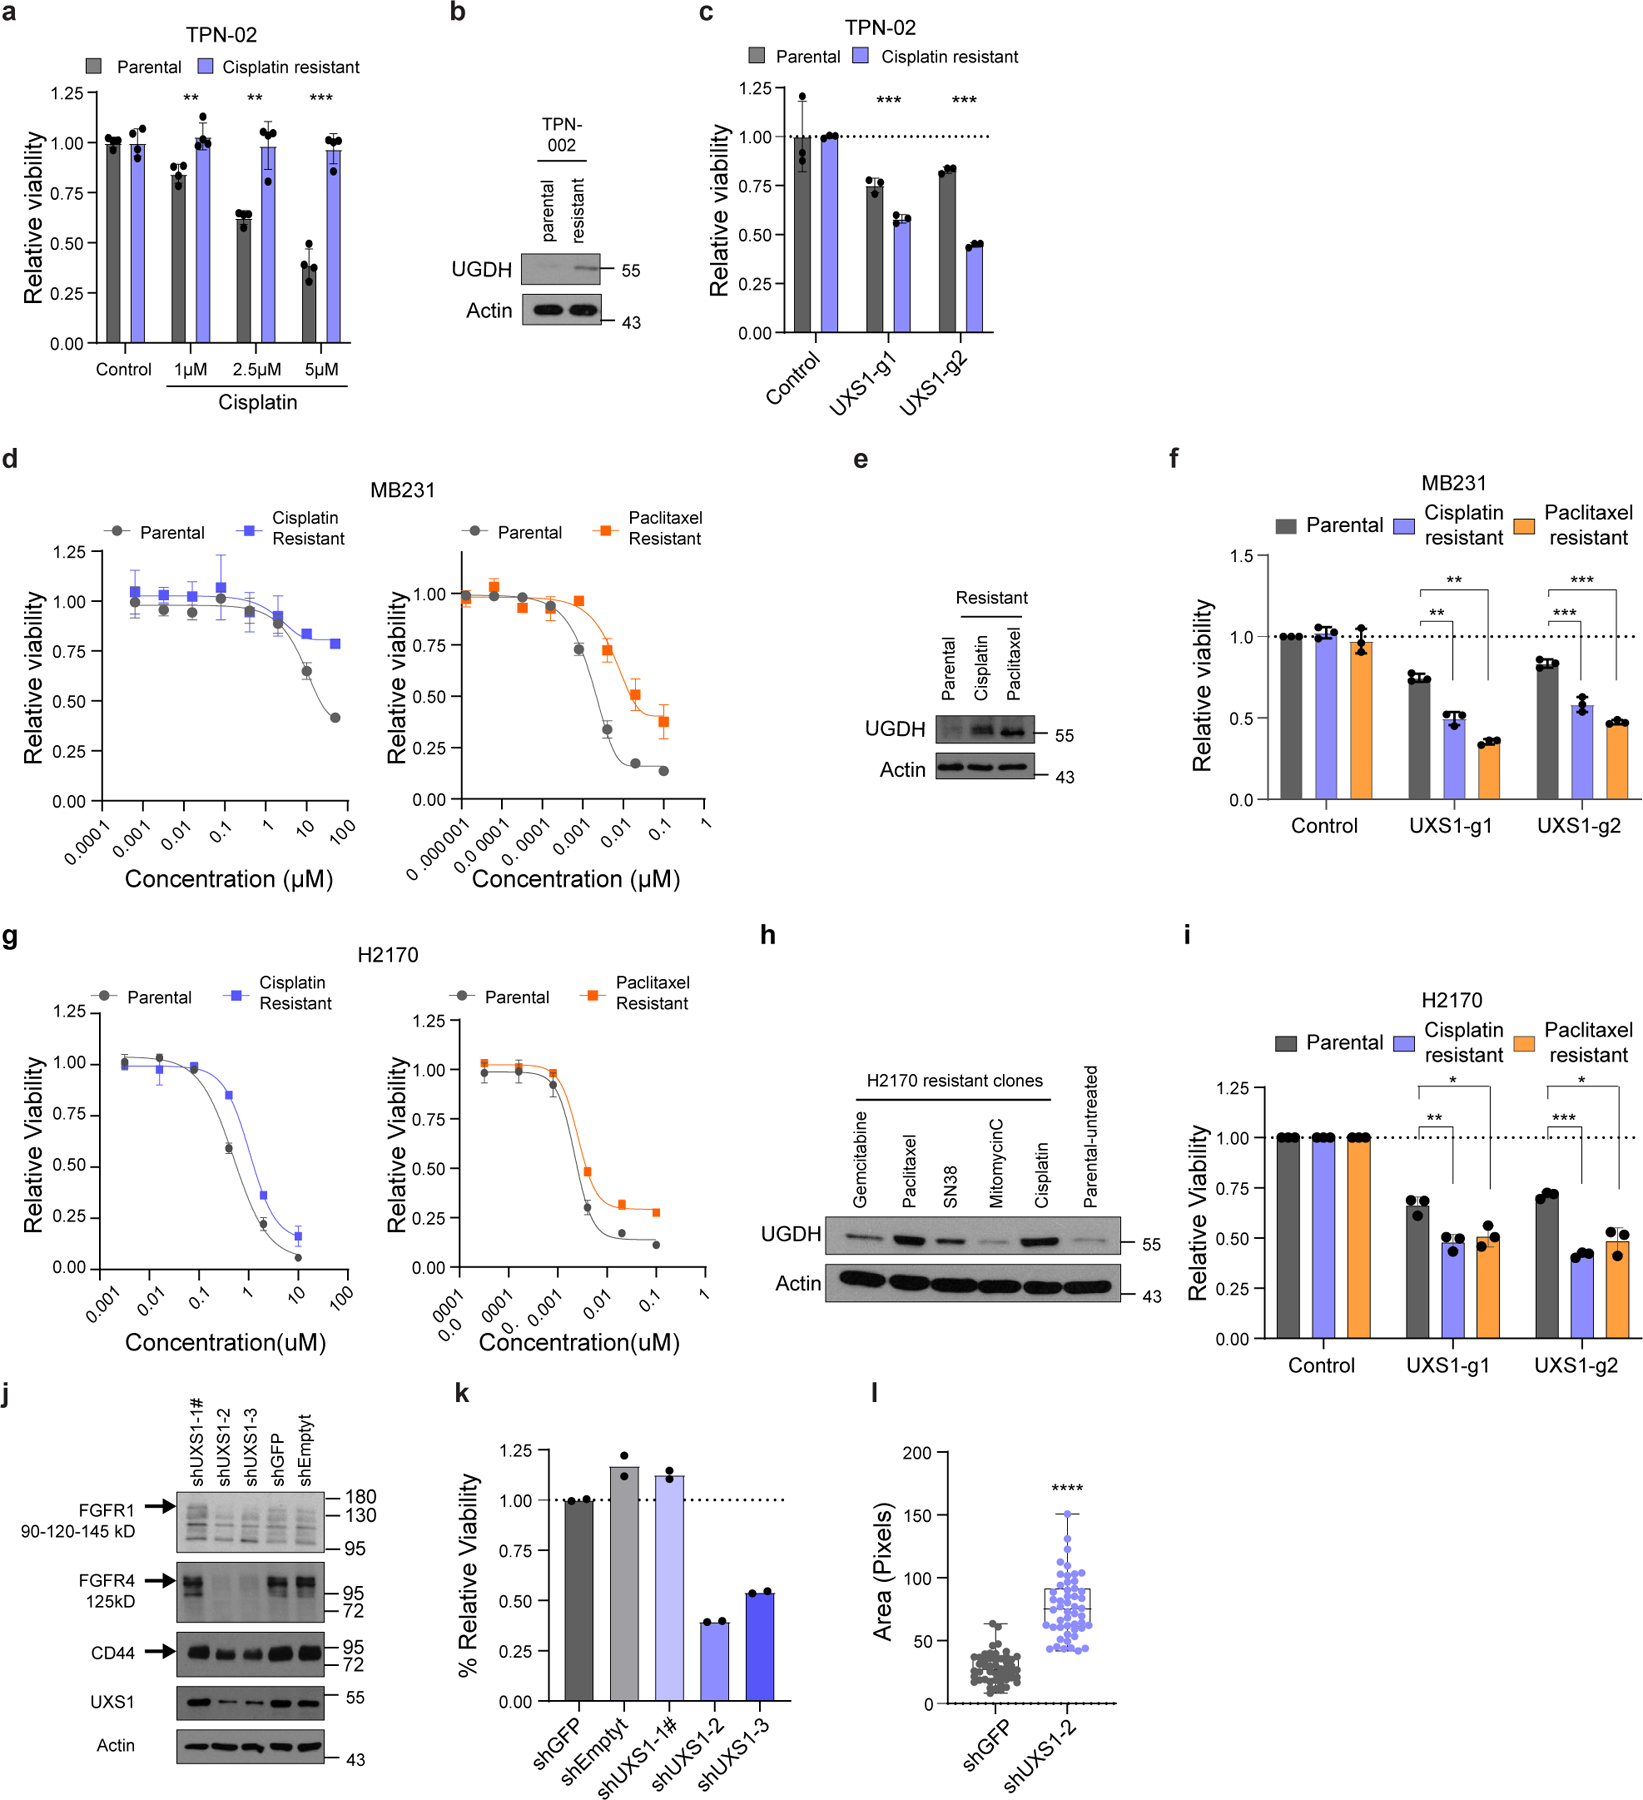
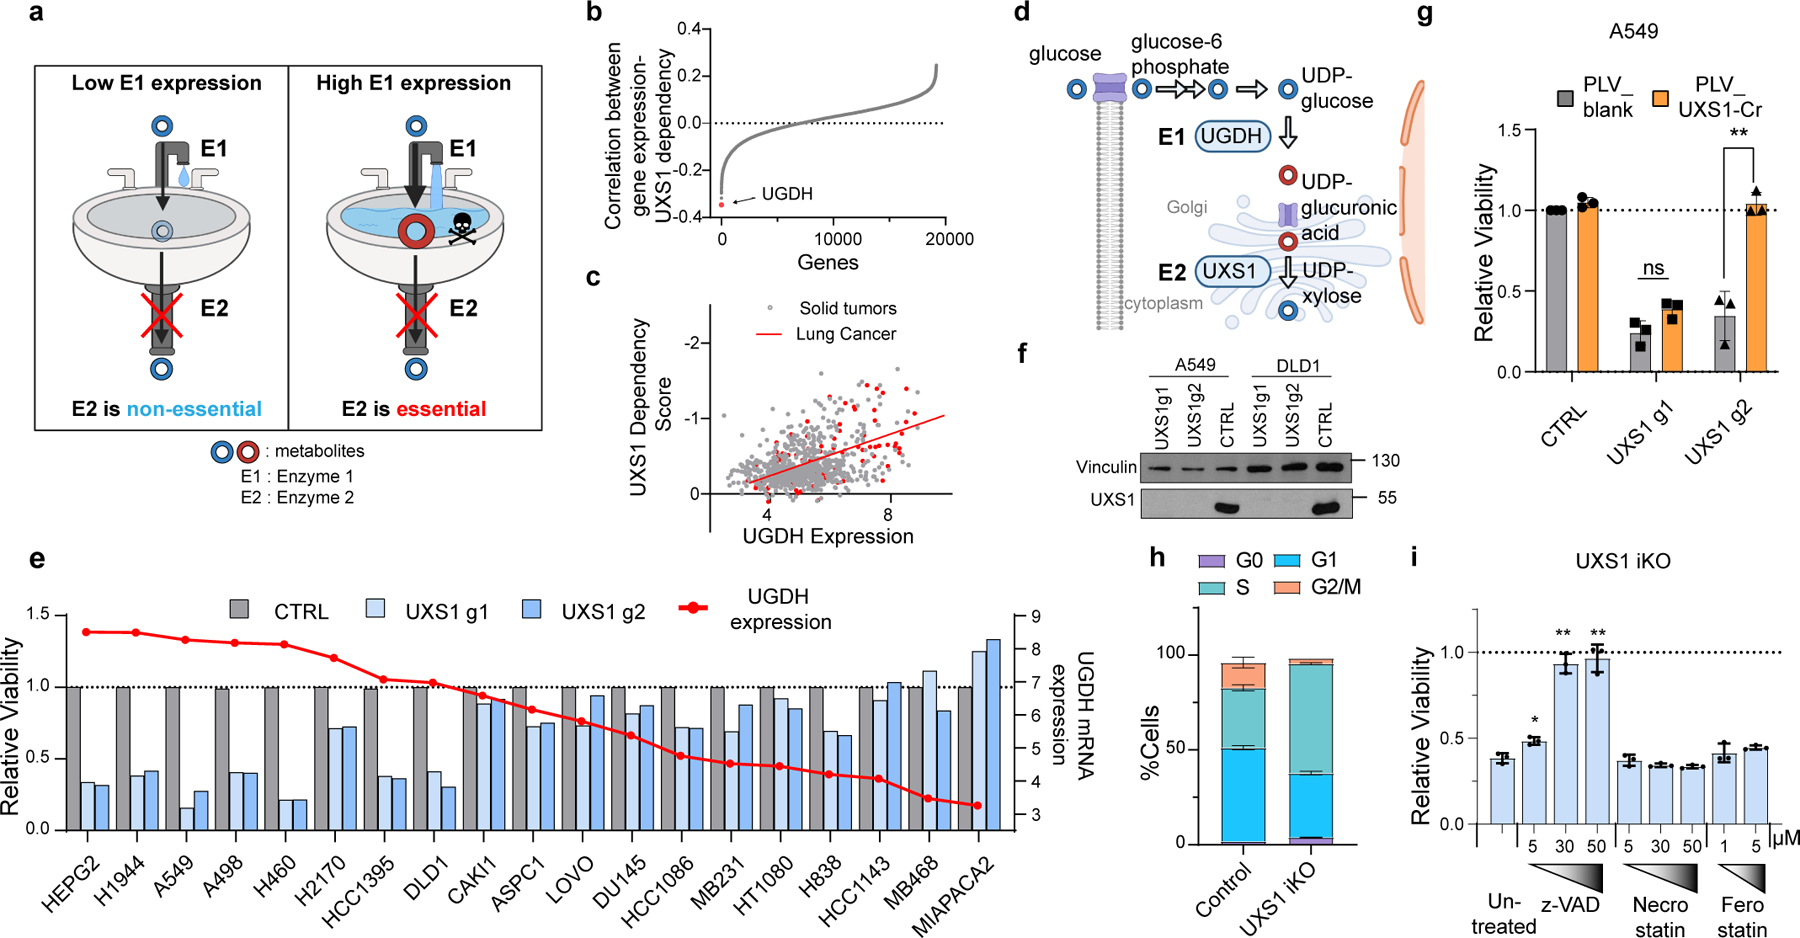
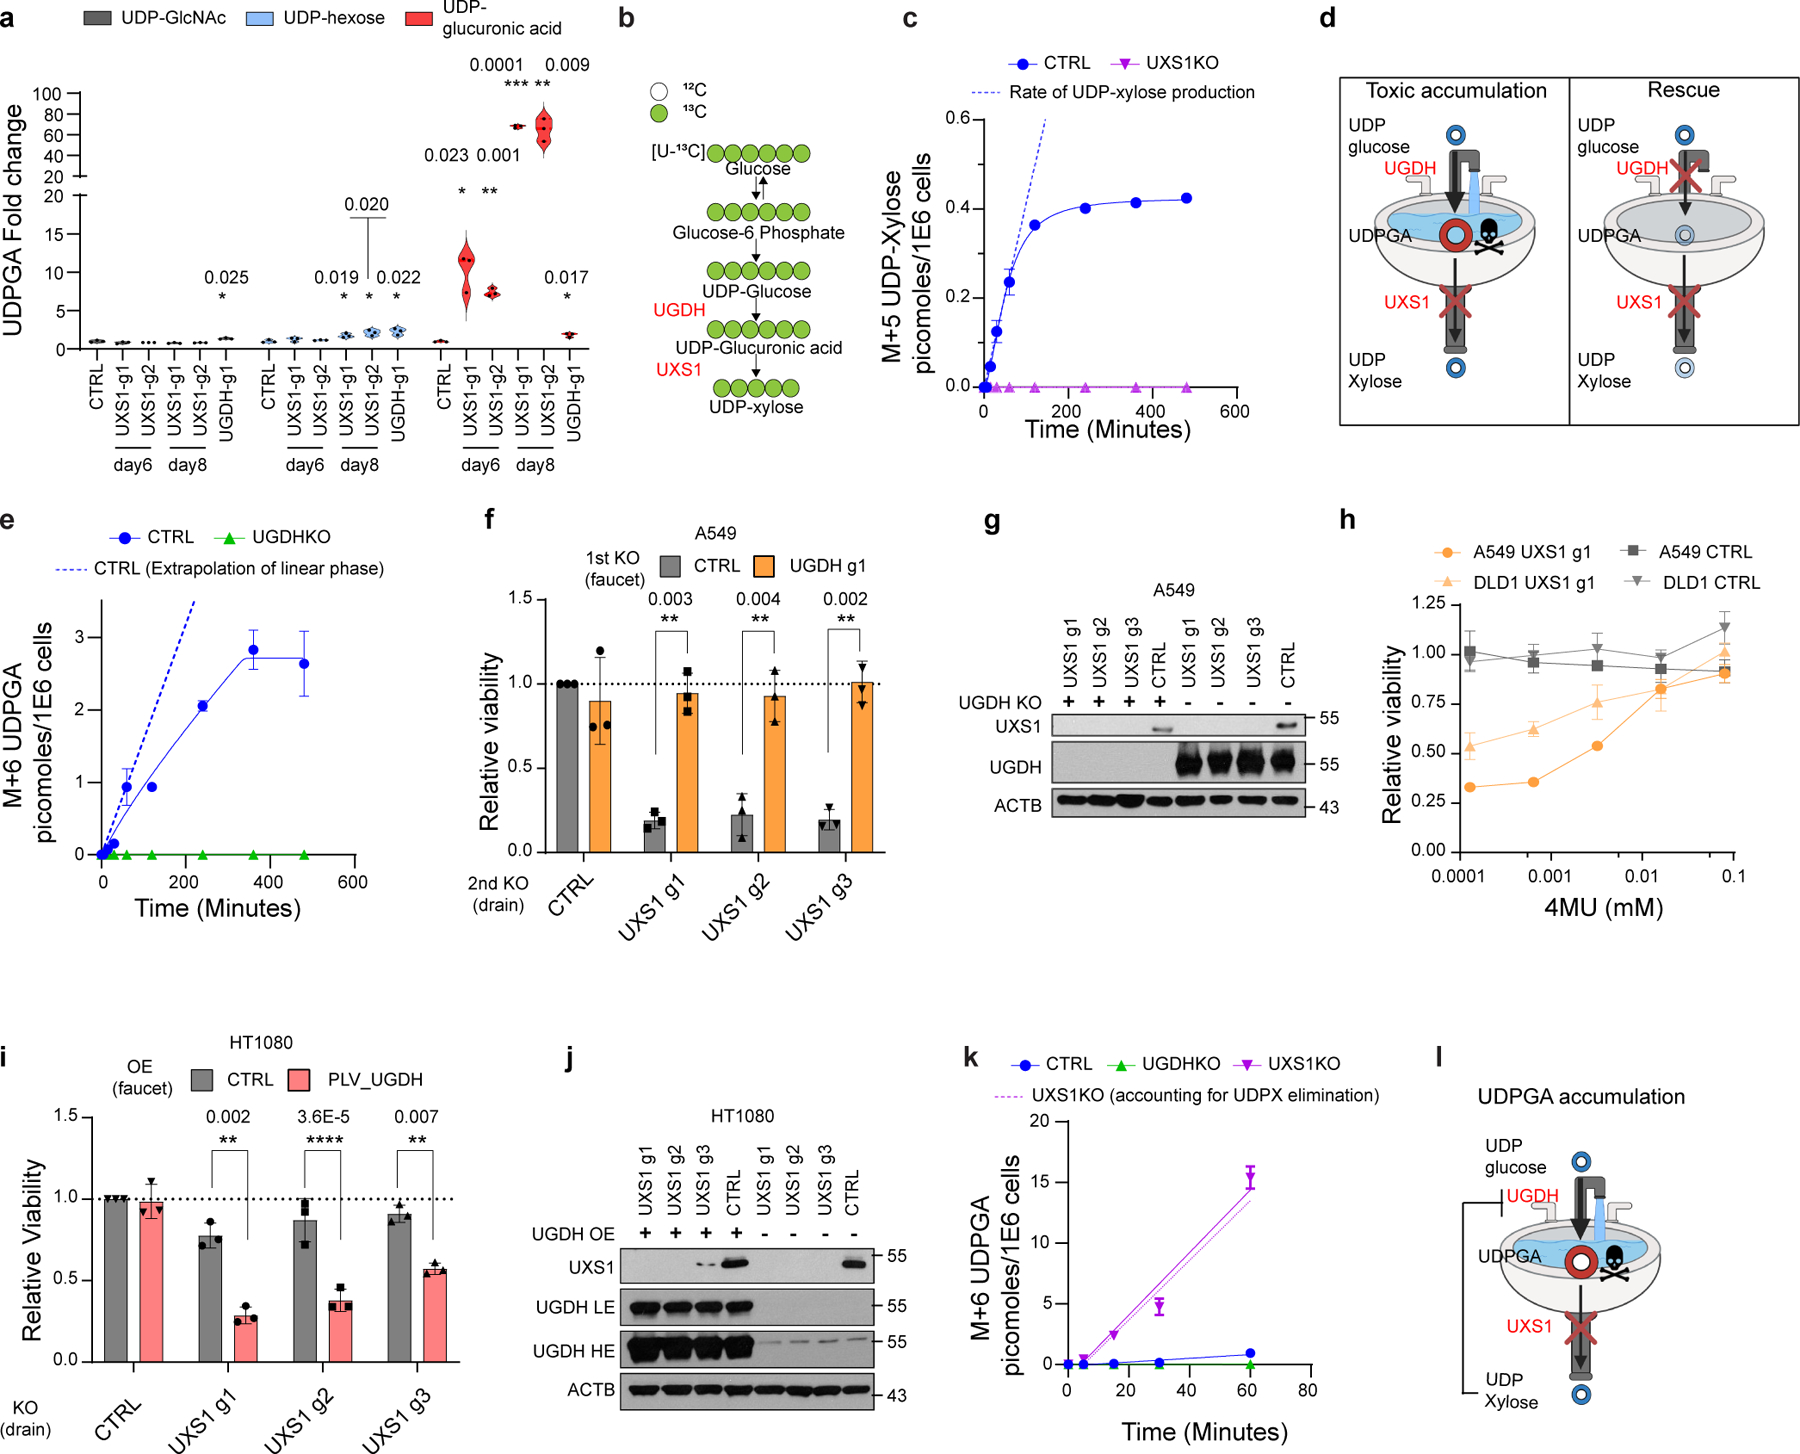
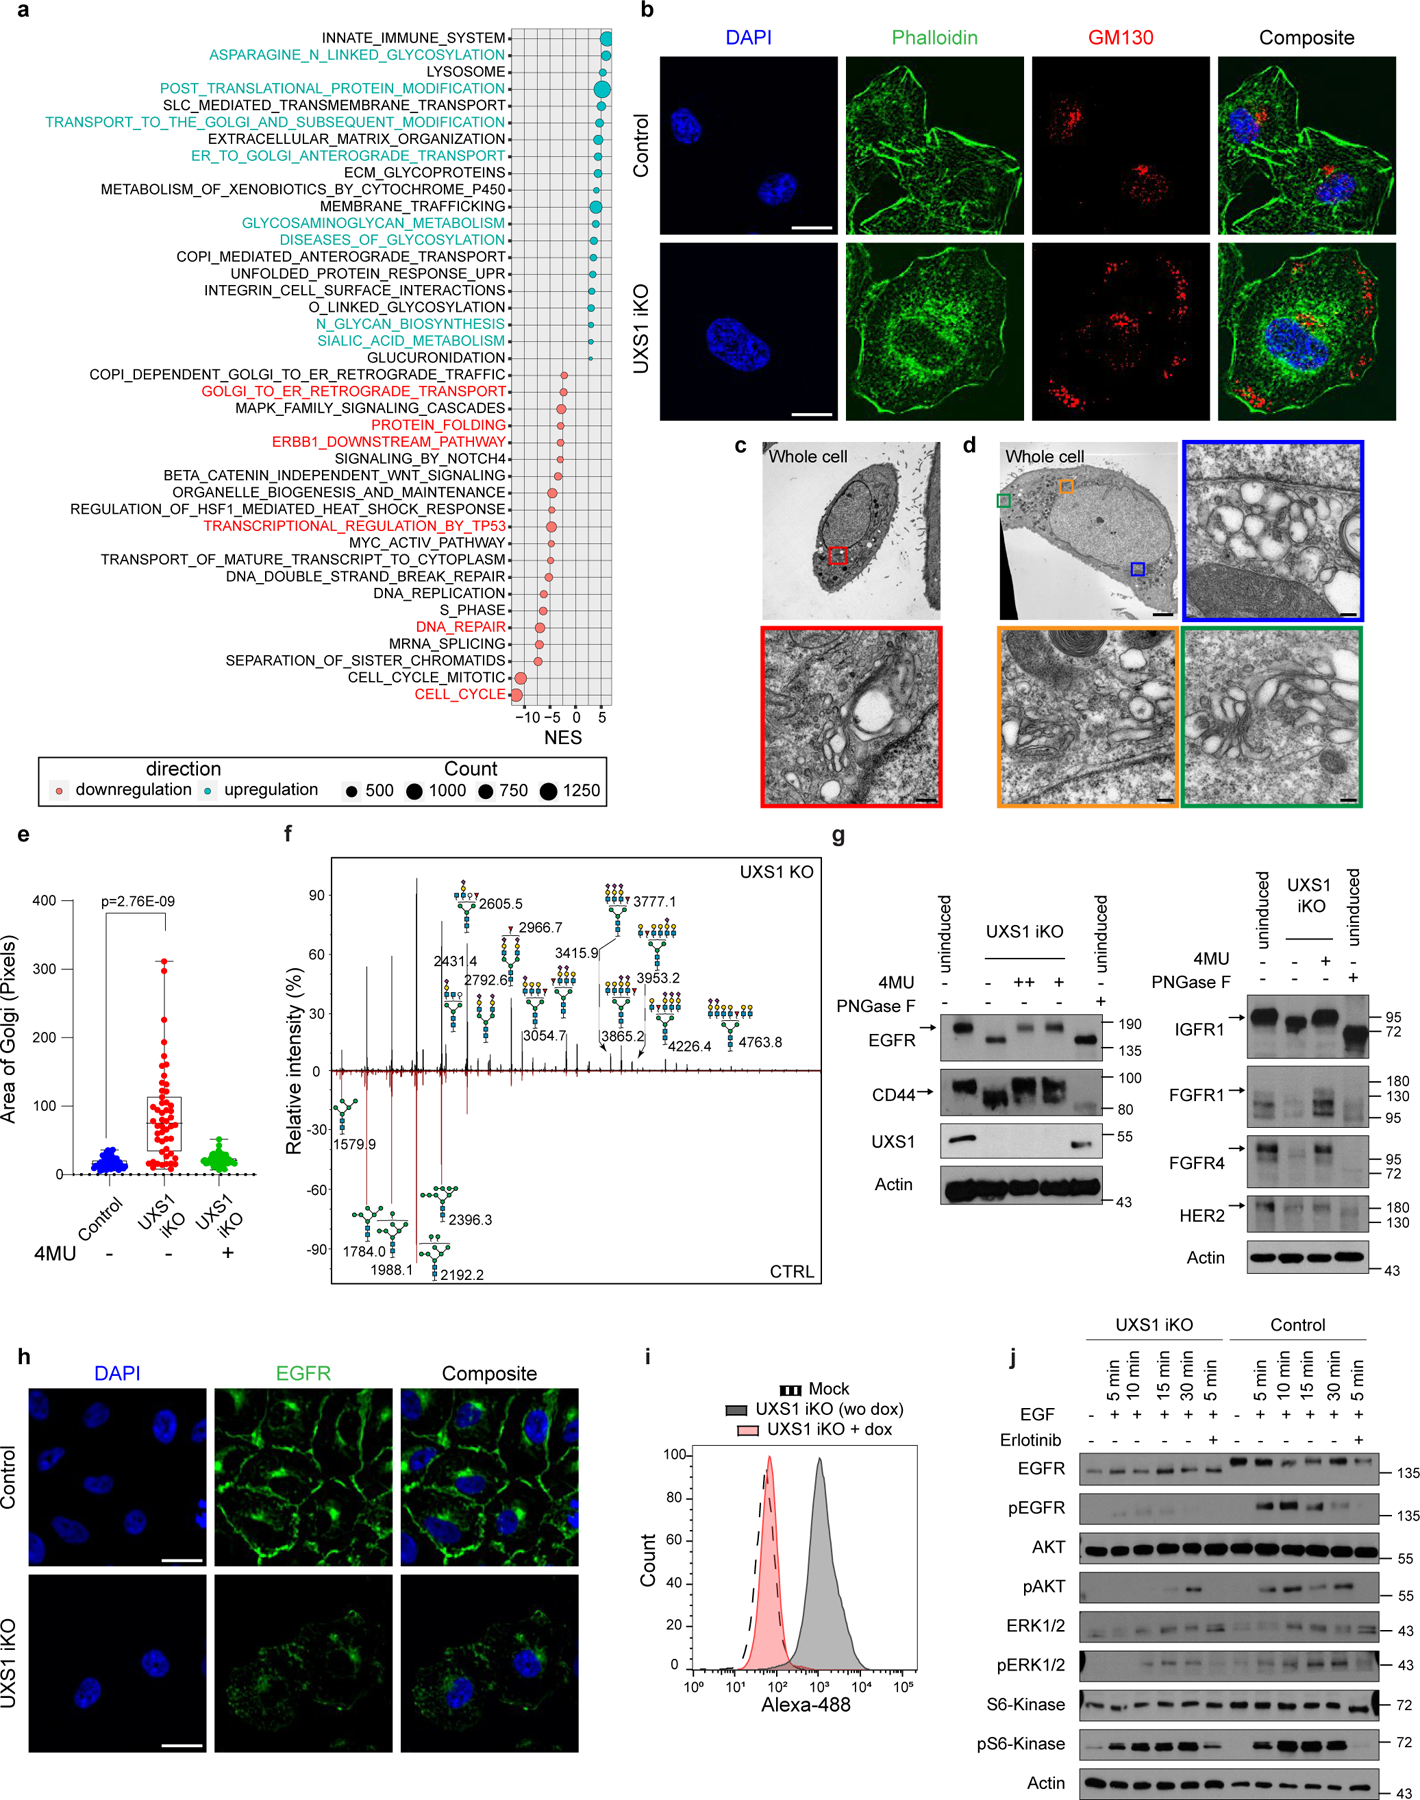
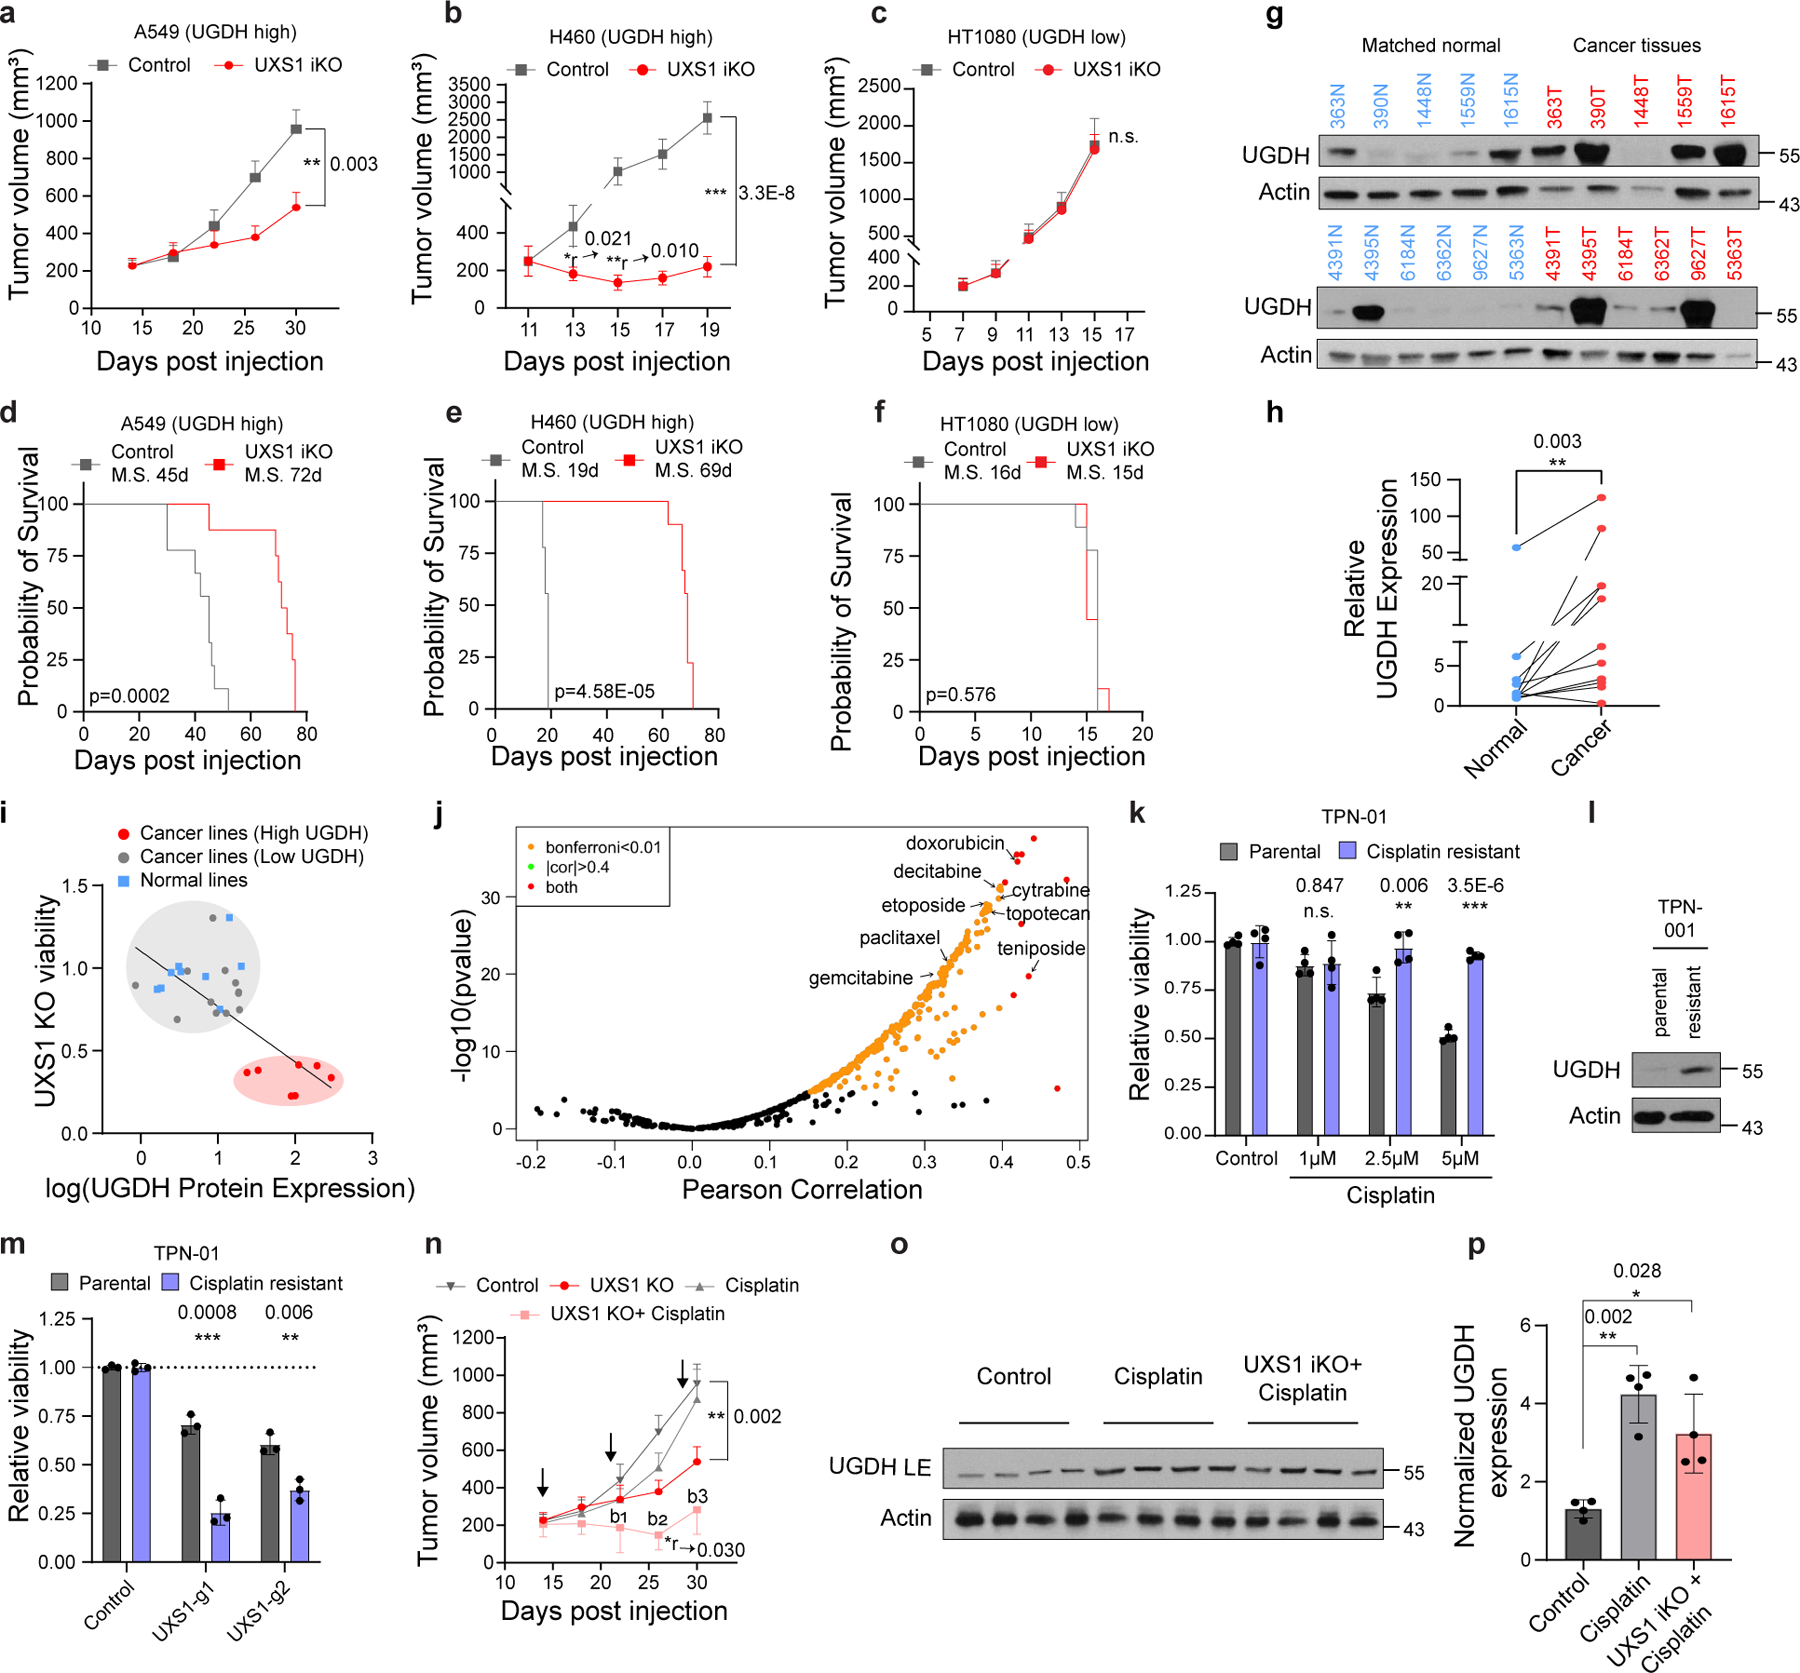
Identifying metabolic steps that are specifically required for the survival of cancer cells but are dispensable in normal cells remains a challenge1. Here we report a therapeutic vulnerability in a sugar nucleotide biosynthetic pathway that can be exploited in cancer cells with only a limited impact on normal cells. A systematic examination of conditionally essential metabolic enzymes revealed that UXS1, a Golgi enzyme that converts one sugar nucleotide (UDP-glucuronic acid, UDPGA) to another (UDP-xylose), is essential only in cells that express high levels of the enzyme immediately upstream of it, UGDH. This conditional relationship exists because UXS1 is required to prevent excess accumulation of UDPGA, which is produced by UGDH. UXS1 not only clears away UDPGA but also limits its production through negative feedback on UGDH. Excess UDPGA disrupts Golgi morphology and function, which impedes the trafficking of surface receptors such as EGFR to the plasma membrane and diminishes the signalling capacity of cells. UGDH expression is elevated in several cancers, including lung adenocarcinoma, and is further enhanced during chemoresistant selection. As a result, these cancer cells are selectively dependent on UXS1 for UDPGA detoxification, revealing a potential weakness in tumours with high levels of UGDH.


Conflict of interest statement

Competing interests

M.B.D. and D.K. are listed as authors on a patent application filed by University of Massachusetts Chan Medical School on targeting UXS1 in cancer therapy. All other authors declare no competing interests.

Figures

Extended data Figure 1.
Extended data Figure 1.. UXS1 is required in a subset of cancer cells, and validation of CRISPR/cas9 reagents for UXS1
(a) Ranked list of the standard deviation of CERES gene-scores of all metabolic genes across 572 solid cancer cell lines, identifying UXS1 as one of the top enzymes having variable dependency. (b) UXS1 gene-score across cancer cell lines using pan-cancer dependency dataset showing that only a subset of cancer cell lines (gene-scores below −0.5) is dependent on UXS1 for survival. A lower gene score means that a gene is more likely to be essential in a given cell line. A score of 0 is equivalent to a non-essential gene, whereas a score of −1 corresponds to the median of all common essential genes. (c) UXS1 immunoblots showing KO of UXS1 in HT1080 and H838 cell lines 9 days post transduction. (d) Schematic of UXS1 g2 and UXS1 CRISPR resistant g2 sequence, demonstrating the strategy of using 1 silent mutation in the PAM sequence (yellow highlight) and 2 silent mutations in the seed sequence (green highlight) to prevent CRISPR/cas9 targeting. (e) Relative viability of DLD1 cells either overexpressing blank vector or g2-resistant UXS1 then subjected to UXS1 KO with g1 or g2, demonstrating that UXS1 KO toxicity is on target (CTRL = 1.0) (n=3 per group). (f) Immunoblot of UXS1 levels in A549 and (g) DLD1 cells overexpressing blank or UXS1-g2 resistant vectors when subjected to CRISPR/Cas9 mediated KO of UXS1 (h) TLCv2 system; LentiCRISPR v2 was modified into an all-in-one dox inducible system. The addition of doxycycline induces Cas9-2A-eGFP. The U6 promoter drives constitutive sgRNA expression. UXS1 iKO and control iKO was prepared by cloning UXS1-g2 and CTRL (non-targeting guide) into the TLCv2 system, respectively. (i) Relative viability of UXS1 iKO and control iKO cells with and without doxycycline induction (control iKO without doxycycline = 1.0) (n=3 per group). Induction consisted of 100ng/ml doxycycline treatment for 48 hours; cells were cultured for 4 more days before measuring viability. (j) UXS1 immunoblots showing KO of UXS1 in CCD18Lu and CCD8Lu cells, 9 days post-transduction. Data are shown as mean ± s.d. except in b where box plot shows median (centre) with interquartile range of 25% to 75%, minima and maxima. e, i, Two-tailed unpaired Student’s t-test. P values from left to right in e: p=0.12, p=0.002, i: p=0.663, p=5.4E-06 (n.s.: not significant, **p<0.01, ****p<0.0001). d and h was created using Biorender (https://biorender.com/).
Extended Figure 2.
Extended Figure 2.. Additional data for UXS1 loss led cell cycle defects and cell death rescue
(a) Gating strategy for cell cycle analysis. Cells were first gated by forward (FSC-A) and side scatters (SSC-A) to remove cell debris, then by forward scatter area (FSC-A) and height (FSC-H) to select for single cells before plotting histograms for cell cycle profiles. This example gating strategy is shown in control iKO cells. (b) Representative cell cycle profiles for control iKO cells and (c) UXS1 iKO cells 5 days after doxycycline induction. The cell cycle phases were determined by fitting a univariate cell cycle model using the Watson pragmatic algorithm (d) Relative viability of DLD1 cells subjected to UXS1 KO then treated with z-vad, Necrostain, or Ferrostatin at the indicated concentrations (Untreated = 1.0) (n=3 per group). Data are mean shown as ± s.d. d, Two-tailed unpaired Student’s t-test. P values from left to right in d: p=0.03, p=0.002, p=0.032 (*p<0.05, **p<0.01, ***p<0.001).
Extended data Figure 3.
Extended data Figure 3.. Supporting data that UDPGA is toxic
(a) Relative viability of DLD1 cells subjected to preemptive CTRL (gray) or UGDH (faucet; orange) KO, followed by CTRL or UXS1 (drain) KO. Values are relative to cells subjected to CTRL KO then CTRL KO (=1.0) (n=3 per group). (b) Immunoblot of UXS1 and UGDH protein levels under the KO combinations shown in a. (c) GC-MS quantification of UDPGA in cell-lines subjected to CTRL (gray) or UXS1 KO (pink) at 8 days of transduction (n=3 per group). (d) Relative viability of A549 UXS1 iKO cells grown in media containing increasing glucose concentrations. Values are relative to uninduced cells grown in media containing 25 mM glucose (=1.0) (n=3 per condition). (e) GC-MS quantification of UDPGA (blue; left Y axis) and relative viability (red; right Y axis) of A549 cells treated with increasing concentrations of UDPGA, showing dose-dependent increase in UDPGA and accompanying decrease in viability (n=3 per group). (f) Viability of H838 cells overexpressing either blank vector (gray) or UGDH (red) then subjected to CTRL or UXS1 KO. Values are relative to blank vector overexpressing, CTRL KO cells (=1.0) (n=3 per group). (g) Immunoblot of UXS1 and UGDH protein levels under the OE/KO combinations shown in c; LE indicates low exposure, HE indicates high exposure. (h) Relative UDPGA produced [M+6 UDPGA / (M+6 UDP-glucose/ total UDP-glucose)] in control, UGDH KO, and UXS1 KO A549 cells (n=3 per group). (i) Labelled UDP-glucose (M+6) in control and UXS1 KO A549 cells (<1h) (n=3 per group). (j) Unlabelled UDP-glucose (M+0) in control and UXS1 KO A549 cells (<1h) (n=3 per group). (k) Total UDP-glucose (M+6 + M+0) in control and UXS1 KO A549 cells (<1h) (n=3 per group). (l) Fractional labeling of UDP-glucose [M+6 UDP-glucose/ total UDP-glucose] of control and UXS1 KO cells (<1h) (n=3 per group). Data are shown as mean ± s.d. a, c-f, i, Two-tailed unpaired Student’s t-test. P values from left to right in a: p=0.002, p=0.0001. p=7.9E-06, c: p=0.52, p=0.006, p=0.013, d: p=0.0006, p=0.015, e: (UDPGA) p=0.016, p=0.035, p=0.0001, (viability) p=0.0007, p=0.0008, p=3.14E-05 f: p=0.001, p=0.011, p=0.001 (n.s.: not significant, *p<0.05, **p<0.01, ***p<0.001, ****p<0.0001).
Extended data Figure 4.
Extended data Figure 4.. Downstream proteoglycan impact of UGDH and UXS1 KO
(a) Sulfated glycosaminoglycans (sGAG) levels quantified using DMMB assay (Methods) from UGDH KO, UXS1 KO, and UGDH-UXS1 DKO A549 cells and in (b) DLD1 cells (n=3 per group). (c) Hyaluronic acid levels quantified via competitive ELISA (Methods) from the conditioned media obtained from UGDH KO, UXS1 KO, and UGDH-UXS1 DKO A549 cells and in (d) DLD1 cells (n=3 per group). Data are shown as mean ± s.d. a-d, Two-tailed unpaired Student’s t-test. P values from left to right in a: p=0.024, p=0.019, p=0.028, p=0.012, p=0.031, b: p=0.337, p=0.145, p=0.117, p=0.098, p=0.137, c: p=0.479, p=0.19, p=0.015, p=0.018, p=0.027, d: p=0.492, p=0.71, p=0.004, p=0.002, p=0.004 (n.s.: not significant ,*p<0.05, **p<0.01).
Extended data Figure 5.
Extended data Figure 5.. Additional details of Golgi stress, altered glycosylation, and signaling/cell cycle changes following UXS1 ablation.
(a) ARF4 immunoblots in UGDH high (UXS1 (A549) iKO and H1944) and low (HT1080) cells, 7 days post UXS1 KO, showing that ARF4 is only induced only in UGDH high cells following UXS1 ablation. (b) Changes in Oligomannose glycans (c) Paucimannose glycans (d) Sialylated glycans and (e) glycans with poly-LacNac extensions in A549 cells subjected to CTRL or UXS1 KO (n=2 per group). (f) O-glycan profiling analysis performed on A549 cells subjected to CTRL or UXS1 KO at 7d post-transduction (n=2 per group). (g) Immunoblots of phospho-histone H3 and actin from A549 UXS1 iKO and control iKO cells at indicated timepoints post doxycycline induction. Nocodazole-treated cells are used as a positive control for enrichment for cells in M phase. (h) Dot plot of total Golgi area per cell, from A549 UXS1 iKO cells induced via doxycycline, then labeled using GM130 at indicated days post-induction. No serum (orange) cells were serum starved for 12 hours before labeling, which results in G0 cell cycle arrest and synchronization. p values from left to right are p=0.48, p=0.21, p=0.15, p=0.044. (i) GSEA enrichment plot showing that EGFR signaling and Cell Cycle genesets are highly depleted in UXS1 KO A549 cells compared to CTRL KO (n=50 cells per group). (j) Same findings in another UXS1 sensitive cell line (H460). Cell Cycle genes are the most depleted geneset for ‘C2; canonical pathways’ (as shown in Figure 3A), while EGFR Signaling genes are the most depleted geneset for the ‘C2; chemical and genetic perturbations’ ontology scheme. Data are shown as mean ± s.d. except in h where box plot shows median (centre) with interquartile range of 25% to 75%, minima and maxima. h, Two-tailed unpaired Student’s t-test. (n.s.: not significant, *p<0.05).
Extended Data Figure 6.
Extended Data Figure 6.. Additional details of golgi and ER morphology, and EGFR localization after UXS1 ablation.
(a) Immunofluorescent images of UXS1 iKO or control iKO cells, 7 days post doxycycline induction, immunostained with Giantin (medial-golgi, green), (c) TGN46 (trans-golgi, green), or (e) Calnexin (ER, red); scale bar=20 µm. (b) Dot plot of total golgi area per cell from uninduced and induced UXS1 iKO cells at 7 days postinduction, as labeled with Giantin, (d) TGN-46, or (f) Calnexin (n=50 cells for each group). (g) Immunoblot for ER stress markers IRE1α, CHOP, and BiP in A549 and DLD1 UXS1 KO cells 7 days post transduction. Tunicamycin treated cells are positive control for ER stress. (h) Dot plot of total golgi area per cell, labeled using GM130, from control, UXS1 KO, and UGDH-UXS1 DKO (A549) cells, 7 days post UXS1 transduction; n=50 cells per group. (i) Quantification of relative actin-normalized EGFR expression (immunoblots from 3 independent experiments) in induced compared to uninduced UXS1 iKO A549 cells, 5d postinduction. In each experiment, the uninduced EGFR = 1.0. (j) Gating strategy for EGFR cell surface quantitation analysis. Cells were first gated by forward (FSC-A) and side scatters (SSC-A) to remove cell debris, then by forward scatter area (FSC-A) and height (FSC-H) to select for single cells before plotting histograms for FITC channel. Example gating strategy is shown for UXS1 iKO cells. (k) Quantitation of cell surface EGFR labeling via 3 independent flow cytometry experiments. Data are shown as mean ± s.d. except in b, d, f, h where box plot shows median (centre) with interquartile range of 25% to 75%, minima and maxima. b, d, f, h, i, k, Two-tailed unpaired Student’s t-test. P values from left to right in b: p=3.59E-10 in d: p=2.94E-10 in f: p=0.95 in h: p= 1.96E-09, p=0.285 in i: p=0.011 in k: p=0.001 (n.s.: not significant, *p<0.05, ***p<0.001, ****p<0.0001).
Extended Data Figure 7.
Extended Data Figure 7.. UDPGA accumulation occurs in cytosol and overexpression of SLC35D1 does not impact toxicity of UXS1 KO
(a) Viability of A549 and DLD1 cells overexpressing either blank vector (gray) or SLC35D1 (dark green) then subjected to CTRL or UXS1 KO. Values are relative to blank vector overexpressing, CTRL KO cells (=1.0) (n=3 per group). (b) Immunoblot of UXS1 and SLC35D1 protein levels under the OE/KO combinations shown in a. (c) GC-MS UDPGA quantitation of cytoplasmic and organellar fractions of either induced or uninduced A549 UXS1 iKO cells (n=3 per group). (d) Immunoblots of proteins located in nucleus (PARP1), ER (Calnexin), Golgi (GM130), mitochondria (NDUFS3), and cytoplasm (PSPH and tubulin) in cytosolic and organellar fractions. Cytochrome c is used as a control for intact organelles (mitochondria). Data are shown as mean ± s.d. a, c, Two-tailed unpaired Student’s t-test. P values: from left to right in a: p=0.391, p=0.379, p=0.792, p=0.106 in c: p=0.018, p=0.002 (n.s.: not significant, *p<0.05, **p<0.01).
Extended Data Figure 8.
Extended Data Figure 8.. Additional in-vivo data
(a) Schematic of in-vivo xenograft experiments shown in Figs.4 a–f, p. A549/H460/HT1080 UXS1 iKO cells were injected subcutaneously into 6 weeks old nude female mice and allowed for tumors to establish. Once the mean tumor was 200–250mm3, the mice were divided into groups for control (uninduced) and dox chow induction of UXS1 KO. A549 xenograft experiment had additional cisplatin arms. The animals were euthanized when tumor volume reached 2000mm3. (b) Immunoblots for UXS1 and actin of H460 and HT1080 UXS1 iKO cells in culture with and without doxycycline induction. (c) Relative viability of H460 UXS1 iKO and HT1080 UXS1 iKO cells with and without doxycycline induction (without doxycycline = 1.0). Induction consisted of 100ng/ml doxycycline treatment for 48 hours; cells were cultured for 4 more days before measuring viability. (d) Immunoblot for UXS1 and actin in six individual tumors each from the control and UXS1 iKO group of HT1080 UXS1 iKO xenograft experiment. (e) Weight of mice in grams from xenograft experiments of A549, (f) H460, and (g) HT1080 from control and UXS1 iKO arms of the experiment. (h) LC-MS Quantification of UDPGA from endpoint tumors from another A549 iKO cohort where tumors were allowed to form for 17 days, induced for KO, then euthanized at 19 days postinduction (p=0.003). (i) Immunoblot for ARF4 and actin from four individual tumors in panel h. (j) Immunoblot for UGDH and actin from organs harvested from control and cisplatin-treated mice (representative pair shown) treated with the same regimen of cisplatin as in Figure 4n (4mg/kg iv 1x weekly, 3 weeks). (k) Quantitation of relative, actin normalized UGDH band intensities from control and cisplatin-treated mice (n=4 each) with the same regimen. Values are relative to cisplatin-treated kidney in each mouse set at 1.0. Data are shown as mean ± s.d. c, h, k, Two-tailed unpaired Student’s t-test. P values from left to right in c: p=1.34E-08, p=0.44 h: p=0.003 in k: p=0.966, p=0.978, p=0.478, p=0.471. (n.s.: not significant, **p<0.01, ****p<0.0001). a was created using Biorender (https://biorender.com/).
Extended data Figure 9.
Extended data Figure 9.. UGDH is elevated in cancer subsets
(a) Immunoblots for UGDH and actin from 11 breast cancer patient tissue samples and 8 normal breast tissues; cancer tissues are labeled in red and normal tissues are labeled in blue. Numbers indicate deidentified patient code, and tumors and normals sharing the same number are adjacent samples from the same patient. (b) Quantification of relative, actin normalized UGDH band intensities from panel a (p=0.023). (c) Expression profiles of UGDH in 10 types of normal and tumor tissues. The plot is obtained from GEPIA2, a web gene expression profiling tool that plots normalized mRNA-seq data from patient tumor tissues and normal tissues obtained from TCGA and GTEx. All tumor types shown have over 2-fold UGDH expression in tumors than normal tissues (q value <0.01). q values have been determined by two-way ANOVA and adjusted for false discovery rate. The dotted line indicates mean UGDH TPM of liver normal samples, highest among other normal organs. (d) Top dot plot showing viability following UXS1 KO (y axis) and bottom dot plot showing corresponding UGDH protein expression level (y axis) for 19 cancer and 9 normal cell lines of varying lineage (x axis). Cancer lines are divided between High (red) and Low(gray) UGDH expressing lines based on arbitrary cut-off 1.25 units; normal lines are labeled as blue dots. (e) Immunoblots of UGDH and actin for cancer cell lines and normal cells (non-transformed primary or immortalized cells) shown in Figure 4h and panel d; UXS1 KO sensitive cell lines are labeled in red and insensitive lines are labeled in gray and normal lines are labeled in blue. (f) Immunoblots for UGDH and actin from 6 normal liver, 6 normal kidney and, 5 normal colon patient tissue samples compared with 2 representative (UGDH high) lung cancer patient samples; cancer tissues are labeled in red and normal tissues are labeled in blue. Data shown in b is shown as mean ± s.d. b, Two-tailed unpaired Student’s t-test.
Extended Data Figure 10.
Extended Data Figure 10.. Additional chemo-resistance data and RNA interference data for UXS1.
(a) Viability of parental (chemo-sensitive) and chemo-resistant Patient-derived organoid (PDO) TPN-02 subjected to varying doses of cisplatin. (n=3 per group). (b) Immunoblot for UGDH and actin from parental and chemo-resistant PDO TPN-02. (c) Relative viabilities of parental and cisplatin-resistant TPN-02 subjected to UXS1 KO, indicating that cisplatin-resistant organoids are more sensitive to UXS1 loss. Values are relative to parental cells CTRL-KO (=1.0) (n=3 per group). (d) Sigmoidal drug response curves for MDAMB231 parental (gray) and cisplatin-resistant (violet) cells in response to cisplatin treatment and MDAMB231 parental (gray) and paclitaxel-resistant (orange) counterparts in response to paclitaxel (n=3 per group). (e) Immunoblot for UGDH and actin from MDAMB231 parental and drug-resistant counterparts. (f) Relative viabilities of MDAMB231 cisplatin (violet) and paclitaxel (orange) resistant clones subjected to UXS1 KO, indicating that MDAMB231 resistant clones are more sensitive to UXS1 loss. Values are relative to CTRL-KO for each clone (=1.0) (n=3 per group). (g) Sigmoidal drug response curves for H2170 parental (gray) and cisplatin-resistant (violet) cells in response to Cisplatin treatment and H2170 parental (gray) and paclitaxel-resistant (orange) cells in response to paclitaxel (n=3 per group). (h) Immunoblot for UGDH and actin from H2170 parental and drug-resistant clones. (i) Relative viabilities of H2170 cisplatin (violet) and paclitaxel (orange) resistant clones subjected to UXS1 KO, indicating that H2170 resistant clones are more sensitive to UXS1 loss. Values are relative to CTRL-KO for each clone (=1.0) (n=3 per group). (j) Immunoblots for glycoproteins FGFR1, FGFR4, CD44 and UXS1 in A549 cells subjected to RNAi. UXS1 blots indicate that shUXS1-2 and shUXS1-3, but not shUXS1-1, result in effective knockdown of UXS1, # denotes that shUXS1-1 is a poor performing shRNA. (k) Relative viabilities of A549 cells subjected to RNA interference (RNAi) mediated knock-down of UXS1, showing that the two guides which effectively knock down UXS1 result in toxicity (n=2 per group). (l) Dot plot of total golgi area per cell, labeled using GM130, from A549 cells subjected to shGFP or shUXS1-2, 7 days post-transduction; n=50 cells per group. Data are shown as mean ± s.d. except in l where box plot shows median (centre) with interquartile range of 25% to 75%, minima and maxima. a, c, f, i, l, Two-tailed unpaired Student’s t-test. P values from left to right in a p=0.005, p=0.007, p=4.12E-05 in c p=0.006, p=1.13E-05 f p=0.002, p=6.07E-05, p=2.47E-05, p=0.021 in i p=0.006, p=0.019, p=2.4E-5, p=0.021 in l p=4.8E-20. (*p<0.05, **p<0.01, ***p<0.001, ****p<0.0001).
Figure 1.
Figure 1.. Identification of UXS1 as an enzyme that is essential for cell survival in a manner that correlates with each cell line’s expression of the upstream enzyme UGDH.
(a) Strategy for identification of toxic metabolite clearing enzymes by finding scenarios where E2 is only essential in cells where E1 is highly expressed, suggesting that E2 is needed to get rid of E1’s product. (b) Correlation between mRNA expression of all genes (17386) with UXS1 dependency across 572 solid tumor cancer cell lines (Methods), showing UGDH as the top hit. (c) Correlation between UXS1 dependency and UGDH mRNA expression [log2(transcripts per million+1)] (Methods) in all 572 cell lines, spearman coefficient =−0.41, R2 = 0.17. The 122 lung cancer cell lines (red) show spearman coefficient = −0.61, R2 = 0.37. (d) Simplified diagram illustrating the metabolic pathway for UDPGA production. (e) Relative viability of various cell lines following lentiviral transduction with CRISPR/Cas9 with guides against UXS1 (light and dark blue bars) or CTRL (gray bars = 1.0) for 10 days (left Y axis). Cells are arranged in decreasing order of UGDH mRNA expression levels [log2(transcripts per million+1), overlaid as red line and dots; right Y axis]. (f) Immunoblots of UXS1 in A549 and DLD1 cell lines 9 days post-transduction. (g) Relative viability of A549 cells either overexpressing blank vector or g2-resistant UXS1 then subjected to UXS1 KO with g1 or g2 (n=3 per group) (CTRL = 1.0). (h) Cell cycle distribution in dox-inducible UXS1 iKO A549 cells, with (n=3) or without (n=3) induction for 5 days. (i) Relative viability of UXS1 iKO cells subjected to KO then treated with z-vad, Necrostain, or Ferrostatin at the indicated concentrations (n=3 per group) (Untreated = 1.0). Data are shown as mean ± s.d. Two-tailed unpaired Student’s t-test (g, i). P values from left to right in g: p=0.227, p=0.0001, i: p=0.011, p=0.001, p=0.003 (n.s. not significant (p>0.05) **p<0.01, ****p<0.0001). a and d were created using Biorender (https://biorender.com/).
Figure 2.
Figure 2.. UXS1 is required to detoxify the UDP-glucuronic acid produced by UGDH.
(a) LC-MS quantification of UDP sugars in A549 cells subjected to CTRL or UXS1 KO at 6 and 8 days of transduction (n=3 per group). UDP-hexose includes UDP-glucose/mannose/galactose, which cannot be resolved due to similar MS2 spectra. (b) Schematic of U-13C glucose labeling to trace UDPGA and UDP-xylose labeling. (c) M+5 UDP-xylose production in A549 cells (n=3 per group). (d) Toxic-metabolite accumulation model: cancer cells expressing high UGDH have toxic accumulation of UDPGA when UXS1 (drain) is removed. Preemptive UGDH KO should prevent UDPGA accumulation and UXS1 KO toxicity. (e) M+6 UDPGA production in A549 cells. (f) Viability following preemptive CTRL (gray) or UGDH (faucet; orange) KO, followed by CTRL or UXS1 (drain) KO, relative to cells subjected to CTRL KO then CTRL KO (=1.0) (n=3 per group). (g) Immunoblots from the KO combinations shown in c. (h) Viability of A549 and DLD1 cells with CTRL KO (gray) and UXS1 KO (orange), treated with 4MU (48 hours), relative to vehicle treated CTRL KO cells (=1.0) (n=3 per group). (i) Viability of HT1080 cells overexpressing blank vector (gray) or UGDH (red) then subjected to CTRL or UXS1 KO, relative to blank vector overexpressing, CTRL KO cells (=1.0) (n=3 per group). (j) Immunoblots from the OE/KO combinations shown in g; LE: low exposure, HE: high exposure. (k) M+6 UDPGA production in A549 cells (n=3 per group). Dotted purple line indicates UDPGA labeling in UXS1 KO cells, minus normal UDP-xylose production rate calculated from panel c, representing UDPGA production not accounted for by loss of clearance via UXS1. (l) Refined model depicting the negative feedback loop between UDP-xylose and UGDH. Data from c, e, and k are from the same experimental sets. Data are mean ± s.d. Two-tailed unpaired Student’s t-test (a, f, h, i). b was created using Biorender (https://biorender.com/).
Figure 3.
Figure 3.. UDPGA accumulation causes golgi dysfunction that leads to EGFR inactivation.
(a) Bubble plot showing differentially expressed pathways between CTRL vs UXS1 KO A549 cells, identified by GSEA pathway analysis of RNAseq data. (b) Immunofluorescent images of UXS1 iKO or control iKO A549 cells, 7 days post-induction, stained for Phalloidin (actin, green), GM130 (Golgi, red), and DAPI (nucleus, blue); scale bar=20µm. (c) Representative transmission electron microscope images of A549 control and (d) UXS1 KO cells. The colored boxes in the whole cell images indicate where golgi structures are found, with accompanying zoomed images (corresponding colored outline). Scale bar: Whole cell images=5µm, zoomed images=0.2µm. (e) Dot plot of total Golgi area per cell, labeled using GM130, from control, induced, and induced + 4MU (15 µM) UXS1 iKO cells, 7 days post-induction, n=50 cells per condition. Box plot indicates median (centre line) with interquartile range of 25% to 75%. ****p=2.76E-9 (unpaired Student’s t-test). (f) Representative mass spectrometry N-glycan profiles of A549 cells subjected to CTRL or UXS1 KO, at 7 post-transduction, with annotated mass peaks. Values are relative to the total N glycans detected. (g) Immunoblots for various surface glycoproteins in uninduced, induced, or induced plus 4MU UXS1 iKO cells. + indicates 15µM and ++ indicates 80µM 4MU. (h) Immunofluorescent images of uninduced or induced UXS1 iKO cells, stained for EGFR (green) and DAPI (blue). Scale bar = 40µm. (i) FACS-based fluorescence histogram of induced and non-induced UXS1 iKO cells labeled with FITC conjugated EGFR antibody. (j) Immunobloting of EGFR and downstream signaling components from induced UXS1 iKO cells or induced CTRL iKO cells, following serum starvation then EGF stimulation. pAkt = phospho (S473) Akt; pERK1/2 = phospho ERK1/2(T202/Y204); pS6-kinase = phospho-S6 kinase(T389) phosphoantibodies. EGFR blotting was run on 4–15% gradient gel to show maximal shift of the protein.
Figure 4.
Figure 4.. UXS1 is a cancer-selective therapeutic target due to elevated UGDH expression in cancer subsets and chemo-resistant cancer cells.
(a) Mean volumes (±s.e.m.) of A549, (b) H460, and (c) HT1080 subcutaneous xenograft tumors, UXS1 iKO induced when mean tumor volume reached 200–250mm3 (red, n=12 per line except n=11 for A549) or left uninduced (gray, n=12 per line) (Methods). (d-f) Kaplan-Meier survival analysis for the groups shown in a-c (M.S. = median survival). (g) Immunoblots from patient lung cancer tissues (n=11, red) and patient-matched normal lung tissues (n=11, blue). (h) Actin normalized quantification of UGDH from g (n=11 per group). (i) Scatter plot of viability following UXS1 KO against UGDH protein expression level for 19 cancer and 9 normal cell lines (Supplementary file). UGDH immunoblots are shown in Extended data Fig. 6c. Linear regression line is shown for all cancer lines. (j) Volcano plot showing spearman correlation between UGDH expression and drug sensitivity AUC (546 drugs), mined from CCLE gene expression database and PRISM database. (k) Viability of parental (n=3) and cisplatin-resistant version (Methods) (n=3) of PDO line TPN-01 following cisplatin treatment (4 weeks), relative to untreated (=1.0). (l) Immunoblots from parental and chemo-resistant TPN-01. (m) Viability of parental (n=3) and cisplatin-resistant (n=3) TPN-01 subjected to UXS1 KO (7 days), relative to parental CTRL-KO (=1.0). (n) Mean volumes (±s.e.m.) from experiment a, showing additional cisplatin treated (3x, black arrows; Methods) arms. Bliss independence scores (Methods; <1 indicates synergism) for UXS1+cisplatin arm; b1=0.66, b2=0.47, b3=0.57. (o) Immunoblot from four randomly selected tumors from each indicated A549 group. (p) Actin normalized quantification of UGDH (n=4 per group) from o showing mean (±s.d.). a-c, k, m, n, p, Two-tailed unpaired Student’s t-test. *r and **r denotes significant regression compared to starting tumor volume. h, Wilcoxon matched-pairs signed rank test. d-f, Mantel–Cox test for survival.

References

    1. Hanahan D & Weinberg RA Hallmarks of cancer: the next generation. Cell 144, 646–674, doi: 10.1016/j.cell.2011.02.013 (2011). - DOI - PubMed
    1. Kim D et al. SHMT2 drives glioma cell survival in ischaemia but imposes a dependence on glycine clearance. Nature 520, 363–367, doi: 10.1038/nature14363 (2015). - DOI - PMC - PubMed
    1. Carlisle AE et al. Selenium detoxification is required for cancer-cell survival. Nat Metab 2, 603–611, doi: 10.1038/s42255-020-0224-7 (2020). - DOI - PMC - PubMed
    1. Spears ME et al. De novo sphingolipid biosynthesis necessitates detoxification in cancer cells. Cell Rep 40, 111415, doi: 10.1016/j.celrep.2022.111415 (2022). - DOI - PMC - PubMed
    1. Lee N, Spears ME, Carlisle AE & Kim D Endogenous toxic metabolites and implications in cancer therapy. Oncogene 39, 5709–5720, doi: 10.1038/s41388-020-01395-9 (2020). - DOI - PMC - PubMed

Publication types

MeSH terms

Substances