. 2023 Nov;623(7986):381-386.
doi: 10.1038/s41586-023-06659-4. Epub 2023 Oct 25.

An ON-type direction-selective ganglion cell in primate retina

Affiliations

An ON-type direction-selective ganglion cell in primate retina

Anna Y M Wang et al. Nature. 2023 Nov.

Abstract

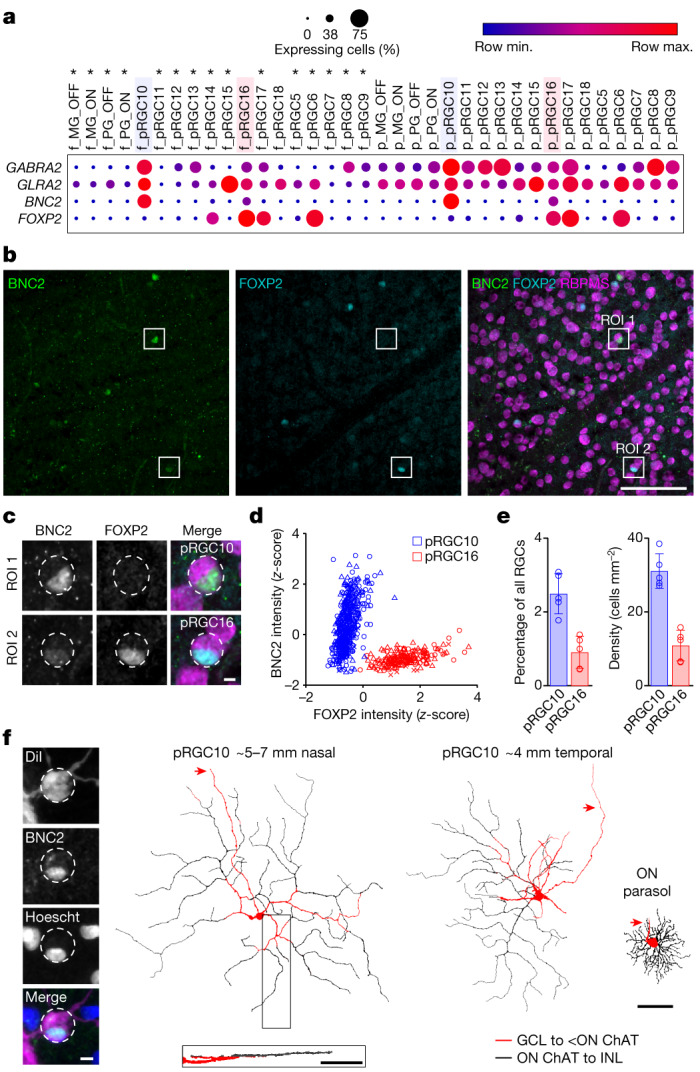
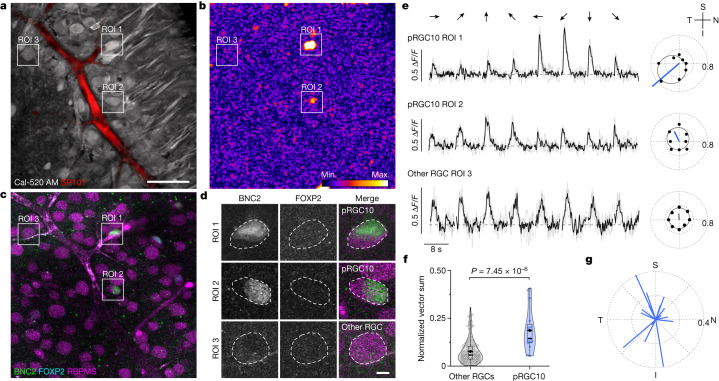
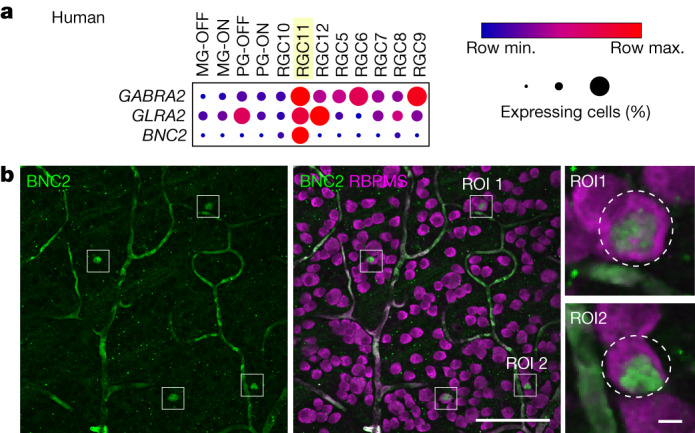
To maintain a stable and clear image of the world, our eyes reflexively follow the direction in which a visual scene is moving. Such gaze-stabilization mechanisms reduce image blur as we move in the environment. In non-primate mammals, this behaviour is initiated by retinal output neurons called ON-type direction-selective ganglion cells (ON-DSGCs), which detect the direction of image motion and transmit signals to brainstem nuclei that drive compensatory eye movements1. However, ON-DSGCs have not yet been identified in the retina of primates, raising the possibility that this reflex is mediated by cortical visual areas. Here we mined single-cell RNA transcriptomic data from primate retina to identify a candidate ON-DSGC. We then combined two-photon calcium imaging, molecular identification and morphological analysis to reveal a population of ON-DSGCs in the macaque retina. The morphology, molecular signature and GABA (γ-aminobutyric acid)-dependent mechanisms that underlie direction selectivity in primate ON-DSGCs are highly conserved with those in other mammals. We further identify a candidate ON-DSGC in human retina. The presence of ON-DSGCs in primates highlights the need to examine the contribution of subcortical retinal mechanisms to normal and aberrant gaze stabilization in the developing and mature visual system.


Conflict of interest statement

The authors declare no competing interests.

Figures

Fig. 1
Fig. 1. BNC2 is a putative marker of macaque ON-DSGCs.
a, Dot plots showing relative expression of inhibitory receptors and cell markers in corresponding foveal (f_) and peripheral (p_) macaque RGC transcriptomic clusters. Circle size indicates the percentage of cells expressing the gene and colour indicates the relative transcript count in expressing cells. Raw data from GEO accession GSE118480. Asterisks denote cell types where the difference between foveal and peripheral GABRA2 and/or GLRA2 expression is more than 2 log fold and P < 0.05 by two-sided Wilcoxon rank-sum test. Max., maximum; min., minimum. Blue and pink highlighting indicates the pRGC10 and pRGC16 clusters, respectively. b, Representative confocal image of macaque GCL immunolabelled for BNC2, FOXP2 and RBPMS. c, Enlargements of indicated regions of interest (ROIs) in b. Images in b and c were 2D median filtered before maximum z-projection. d, z-Score-normalized intensities of BNC2 and FOXP2 for each BNC2+ RGC (n = 733 cells, 3 retinas). Each point represents a single cell, and different symbol shapes indicate data from different macaques. Cells were clustered using k-means analysis. e, Summary of percentages and cell density for pRGC10, with pRGC16 shown for comparison (50,050 RGCs from n = 5 retinas, 3.5–8.5 mm nasal equivalent eccentricity). Data are mean ± s.d. f, Left, confocal image of the soma of a DiI-filled cell showing BNC2 staining in its nucleus (Hoescht). Top right, morphological reconstructions of DiI-filled BNC2+ cells pseudocoloured by stratification depth. Approximate equivalent eccentricities are indicated above the images. Bottom right, side projection of the boxed area of the left cell. Primary dendrites extend in the GCL before diving into the inner plexiform layer (IPL) towards the inner nuclear layer (INL). An ON-parasol ganglion cell at ~4 mm temporal eccentricity is shown on the far right for comparison. Red arrows indicate axons. Scale bars, 100 µm (b); 5 µm (c); 50 µm (f, left); 100 µm (f, top and bottom right). Source Data
Fig. 2
Fig. 2. pRGC10 cells are direction-selective.
a, Whole-mounted macaque retina loaded with Cal-520 AM and sulforhodamine 101 (SR101)—a vascular marker—in the GCL and imaged with a two-photon microscope (standard deviation z-projection). b, Vector sum mapping of the same field highlighting pixels with directional responses. c, Post hoc immunostaining of experimental sample from a,b for BNC2, FOXP2 and RBPMS. d, ROIs from c, showing examples of pRGC10 cells (BNC2+FOXP2RBPMS+, ROI 1 and ROI 2) and another RGC type (BNCFOXP2RBPMS+, ROI 3). Images in c,d are average z-projections; cells in d are averaged over a smaller z depth for better visualization. e, Left, ΔF/F calcium responses of cells in ROI 1, 2 and 3 to bars (500 μm wide) drifting in the 8 directions shown by arrows above traces (0–360°, 45° increments). Responses are averages (black line) of three trials (grey lines) for each stimulus angle from two different scans. The dashed line indicates pre-stimulus baseline. Right, corresponding polar plots showing peak ΔF/F as a function of angle. Von Mises fit (solid black line) and non-normalized vector sum (blue and grey lines) for traces on the left. The orientation of the retina is indicated at top right: S, superior; N, nasal; I, inferior; T, temporal. f, Violin and box plots showing normalized vector sum values for pRGC10 (n = 16 cells) and other RGCs (n = 140 cells) from 6 retinas. The boxes cover the interquartile range, whiskers show minimum and maximum values, the solid black line shows the median, and the diamond represents the mean. Two-sided Wilcoxon rank-sum test. g, Polar plots showing normalized vector sums for all recorded pRGC10 cells. Scale bar, 50 µm (a also applies to b,c), 5 µm (d). Source Data
Fig. 3
Fig. 3. GABAergic inhibition is required for directional tuning of primate ON-DSGCs.
a, Confocal projection of a DiI-filled pRGC10 cell. Regions of the dendritic arbour are shown in b,c. b, Top, ON-SAC dendrites showing putative contacts with DiI-filled cell (arrowheads). Maximum z-projection of 2.47 μm. b, Middle and bottom, side projections from indicated region in top image, showing ON-SAC dendrites alone (middle) and merged with the DiI channel (bottom). Note the ON-DSGC dendrite extending to the OFF-sublamina (arrowhead). Dotted lines delineate IPL borders. c, 3D surface renders show ON-SAC dendrites wrapped around (arrowheads and dotted lines) an ON-DSGC dendrite (indicated by arrow in a). d, Normalized intensity profiles of ChAT and DiI (mean ± s.d. (shaded region), n = 5 cells) with peaks at approximately 64% depth (line). a.u., arbitrary units. e, Top, example calcium imaging field (average z-projection) of the macaque GCL with an ON-DSGC indicated by arrow (see Extended Data Fig. 6 for immunostaining). Bottom, vector sum heat map of the ROI (top) before, during and after washout of gabazine (10 µM). f, Calcium responses of the ON-DSGC in e. Averages of six trials (bold) are overlaid on individual responses (grey). The dashed line shows the pre-stimulus baseline. Stimulus was as in Fig. 2e. g, Polar graph showing peak responses for the cell in f. Vector sum (straight lines) and von Mises fits (smooth lines) are shown for control (black) and gabazine (magenta). h, Average DSIs (black circles) for ON-DSGCs treated with gabazine (6 cells, 3 macaques), washout was obtained in 3 cells. Two-sided Wilcoxon signed rank test. Data are mean ± s.d.; grey circles show individual cells. Scale bars: 100 µm (a), 20 µm (b), 5 µm (c), 50 µm (e, top), 20 µm (e, bottom). Source Data
Fig. 4
Fig. 4. A candidate ON-DSGC in human retina.
a, Dot plots showing the relative expression of genes encoding inhibitory receptor subunits and BNC2 in human RGCs. Circle size corresponds to the percentage of cells expressing the gene and colour indicates relative transcript count in expressing cells. Yellow highlighting indicates the RGC11 cluster. Raw data from GEO GSE148077. b, Human GCL labelled for BNC2 and RBPMS with example RGC11 cells in ROIs. ROI 1 and ROI 2 are shown enlarged on the right. Images in b were 2D median filtered before maximal z-projection of the GCL. Scale bars: main image, 100 µm; enlarged ROI, 5 µm.
Extended Data Fig. 1
Extended Data Fig. 1. Macaque pRGC10 mosaic properties suggest the presence of multiple mosaics.
a, Example confocal image showing BNC2, FOXP2 and RBPMS staining of the macaque GCL with pRGC10 (solid circles) and pRGC16 cells (dashed circles) indicated. Confocal stacks of the GCL were 2D median filtered before max z-projection. b, Example of mosaic analysis area showing positions of pRGC10 (blue) and pRGC16 (red) nuclei. Some pRGC10 nuclei are in close proximity suggesting a lack of self-avoidance whereas pRGC16 cells appear more evenly spaced. Dot sizes are not to scale. Region in square ROI is shown in a. c-d, Voronoi domain areas for pRGC10 (c) and pRGC16 (d) from the total area shown in b. e, Voronoi domain regularity index (VDRI) for the real and random simulated (sim) mosaics of pRGC10 (blue) and pRGC16 (red) (n = 4 retinas). The real pRGC10 mosaics are comparable to random simulations whereas the real pRGC16 mosaic is more regular than its random simulation. The grey dashed line indicates the VDRI of a random array of points (~1.91,,). Data are mean ± s.d. f, Density recovery profiles (DRPs) of pRGC10 (blue bars) and pRGC16 (red bars). Densities were pooled from retinal pieces of similar size and RGC density (4 regions from n = 3 retinas). Both DRPs show a reduced density at distances closer to the reference cell, seen as a “well-like” zone around each cell in the array where other cells are excluded. The x-axis is mirrored to better visualise this “well”. Black dotted lines indicate the average plateau density and white dotted lines mark an average measure of the lowest part of the “well”, based on real data. The well will be deepest for a single mosaic and become progressively shallower as more mosaics are added,. For pRGC16 the density converges at ~21%, which is consistent with the presence of a single mosaic. For pRGC10 the density converges to ~80%, which is consistent with as many as 5 mosaics, however, the data would also be consistent with 3 mosaics, as suggested by the molecular data. Grey lines show DRPs for random simulations with matching numbers of cells and retinal area as the real samples. Overall, the Voronoi domain and DRP analysis indicate that pRGC10 cells have a less regular mosaic structure than pRGC16, consistent with the notion that pRGC10 cells comprise more than one mosaic. Comparisons in e were with a two-sided Wilcoxon rank sum test. Scale bars: 100 µm (a), 500 µm (b). Source Data
Extended Data Fig. 2
Extended Data Fig. 2. pRGC10 cells are comprised of molecular sub-clusters.
a, t-SNE visualisation of macaque peripheral RGC transcriptomic clusters. Raw data were plotted from the dataset of Peng et al., 2019 (GEO: GSE118852). The pRGC10 cluster (red dots, rectangular ROI) is shown enlarged to the right with putative subclusters (Sub) coloured in blue (Sub 1), green (Sub 2) and purple (Sub 3). Other RGC types are shown by grey dots. b, Dot plot showing relative expression of FSTL4 and BNC2 in peripheral RGC clusters. c, Violin and box/whisker plots comparing expression of BNC2 and FSTL4 in the subclusters shown in panel a. Boxes cover the interquartile range, line shows median values, whiskers show max and min values. Sub 1 = 55 cells from 4 animals, Sub 2 = 31 cells from 3 animals, Sub 3 = 17 cells from 3 animals. P-values for two-sided Wilcoxon rank sum test are shown (corrected for multiple comparisons by Bonferroni method). * Denotes comparisons that were statistically significant by Wilcoxon rank sum and > 2 fold difference in mean expression. Raw data in a-c from GEO: GSE118852. d, Confocal image of a horizontal section of the macaque ganglion cell layer immunolabeled with a pan-RGC marker (RBPMS) and probed by RNA in situ hybridization for BNC2 and FSTL4 mRNA. Nuclei are counterstained with DAPI. ROIs 1–4 are shown enlarged in e. e, ROI1-ROI3 from panel d all express BNC2, but only ROI2 shows high levels of FSTL4 expression. ROI4 is an example of an RGC that lacks expression of both genes. From a total of 594 RGCs, 11 were BNC2+ (1.8%) and 3 of those expressed both BNC2 and FSTL4 (27%). Scale bars: 50 µm (d), 10 µm (e) . Source Data
Extended Data Fig. 3
Extended Data Fig. 3. BNC2 + RGCs are concentrated on the horizontal midline.
a, Nasal half of a macaque retina showing the distribution of BNC2+ RGCs. The black oval shows the approximate position of the optic disc for reference. Scale bar = 2 mm. b-d, Left: Heatmaps showing total RGC density (b), BNC2 + RGC density (c) and the percentage of BNC2+ RGCs (d) for the piece shown in a. Note the highest density of BNC2+ cells is on the horizontal midline, whereas the highest percentage of BNC2+ RGCs is in the superior retina. Each box in the heat map represents an area of 500 µm2. The black rectangle in b delineates the analysis region for the plots shown to the right. Right: Plots showing the total RGC density (b), BNC2 + RGC density (c) and the percentage of BNC2+ RGCs (d) as a function of eccentricity for a 2 mm vertical strip centred on the horizontal midline of the retina as indicated in (b). Solid lines are linear fits.
Extended Data Fig. 4
Extended Data Fig. 4. ON-DSGCs show ON responses to spot and bar stimuli and are tuned to slower velocities.
a, Example calcium response of an ON-DSGC (confirmed pRGC10 cell) to bright spots of light presented on a dark background. The cell was positioned in the centre of the scan field and spots were centred on the cell soma. Note the appearance of a small OFF response (arrows) at the termination of the light stimulus for intermediate spot sizes, consistent with reports of sparse OFF bipolar cell input to recursive monostratified RGCs shown previously in macaque. Similar OFF inputs to ON-DSGCs have been reported in other species,. Spot diameters (µm) are shown above traces. b, Normalised ΔF/F integral as a function of spot diameter for the cell shown in a. ON-DSGCs generally responded poorly to full-field stimulation presumably due to activation of surround suppression as is shown for this cell. c, Response of an ON-DSGC to a bright moving bar stimulus (2.3 °/s) on a dark background. Stimulus timing is shown by yellow shading. The black trace is an average of 6 individual trials (grey traces). Note the sustained ON-phase response but lack of an OFF (trailing edge) response. d, Calcium responses of an ON-DSGC to a bar drifting in the null (grey shading) and preferred direction (yellow shading) at velocities ranging from 0.57–9 °/s (125–2000 µm/s). Responses of non-DSGCs from the same scan field to the same stimulus are shown for comparison. e, Average normalised peak ΔF/F response as a function of stimulus velocity for four confirmed ON-DSGCs. Responses are from the preferred direction stimulus. Shading shows ± 1 s.d. Source Data
Extended Data Fig. 5
Extended Data Fig. 5. Identification of mouse ON-DSGCs with calcium imaging and post hoc immunostaining.
a, Dot plots showing relative expression of Bnc2 and Syt6 in mouse RGCs. 10_Novel RGCs (highlighted in magenta) are the predicted ON-DSGC type and 24_Novel (highlighted in cyan) is a predicted ON-OFF DSGC type - both express Bnc2 and Syt6,. Circle size corresponds to the % of cells expressing the gene and color indicates the relative transcript count in expressing cells. Raw data from GEO: GSE137400. b, Left: Average z-projection of an example 2-photon calcium imaging scan field showing GCaMP6f in mouse RGCs. Right: Same region showing post hoc immunostaining for BNC2, SYT6 and RBPMS. Scale bar = 50 µm. ROI 1 and ROI 2 are examples of RGCs that are BNC2 + /SYT6 + /RBPMS + . These ROIs are shown with channels split in lower panels and their functional responses are shown in c. Scale bar = 5 µm. c, Left: ΔF/F traces of the ROIs shown in b to bars drifting in the 8 directions as shown by arrows above traces (0–360° in 45° increments). ROI 1 is an example of a cell classified as an ON-DSGC (molecular cluster Novel_10) and ROI 2 an example of a cell classified as an ON-OFF DSGC (Novel_24). Grey lines show individual trials, black lines show the average of three trials. Dashed line shows baseline. Right: Corresponding polar plots with von Mises fit (smooth black line) and vector sum (red line) for traces shown to the left. The retina is oriented as indicated by the cross (superior (S), nasal (N), inferior (I), temporal (T)). d, Box/violin plots showing normalised vector sum of 10_Novel (n = 55 cells) and 24_Novel RGCs (n = 12 cells) compared to other RGCs (n = 473 cells; n = 3 mice). Kruskal-Wallis test followed by Dunn’s post hoc tests. Boxes cover interquartile range, whiskers indicate minimum and maximum data points, black line indicates median, diamond indicates mean. Open circles indicate data points from GCaMP6f mice, crosses show data points from cells loaded with Cal 590-AM. e, Polar plot showing preferred angle (direction of line) and normalised vector sum (length of line) of 10_Novel RGCs. Vectors are coloured according to the cardinal directions with which they most closely align. f, Polar histograms summarising the preferred directions of Novel_10 cells, which cluster along superonasal, inferonasal and temporal directions of motion on the retina. Radial axis shows the number of cells. Source Data
Extended Data Fig. 6
Extended Data Fig. 6. Post hoc molecular identification of a macaque ON-DSGC treated with gabazine.
a, Calcium imaging scan field as shown in Fig. 3h. b, Post hoc immunostaining of the same area as in a for BNC2, FOXP2 and RBPMS confirms the recorded cell is pRGC10 (RBPMS + /BNC2 + /FOXP2−). Rectangular ROI in b is shown enlarged with a nuclear stain (Hoescht) on the right. Scale bars: main image, 50 µm; inset 10 µm.
Extended Data Fig. 7
Extended Data Fig. 7. Specificity of BNC2 antibodies.
a-b, Macaque flatmount showing GCL labelled for BNC2 (cat.# HPA018525, Sigma) and RBPMS. BNC2 labels the nuclei of a sparse subset of RGCs similar to the pattern seen with rabbit anti-BNC2 (cat.# PA584417, Invitrogen). Square ROIs show examples of BNC2+ cells. c, Dot-plot showing relative expression of SLC17A8 (VGLUT3) and BNC2 in peripheral glycinergic amacrine (pGl) cells. High expression of both genes is evident in pGl6. Raw data from GEO: GSE118852. d-e, Wholemount of macaque retina showing immunolabelling for BNC2 and VGLUT3 at the level of the inner nuclear layer. f, Vertical section of macaque retina showing amacrine cells that express both BNC2 and VGLUT3. The same cells are labelled with both antibodies in e and f, consistent with the transcriptomic data in c. Arrows in f show examples of double labelled cells. Scale bars: 100 µm (a-b); 50 µm (d-f) .
Extended Data Fig. 8
Extended Data Fig. 8. BNC2+ cells with bistratified morphology.
a, Z-projection (maximum) of a bistratified BNC2+ cell filled with DiI. The fill is depth coded to highlight OFF (cyan) and ON (red) dendrites in the IPL. b, Same cell as in a showing BNC2+ staining in the nucleus (demarcated by Hoescht staining). Note that some crosstalk of the DiI signal is present in the BNC2 channel, but the nuclear pattern of BNC2 staining is evident with the DiI and BNC2 channels merged. c-d, Side projections of the boxed areas in a showing ON and OFF dendrites in the IPL. The borders of the IPL are demarcated by dotted lines based on Hoescht staining. Scale bars:100 µm (a), 5 µm (b), 20 µm (c, d).

References

    1. Vaney DI, Sivyer B, Taylor WR. Direction selectivity in the retina: symmetry and asymmetry in structure and function. Nat. Rev. Neurosci. 2012;13:194–208. doi: 10.1038/nrn3165. - DOI - PubMed
    1. Dhande OS, et al. Genetic dissection of retinal inputs to brainstem nuclei controlling image stabilization. J. Neurosci. 2013;33:17797–17813. doi: 10.1523/JNEUROSCI.2778-13.2013. - DOI - PMC - PubMed
    1. Yonehara K, et al. Identification of retinal ganglion cells and their projections involved in central transmission of information about upward and downward image motion. PLoS ONE. 2009;4:e4320. doi: 10.1371/journal.pone.0004320. - DOI - PMC - PubMed
    1. Harris SC, Dunn FA. Asymmetric retinal direction tuning predicts optokinetic eye movements across stimulus conditions, eLife. 2023;12:e81780. doi: 10.7554/eLife.81780. - DOI - PMC - PubMed
    1. Barlow HB, Hill RM, Levick WR. Retinal ganglion cells responding selectively to direction and speed of image motion in the rabbit. J. Physiol. 1964;173:377–407. doi: 10.1113/jphysiol.1964.sp007463. - DOI - PMC - PubMed

Publication types

Substances