. 2023 Nov;623(7986):356-365.
doi: 10.1038/s41586-023-06671-8. Epub 2023 Oct 25.

Dopaminergic systems create reward seeking despite adverse consequences

Affiliations

Dopaminergic systems create reward seeking despite adverse consequences

Kristijan D Jovanoski et al. Nature. 2023 Nov.

Erratum in

Abstract

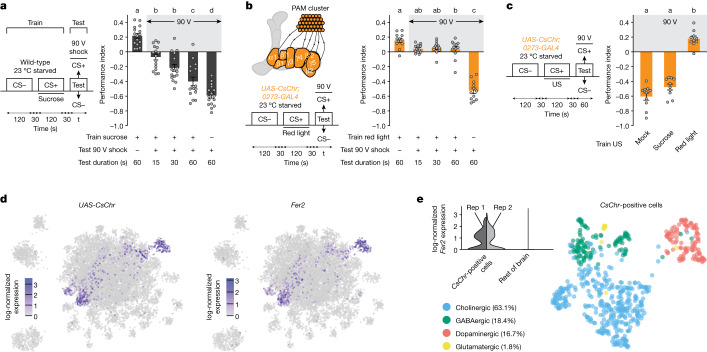
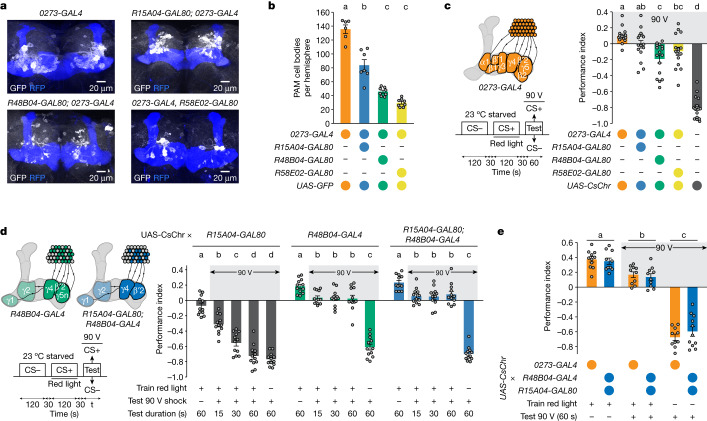
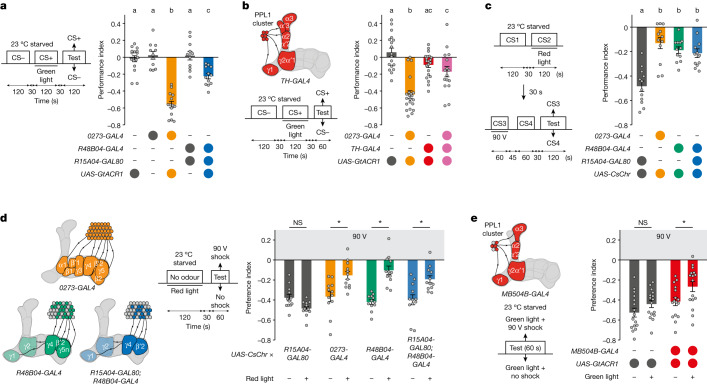
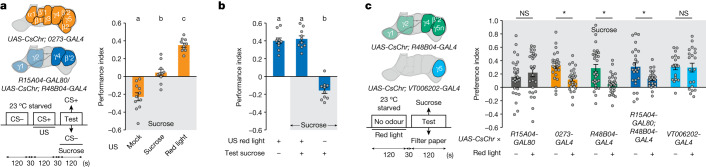
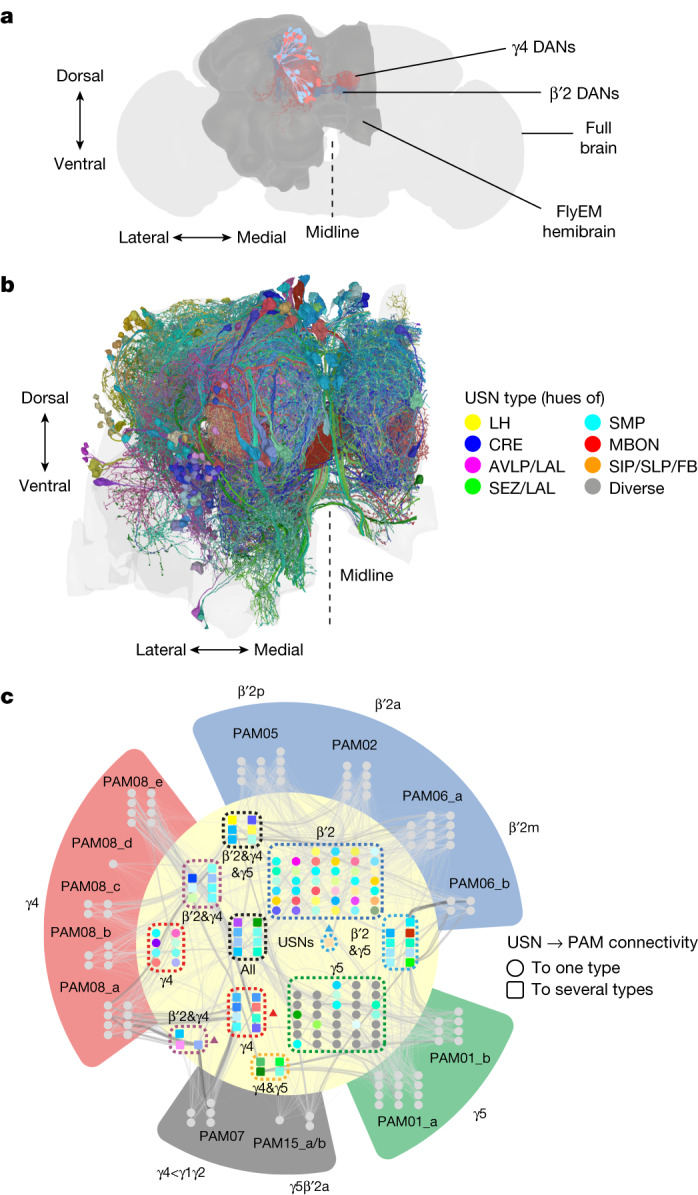
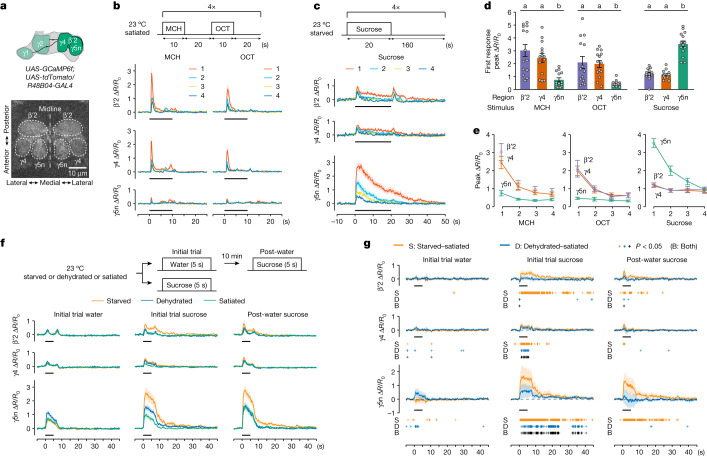
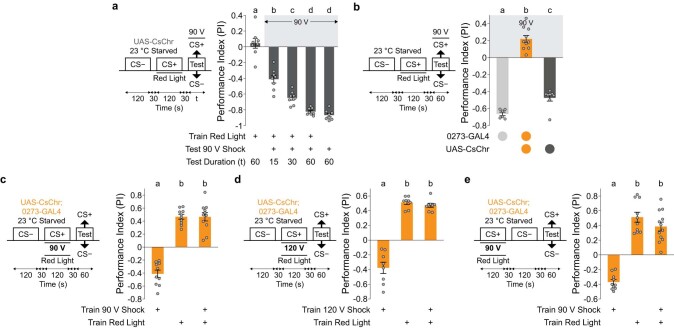
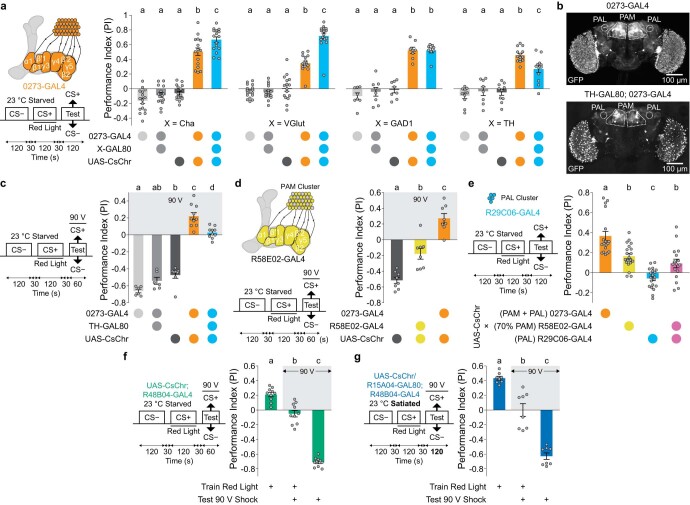
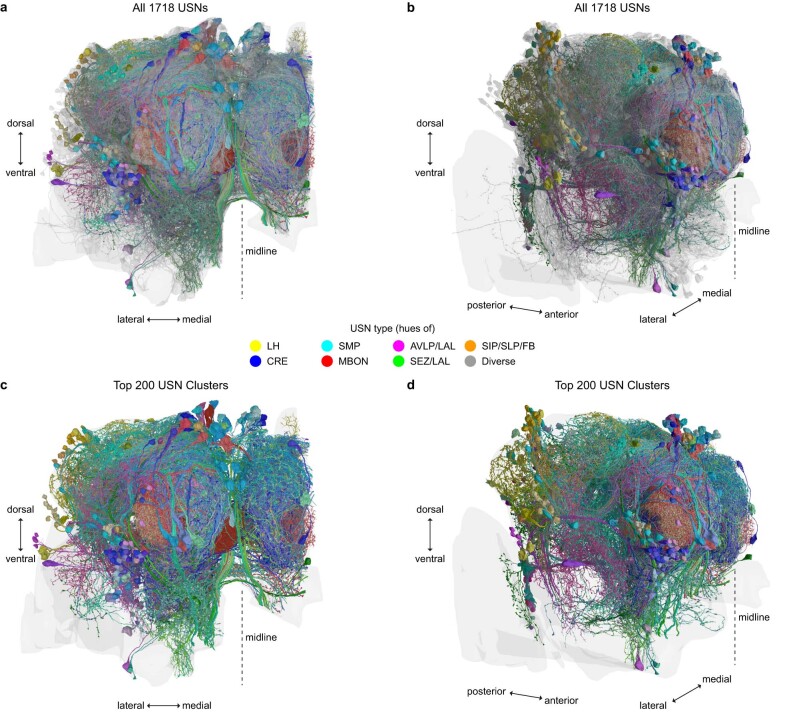
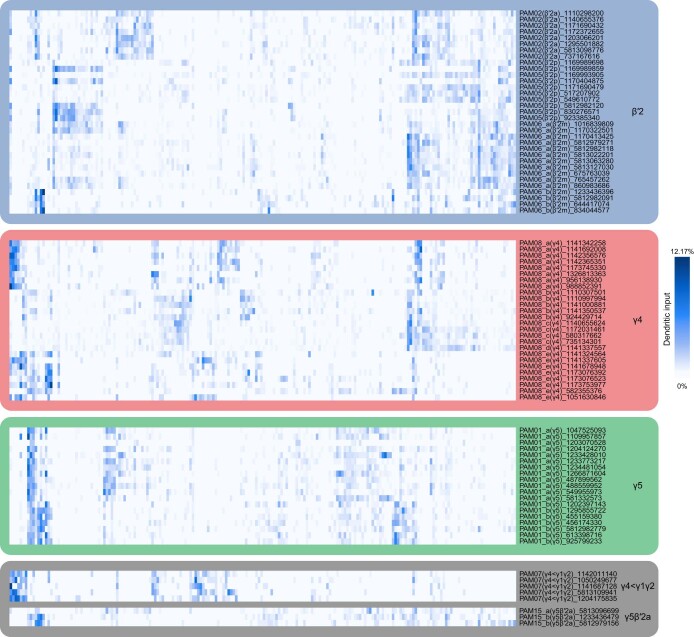
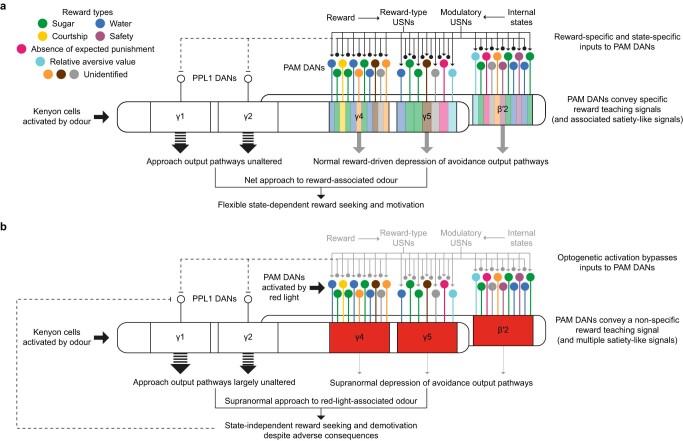
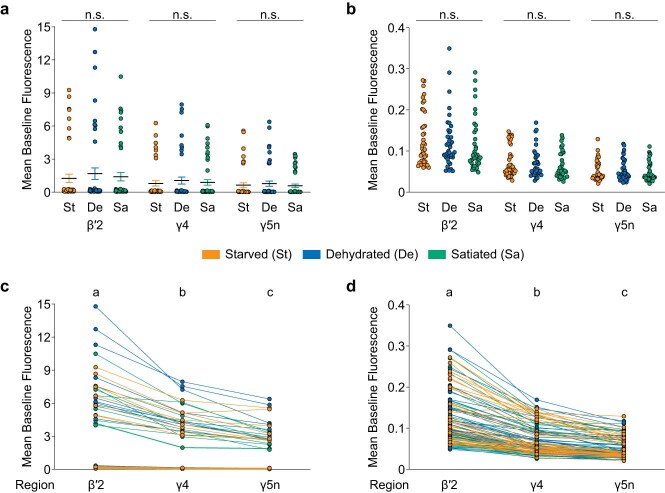
Resource-seeking behaviours are ordinarily constrained by physiological needs and threats of danger, and the loss of these controls is associated with pathological reward seeking1. Although dysfunction of the dopaminergic valuation system of the brain is known to contribute towards unconstrained reward seeking2,3, the underlying reasons for this behaviour are unclear. Here we describe dopaminergic neural mechanisms that produce reward seeking despite adverse consequences in Drosophila melanogaster. Odours paired with optogenetic activation of a defined subset of reward-encoding dopaminergic neurons become cues that starved flies seek while neglecting food and enduring electric shock punishment. Unconstrained seeking of reward is not observed after learning with sugar or synthetic engagement of other dopaminergic neuron populations. Antagonism between reward-encoding and punishment-encoding dopaminergic neurons accounts for the perseverance of reward seeking despite punishment, whereas synthetic engagement of the reward-encoding dopaminergic neurons also impairs the ordinary need-dependent dopaminergic valuation of available food. Connectome analyses reveal that the population of reward-encoding dopaminergic neurons receives highly heterogeneous input, consistent with parallel representation of diverse rewards, and recordings demonstrate state-specific gating and satiety-related signals. We propose that a similar dopaminergic valuation system dysfunction is likely to contribute to maladaptive seeking of rewards by mammals.


Conflict of interest statement

The authors declare no competing interests.

Figures

Fig. 1
Fig. 1. Fer2-expressing 0273 neurons drive reward seeking despite shock.
a, Left, experimental protocol. Starved wild-type flies were trained to associate an odour (the CS+) with sucrose. t, test period. Right, learned CS+ approach can be competed with in a time-dependent manner by presenting the CS+ with 90 V shock (n = 16). Groups on the far left and far right show 60 s tests of sucrose-trained flies without electrified CS+ and 60 s shock avoidance of mock-trained flies, respectively. b, Top left, schematic of DANs labelled by 0273-GAL4 (other labelled neurons are not shown) that project from the PAM cluster to horizontal lobe mushroom body compartments. Bottom left, experimental protocol. Right, starved transgenic flies trained with CsChr activation of 0273 neurons do not show a time-dependent increase in CS+/90 V avoidance (n = 12). c, Left, experimental protocol. US, unconditioned stimulus. Right, starved flies trained with 0273-neuron activation approach reward-predicting CS+ despite 90 V shock. Mock-trained and sucrose-trained flies exhibit shock avoidance (n = 10). Different letters above bars in ac indicate groups that are significantly different from each other (P < 0.05; one-way ANOVA then Tukey’s honestly significant difference (HSD)). Data are mean ± s.e.m.; dots are individual data points that correspond to independent behavioural experiments. Exact statistical values and comparisons are presented in Supplementary Information. d, UMAP projections of scRNA-seq data show that neuron-driven CsChr expression (left) overlaps with Fer2 expression (right). e, Top left, CsChr-positive cells express Fer2 in both biological replicates (Rep 1 and Rep 2) whereas Fer2 expression is almost absent in the rest of the brain. Right, CsChr-expressing cells co-express marker genes for cholinergic (63.1% of all cells), GABAergic (18.4%), dopaminergic (16.7%) or glutamatergic (1.8%) neurons.
Fig. 2
Fig. 2. Specific PAM DANs recapitulate 0273-neuron-mediated reward seeking.
a, Representative GFP expression in DANs driven by 0273-GAL4 combined with different GAL80 transgenes: R15A04-GAL80, R48B04-GAL80 or R58E02-GAL80. Mushroom body is co-labelled with RFP for reference. Three brains were examined for 0273-GAL4, four brains were examined for the other genotypes. b, R58E02-GAL80 produces the greatest reduction in number of PAM somata per hemisphere labelled by 0273-GAL4, followed by R48B04-GAL80 then R15A04-GAL80 (left to right: n = 6, 8, 8 and 8). c, Left, schematic and experimental protocol. Right, R48B04-GAL80 produces the greatest shock-induced reversal of reward seeking driven by 0273 neurons, followed by R58E02-GAL80. R15A04-GAL80 has no significant effect (n = 16). d, Left, schematics and experimental protocol. Bottom, starved flies trained with R48B04-GAL4 (with or without R15A04-GAL80) neuron activation do not show the time-dependent increase in CS+/90 V avoidance observed in R15A04-GAL80 controls (n = 12). Different letters above bars in bd indicate groups that are significantly different from each other (P < 0.05; one-way ANOVA then Tukey’s HSD; comparisons in d only within genotypes). e, Preference for CS+/90 V is similar for flies harbouring memory implanted by activation of 0273 neurons or β′2&γ4 DANs (left to right: n = 11, 10, 10, 10, 10 and 11; protocol as in c). Different letters above bars indicate treatments that are significantly different (P < 0.05; two-way ANOVA then Tukey’s HSD; main effect of treatment: F(2,56) = 262.1, P < 0.0001). Data are mean ± s.e.m.; dots are individual data points that correspond to individual hemispheres (b) or independent behavioural experiments (ce). Exact statistical values and comparisons are presented in Supplementary Information.
Fig. 3
Fig. 3. Reward DANs antagonize aversive DAN function.
a, Left, schematics and protocol. Right, optogenetic silencing of 0273 neurons implants aversive memory for CS+ odour. Silencing β′2&γ4 DANs (R15A04-GAL80; R48B04-GAL4) forms aversive memory with less strength (left to right: n = 16, 11, 14, 11 and 12). b, Left, protocol and schematic of DANs labelled by TH-GAL4 (other labelled neurons not shown) that project from PPL1 to vertical lobe mushroom body compartments. Right, optogenetic silencing of TH-GAL4 DANs alone has no effect, whereas silencing both 0273 neurons and TH-GAL4 neurons largely abrogates aversive memory implanted with 0273-neuron silencing (left to right: n = 18, 21, 21, 16). c, Left, experimental protocol. Right, flies trained with artificial DAN activation do not learn a subsequent shock-paired CS+ as effectively as R15A04-GAL80 controls (n = 12). Different letters above bars in ac indicate groups that are significantly different from each other (P < 0.05; one-way ANOVA then Tukey’s HSD). d, Left, schematics and experimental protocol. Right, flies that experience optogenetic activation in an odourless tube show less subsequent shock avoidance than no-light controls of the same genotype (n = 12). e, Left, schematic and protocol. Right, flies with silenced PPL1 DANs exhibit less shock avoidance than controls (n = 16). d,e, *P < 0.05; two-way ANOVA then multiple comparisons with Šidák’s correction. NS, not significant. Data are mean ± s.e.m.; dots are individual data points that correspond to independent behavioural experiments. Exact statistical values and comparisons are presented in Supplementary Information.
Fig. 4
Fig. 4. Reward DAN activity reduces subsequent need seeking.
a, Left, schematics and experimental protocol. Right, starved flies trained with 0273-neuron activation (orange) disregard sucrose to seek the CS+ odour predicting artificial reward, whereas flies trained with sucrose exhibit no preference, and mock-trained flies prefer sucrose (left to right: n = 11, 10 and 10). b, Starved flies trained with activation of β′2&γ4 DANs also disregard sucrose to seek artificial reward (n = 10, unconditioned stimulus is the red light protocol from a and genotype corresponds to the schematic with blue regions in a). Different letters above bars in a,b indicate groups that are significantly different from each other (P < 0.05; one-way ANOVA then Tukey’s HSD). c, Left, schematics and protocol. Right, activation of 0273 neurons, R48B04 DANs, or β′2&γ4 DANs in an odourless tube decreases subsequent sucrose approach in starved flies (left to right: n = 26, 26, 26, 26, 28, 28, 24, 24, 20 and 20). Two-way ANOVA then multiple comparisons with Šidák’s correction. Data are mean ± s.e.m.; dots are individual data points that correspond to independent behavioural experiments. Exact statistical values and comparisons are presented in Supplementary Information.
Fig. 5
Fig. 5. Reward DANs receive diverse and heterogeneous input.
a, Volumetric reconstructions of β′2 DANs (PAM02, PAM05 and PAM06 (blue)) and γ4 DANs (PAM08 (red)) within the FlyEM hemibrain (dark grey) overlaid on a complete standard fly brain (light grey). b, Frontal view of volumetric reconstructions of the 402 USNs constituting the top 200 most strongly connected clusters to β′2 and γ4 DANs. USNs are rendered in hues of colours according to neurite location and are shown within the hemibrain neuropil (grey). Additional orientations and reconstructions of all 1,718 USNs connected to β′2 and γ4 DANs are presented in Extended Data Fig. 7 and Supplementary Video 1. c, Network diagram of USNs (inner cream circle) to β′2, γ4 and γ5 DANs (outer wedges) reveals a highly parallel input structure (thresholded at 0.4% of dendritic inputs for visibility). Individual DANs in outer wedges (grey circles) are grouped according to their compartments and types (different coloured wedges) and by subtype. USN clusters are grouped by connectivity pattern (dotted outlines) and connectivity to either one DAN type (circles) or multiple DAN types (squares) is denoted. Outlined USN clusters are labelled with corresponding DAN type targets; triangles mark USN groups that also innervate γ4<γ1γ2 DANs. USN node colours match those in b. Connector weight and transparency represents the percentage of dendritic input to these DANs provided by that USN (range 0.4% to 12.17%). See Extended Data Fig. 8 for a non-thresholded connectivity heat map and Supplementary Tables 1 and 2 and Methods for all connectivity information.
Fig. 6
Fig. 6. Physiological state-dependent control of DAN responses.
a, Schematic (top) and two-photon imaging of regions of interest (ROI) (bottom) for DANs co-expressing GCaMP6f (displayed) and tdTomato. b, Top, odour presentation protocol. Bottom, calcium responses in β′2 (top), γ4 (middle) and γ5n DANs (bottom) to each MCH (left) and OCT (right) presentation. Black bars throughout indicate stimulus application. c, Top, sucrose presentation protocol. Bottom, DAN responses to each sucrose presentation. d, Peak heights of first DAN responses to MCH, OCT or sucrose. β′2 and γ4 DANs exhibit larger odour responses whereas γ5n DANs have larger sucrose responses. The break in the x axis demarcates separate experiments. Different letters above bars indicate significantly different regions (P < 0.05; two-way repeated measures ANOVA for each odour or one-way repeated measures ANOVA for sucrose then Tukey’s HSD). e, Only γ5n DAN peak responses diminish with repeated sucrose presentations. Data in d,e are mean ± s.e.m.; dots are individual data points that correspond to individual flies. f, Top, feeding protocol. Bottom, responses of β′2 (top), γ4 (middle) and γ5n DANs (bottom) to initial-trial water (left), initial-trial sucrose (middle) or post-water sucrose (right) in starved, dehydrated or satiated flies. g, Mean difference curves for responses in starved or dehydrated flies versus satiated flies. Crosses indicate significantly different recording frames (P < 0.05; two-sided unpaired t-test, not corrected for multiple comparisons). S, starved − satiated; D, dehydrated − satiated; B, common to S and D. Response curves show mean ± s.e.m. (b,c,f) or mean difference ± 95% confidence interval (g) for the normalized ratio of GCaMP6f to tdTomato signal (ΔR/R0); presentation numbers or physiological states are denoted by curve colour. n = 14 flies (be) and n = 24 flies (f,g). Exact statistical values and comparisons are presented in Supplementary Information.
Extended Data Fig. 1
Extended Data Fig. 1. 0273 neurons drive reward seeking despite shock during training or testing.
a, Left: Protocol. Right: Starved UAS-CsChr control flies show a time-dependent increase in CS+/90 V avoidance (n = 8). b, Left: Protocol. Right: Starved flies trained with 0273-neuron activation approach the reward-predicting CS+ despite 90 V shock during testing compared with genetic controls (n = 6, 10, 8). c, Left: Protocol. Right: Starved flies trained with odour and 0273-neuron stimulation display strong conditioned approach even when 90 V shocks are presented with the CS+ during training (n = 10, 10, 11). d, Left: Protocol. Right: Starved flies trained with odour and 0273-neuron stimulation display strong conditioned approach after 120 V shocks are presented with the CS+ during training (n = 8). e, Left: Protocol. Right: Similar results are observed when the sequence of CS+ and CS− odours are reversed during 90 V training (n = 10, 10, 12). Different letters above bars indicate significantly different groups (p < 0.05; one-way ANOVA then Tukey’s HSD). All data mean ± SEM; dots are individual data points that correspond to independent behavioural experiments. Exact statistical values and comparisons in Supplementary Information.
Extended Data Fig. 2
Extended Data Fig. 2. Identification of DANs that drive reward seeking despite shock.
a, Left: Schematic and protocol. Right: GAL80 co-expression with 0273-GAL4 reveals that removing cholinergic expression with Cha-GAL80 (n = 16) or glutamatergic expression with VGlut-GAL80 (n = 16) significantly enhances 0273-reinforced memory, removing GABAergic expression with GAD1-GAL80 (n = 8) has no effect, and removing dopaminergic expression with TH-GAL80 (n = 10, 8, 10, 14, 12) reduces memory. b, Combining TH-GAL80 with 0273-GAL4 visibly reduces GFP expression in DANs in the PAM and PAL clusters (dashed shapes). Representative images from one of two brains for each genotype shown. c, Left: Protocol. Right: TH-GAL80 impairs 0273-driven shock-resistant reward seeking (n = 6, 6, 8, 10, 10). d, Left: Protocol and schematic of R58E02-GAL4, which labels ~70% of PAM DANs. Right: R58E02-reinforced memory does not override avoidance of the shock-paired CS+ as effectively as 0273-reinforced memory (n = 8). e, Left: Protocol and schematic of PAL cluster DANs labelled by R29C06-GAL4 (other labelled neurons not shown). Right: R58E02-labelled PAM DAN and R29C06-labelled PAL DAN coactivation does not reproduce memory performance after 0273 activation (n = 18, 20, 20, 16). f, Left: Protocol. Right: Starved flies trained with activation of R48B04 neurons seek reward despite simultaneous 90 V shock (n = 10). g, Left: Protocol. Right: Satiated flies trained with activation of β′2&γ4 DANs seek reward for 120 s despite 90 V shock (n = 8). Different letters above bars indicate significantly different groups (p < 0.05; one-way ANOVA then Tukey’s HSD). All data mean ± SEM; dots are individual data points that correspond to independent behavioural experiments. Exact statistical values and comparisons in Supplementary Information.
Extended Data Fig. 3
Extended Data Fig. 3. Expression patterns of PAM DAN driver lines that are required for shock-resistant reward seeking.
a, Table summarizing all PAM cluster expression and other expression for each driver line whose artificial activation reinforces shock-resistant reward seeking. References containing images of expression patterns are listed. b, Representative GFP expression (white) driven by R48B04-GAL4 combined with R15A04-GAL80, and the mushroom body (blue) co-labelled with RFP for reference. c, Magnified mushroom body GFP expression driven by R15A04-GAL80; R48B04-GAL4. d, R15A04-GAL80; R48B04-GAL4 drives GFP expression in β′2 DANs (dashed shapes). e, R15A04-GAL80; R48B04-GAL4 also drives GFP expression in γ4 DANs but not γ5 DANs (dashed shapes). The representative images in b, c, d, e are reproduced from source confocal data of one of two brains from ref. . f, Left: Schematics and protocol. Right: UAS-CsChr; R48B04-GAL4 flies artificially trained with red light exhibit shock-resistant reward seeking that is impaired by R58E02-GAL80 coexpression (n = 10). g, Left: Schematics and protocol. Right: tsh-GAL80 coexpression did not impair shock-resistant reward seeking driven by UAS-CsChr; R48B04-GAL4 (n = 10, 10, 8). Different letters above bars indicate significantly different groups (p < 0.05; one-way ANOVA then Tukey’s HSD). All data mean ± SEM; dots are individual data points that correspond to independent behavioural experiments. Exact statistical values and comparisons in Supplementary Information.
Extended Data Fig. 4
Extended Data Fig. 4. Flies trained with coactivation of sufficient β′2 and γ4 DANs seek reward even after experiencing the CS+ odour with shock.
a, Left: Schematics and protocol. Right: Only training with activation of both β′2 and γ4 DANs paired with an odour leads to substantial conditioned approach (n = 8, MB312C n = 9). Breaks in x-axis demarcate separate experiments. Asterisks indicate significantly different groups (p < 0.05; two-sided unpaired t-test for each genotype with Holm-Šidák’s correction; n.s. = not significant). b, Left: Schematic and protocol. Right: Red-light-trained MB042B flies expressing UAS-CsChr exhibit only minor conditioned approach that is not shock-resistant (n = 8). c, Left: Schematic and protocol. Right: Red-light-trained MB316B flies expressing UAS-CsChr similarly exhibit minor conditioned approach that is not shock-resistant (n = 8). Different letters above bars in b, c indicate significantly different groups (p < 0.05; one-way ANOVA then Tukey’s HSD). d, Left: Consecutive testing protocol. Right: Flies with β′2&γ4 DAN-implanted memories subjected to consecutive testing in the presence of shock continue to approach the electrified CS+ odour irrespective of their first test choice (n = 10). Different letters above bars indicate significantly different groups (p < 0.05; two-way ANOVA then multiple comparisons with Šidák’s correction). Note that not all flies in the Retest CS− groups have necessarily experienced the CS+ during the first test (and vice versa for the Retest CS+ groups). e, Left: Consecutive training protocol. Right: Flies with β′2&γ4 DAN implanted memory and then trained to associate the CS+ with shock continue to approach the reward-predicting CS+ compared with control flies (n = 12). Different letters above bars indicate significantly different groups (p < 0.05; one-way ANOVA then Tukey’s HSD). All data mean ± SEM; dots are individual data points that correspond to independent behavioural experiments. Exact statistical values and comparisons in Supplementary Information.
Extended Data Fig. 5
Extended Data Fig. 5. Reward DAN activation impedes subsequent shock avoidance.
a, Left: Protocol. Right: Artificial activation of TH neurons does not affect subsequent naïve shock avoidance, nor does TH neuron coactivation with 0273 neurons restore shock avoidance performance (n = 12; * p < 0.05; two-way ANOVA then multiple comparisons with Šidák’s correction; n.s. = not significant). b, Left: Protocol with variable time t between red light activation and shock avoidance testing. Right: Naïve shock avoidance remains impaired compared with genetic and protocol controls 10 min after β′2&γ4 DAN activation but returns to normal levels by 60 min (n = 20; * p < 0.05; two-way ANOVA then Tukey’s HSD). c, Left: Protocol. Right: Naïve shock avoidance is impaired after β′2&γ4 DANs are activated for just 30 s (n = 10; * p < 0.05; two-sided unpaired t-test). d, Left: Protocol. Right: Sucrose presentation to starved flies for 120 s does not affect subsequent naïve shock avoidance in UAS-CsChr/R15A04-GAL80; R48B04-GAL4 flies or UAS-CsChr/R15A04-GAL80 flies (n = 8; p > 0.05; two-way ANOVA; main effect of treatment: F(1,28) = 104.9, p = 0.66). All data mean ± SEM; dots are individual data points that correspond to independent behavioural experiments. Exact statistical values and comparisons in Supplementary Information.
Extended Data Fig. 6
Extended Data Fig. 6. 0273 neurons and β′2&γ4 DANs drive reward seeking over sucrose.
a, Left: Protocol. Right: Starved flies trained with odours and optogenetic activation of 0273 neurons exhibit similar reward approach for testing periods of 60 s or 120 s (n = 10; p > 0.05; two-sided unpaired t-test; n.s. = not significant). b, Left: Protocol. Right: Starved UAS-CsChr; R58E02-GAL4 flies or UAS-CsChr/TH-GAL80; 0273-GAL4 flies show reduced preference for the reward-predicting CS+ over the sucrose-laden CS− (n = 14, 14, 10, 14, 14, 11). c, Left: Protocol (same as Fig. 4b). Right: Starved flies trained with optogenetic activation of R48B04 DANs disregard sucrose to seek artificial reward (n = 10). d, Left: Protocol. Right: Optogenetic training does not form an avoidance memory for the CS− odour (n = 10). e, Left: Protocol. Right: Optogenetic training does not potentiate simultaneous training with sucrose (n = 10; p > 0.05; one-way ANOVA). f, Left: Protocol. Right: Flies trained with one odour paired with 0273 activation and another odour paired with sucrose, prefer the previously red-light-paired odour at testing, irrespective of the training presentation sequence (n = 10). g, Left: Protocol. Right: Flies similarly trained with β′2&γ4 DAN activation and sucrose also prefer the red-light-paired odour at testing compared with genetic and protocol controls (n = 14, 14, 12, 14, 14, 12). Different letters above bars in b, c, d, f, g indicate significantly different groups (p < 0.05; one-way ANOVA then Tukey’s HSD). h, Left: Protocol. Right: Coactivation of γ5n DANs with β′2&γ4 DANs during artificial training reduces CS+ approach performance irrespective of deprivation state (n = 12). Different letters above bars indicate significantly different genotypes (p < 0.05; two-way ANOVA then Tukey’s HSD; main effect of genotype: F(2,99) = 104.9, p < 0.0001). All data mean ± SEM; dots are individual data points that correspond to independent behavioural experiments. Exact statistical values and comparisons in Supplementary Information.
Extended Data Fig. 7
Extended Data Fig. 7. Inputs to β′2 and γ4 DANs represent a wide variety of information from across the brain.
a, Frontal view of volumetric reconstructions of all 1718 upstream neurons (USNs) to β′2 and γ4 DANs from across the brain shown within the hemibrain neuropil (grey). The 402 USNs constituting the top 200 most strongly connected clusters to β′2 and γ4 DANs are rendered in hues of colours according to neurite location and all other USNs are grey. b, Latero-frontal view of the same 1718 USNs. c, Frontal view of the 402 USNs constituting the 200 most strongly connected clusters to β′2 and γ4 DANs (same as Fig. 5b; reproduced here for comparison). d, Latero-frontal view of the same 402 USNs. See Supplementary Video 1 for additional orientations and Supplementary Table 2 for all connectivity information.
Extended Data Fig. 8
Extended Data Fig. 8. Heatmap of inputs to β′2, γ4, and γ5 DANs.
Connectivity heatmap of the 200 strongest upstream neuron (USN) clusters (comprising 450 USNs) to β′2 (PAM02, PAM05, PAM06) DANs, γ4 (PAM08) DANs, γ5 (PAM01) DANs, γ4<γ1γ2 (PAM07) DANs, and γ5β′2a (PAM15) DANs in the right hemisphere of the FlyEM hemibrain. The USN clusters group together and reveal an elaborate parallel structure through their connectivity to single or multiple DAN subtypes. Values represent the percentage dendritic input from individual USN clusters (columns) to individual DANs (rows). All connectivity information is available in Supplementary Table 1.
Extended Data Fig. 9
Extended Data Fig. 9. Artificial activation of β′2, γ4, and γ5 DANs simultaneously conveys multiple reward types and satiety-like signals.
a, In healthy flies, β′2, γ4, and γ5 PAM DANs are activated by specific reward-type upstream neurons (USNs, with excitatory arrow inputs) and modulated by modulatory USNs (with modulatory circle inputs). Some modulatory USNs may also inhibit PPL1 DANs that convey aversive punishment to the γ1 and γ2 compartments,. The PAM DANs are coloured according to the rewards they may represent according to prior studies,–, in addition to rewards that have not yet been identified. When a healthy fly encounters a reward in a presence of an odour, the reward activates only specific reward-type USNs, whose activation of PAM DANs is concurrent with modulatory input from USNs conveying information about the corresponding physiologically relevant internal state. The PAM DANs therefore convey specific reward teaching signals (and associated satiety-like signals) in a state-appropriate manner to mushroom body Kenyon cells that are coincidentally activated by the odour, leading to normal reward-driven depression of avoidance output pathways. Since approach pathways from the mushroom body are unaffected by reward signalling, flies subsequently demonstrate a net approach to the reward-associated odour, enabling flexible state-dependent reward seeking and motivation. b, In flies whose β′2, γ4, and γ5 PAM DANs express CsChr and are activated directly by red light, information about specific reward types and physiologically relevant internal states is disregarded. The PAM DANs convey a non-specific reward teaching signal consisting of the combined value of multiple rewards (and multiple satiety-like signals) to Kenyon cells, leading to supranormal depression of avoidance output pathways. Flies subsequently demonstrate supranormal approach to the red-light-associated odour, resulting in state-independent reward seeking and demotivation to other natural rewards. PPL1 DANs that convey aversive punishment to the γ1 compartment also consequently undergo indirect inhibition, which manifests when flies display punishment-resistant reward seeking.
Extended Data Fig. 10
Extended Data Fig. 10. Manipulations of physiological state do not affect the baseline calcium signals of R48B04 DANs.
a, The mean baseline fluorescence (for the 60 s before stimulus presentation relative to the mean of a non-implicated region) of the initial-trial water and initial-trial sucrose samples in Fig. 6f for β′2, γ4, and γ5n DANs (n = 48 flies per state). All data mean ± SEM. b, Distribution of samples with mean baseline fluorescence below 0.4 (81.25% of all samples) for clarity. c, Each region has a different mean baseline fluorescence irrespective of physiological state (n = 144 flies in total from three states). Each data point from each region is connected to two data points corresponding to the other two regions of the same fly. d, Comparison across regions for 81.25% of samples with mean baseline fluorescence below 0.4 for clarity. Dots are individual data points that correspond to individual flies. All data points and connecting lines are coloured according to the physiological state of each fly (Starved: St, orange; Dehydrated: De, blue; or Satiated: Sa, green). No differences in mean baseline fluorescence are observed across physiological states in a, b (two-way ANOVA; main effect of state F(2,141) = 0.2188; p = 0.8038; n.s. = not significant). Different letters above groups in c, d indicate significantly different regions (p < 0.05; two-way repeated measures ANOVA then Tukey’s HSD; main effect of region F(2,282) = 29.23; p < 0.0001). Exact statistical values and comparisons in Supplementary Information.

Comment in

References

    1. Altman J, et al. The biological, social and clinical bases of drug addiction: commentary and debate. Psychopharmacology. 1996;125:285–345. doi: 10.1007/BF02246016. - DOI - PubMed
    1. Wise RA, Bozarth MA. A psychomotor stimulant theory of addiction. Psychol. Rev. 1987;94:469–492. doi: 10.1037/0033-295X.94.4.469. - DOI - PubMed
    1. Lüscher C, Janak PH. Consolidating the circuit model for addiction. Annu. Rev. Neurosci. 2021;44:173–195. doi: 10.1146/annurev-neuro-092920-123905. - DOI - PubMed
    1. Diagnostic and Statistical Manual of Mental Disorders, 5th Edn (American Psychiatric Association, 2022).
    1. Olds J. Self-stimulation of the brain; its use to study local effects of hunger, sex, and drugs. Science. 1958;127:315–324. doi: 10.1126/science.127.3294.315. - DOI - PubMed

Publication types

LinkOut - more resources