. 2023 Nov;623(7987):562-570.
doi: 10.1038/s41586-023-06681-6. Epub 2023 Oct 25.

A single photoreceptor splits perception and entrainment by cotransmission

Affiliations

A single photoreceptor splits perception and entrainment by cotransmission

Na Xiao et al. Nature. 2023 Nov.

Abstract

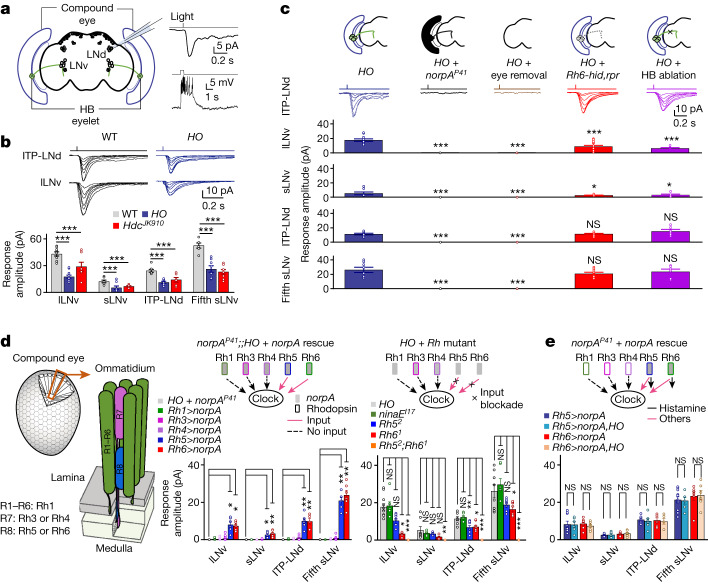
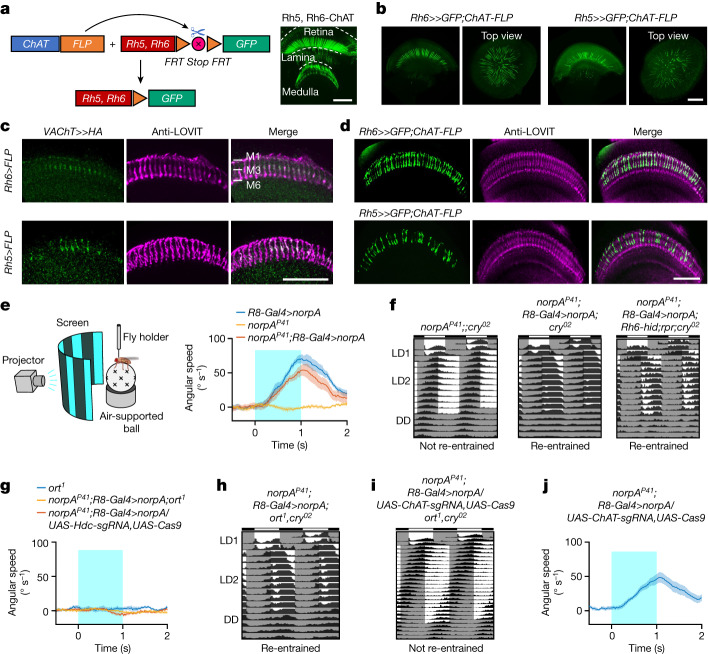
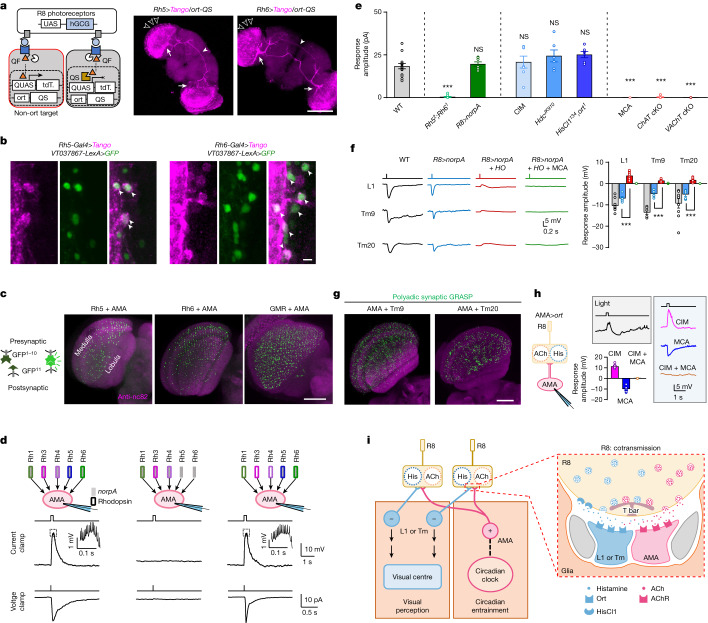
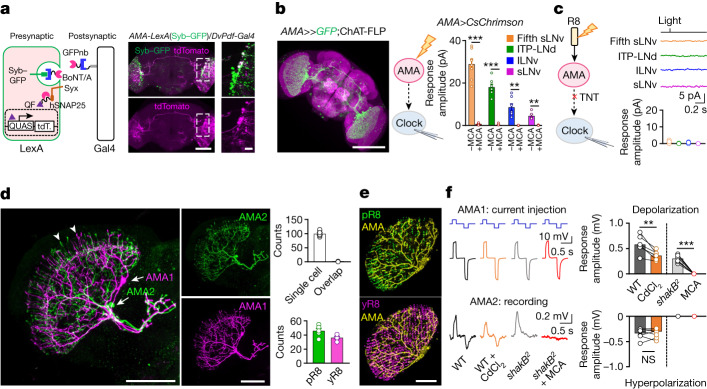
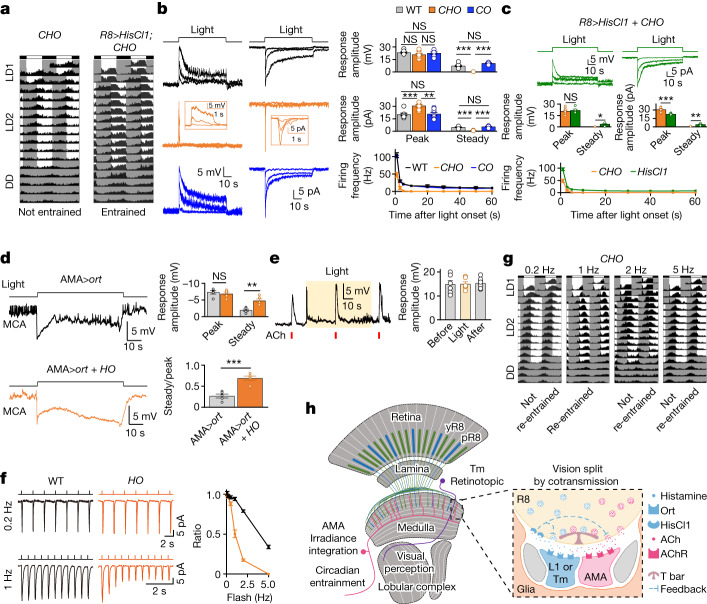
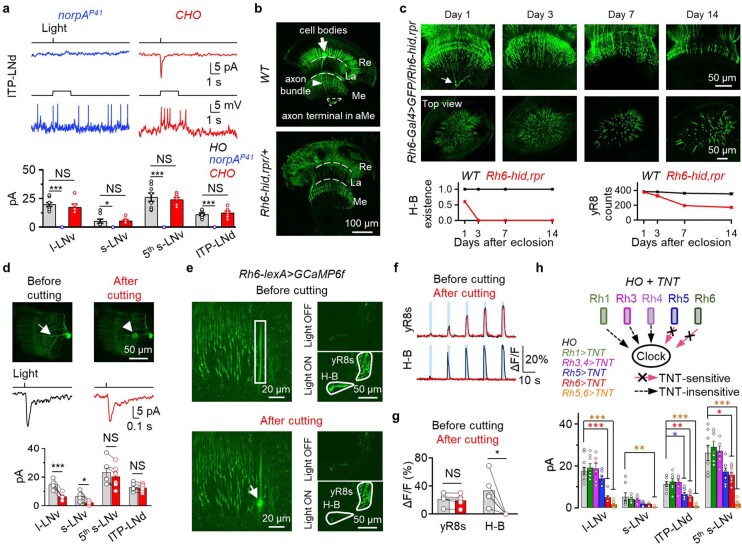
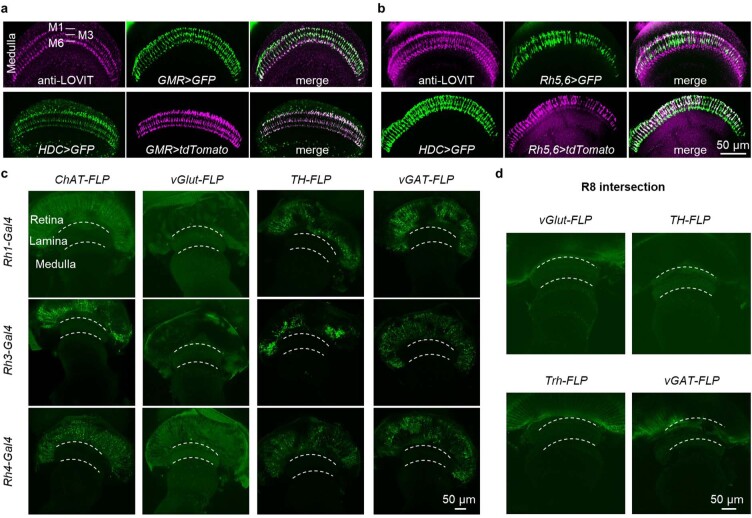
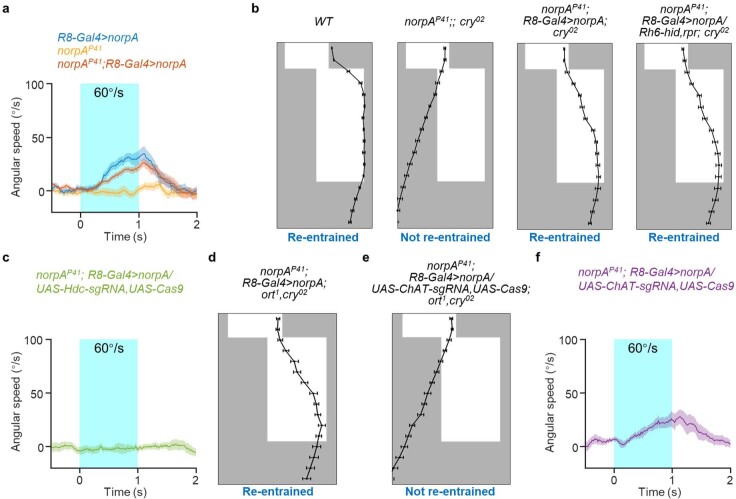
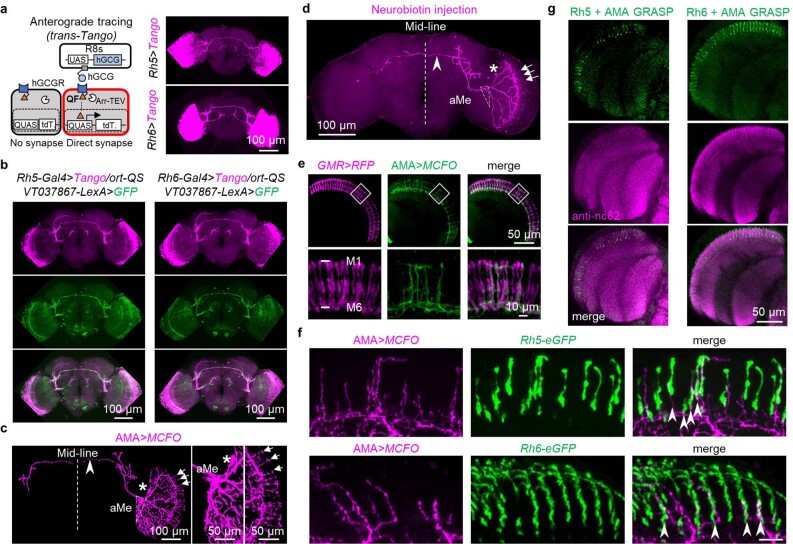
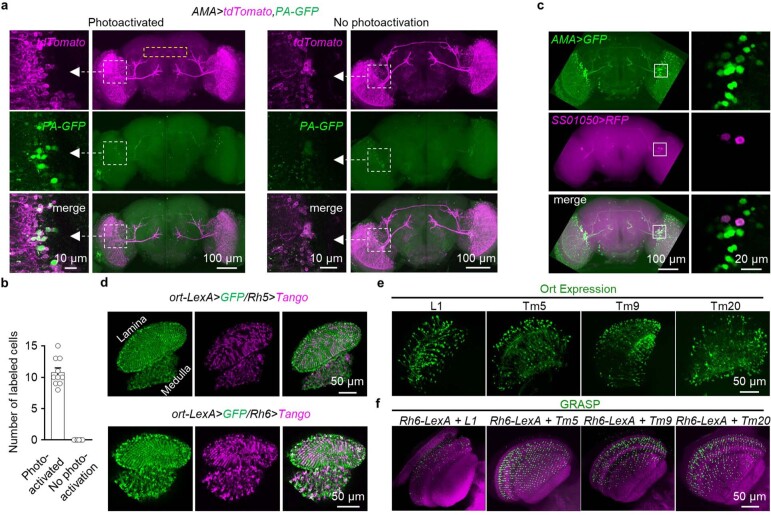
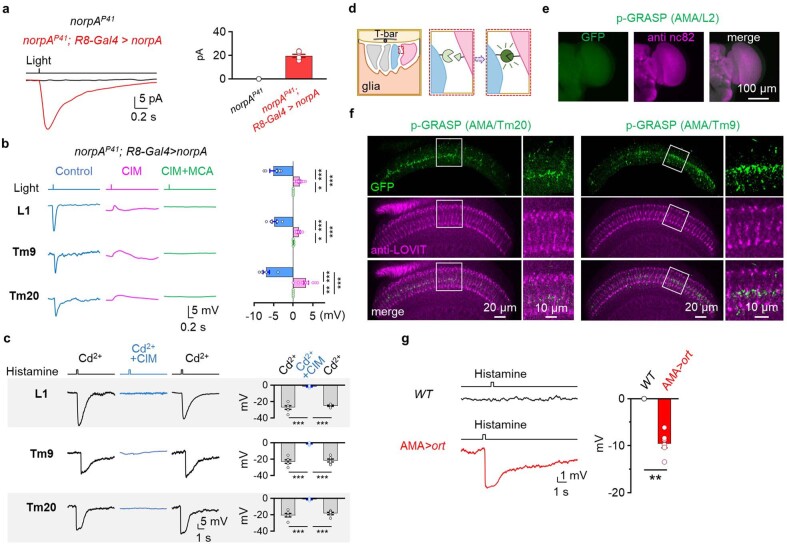
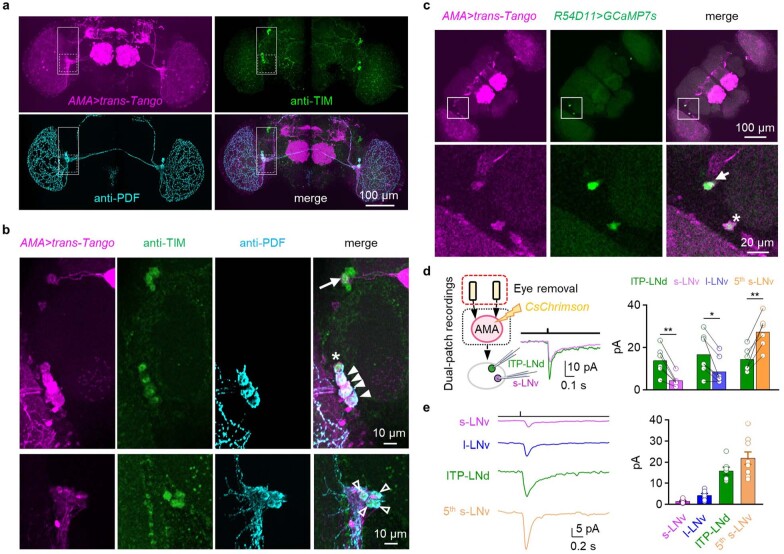
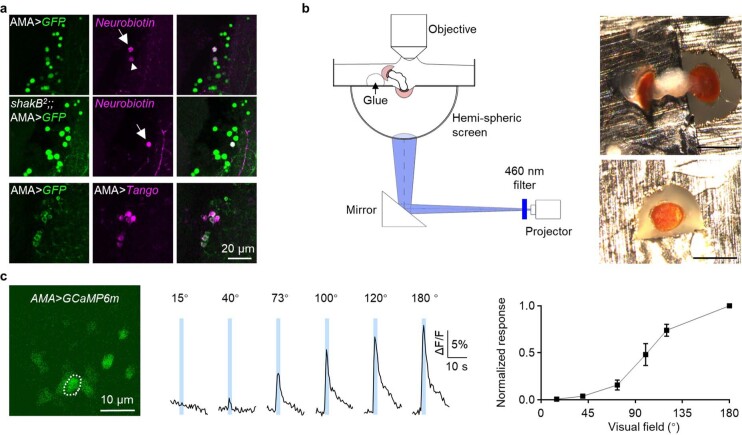
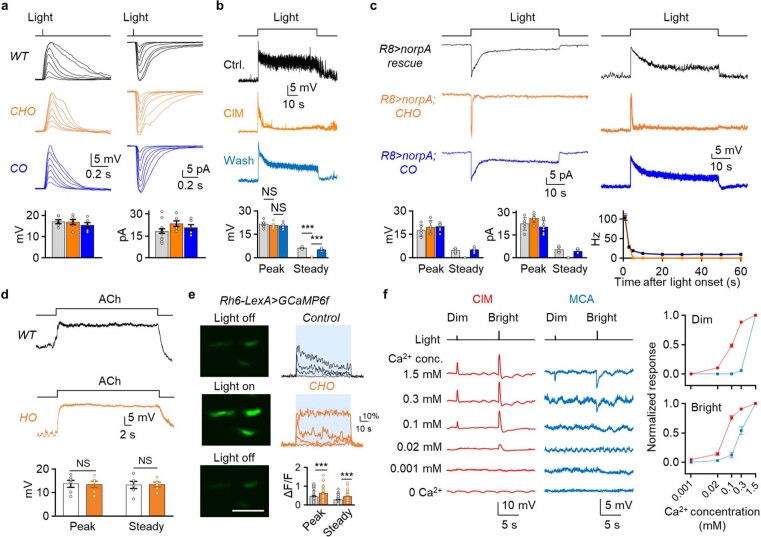
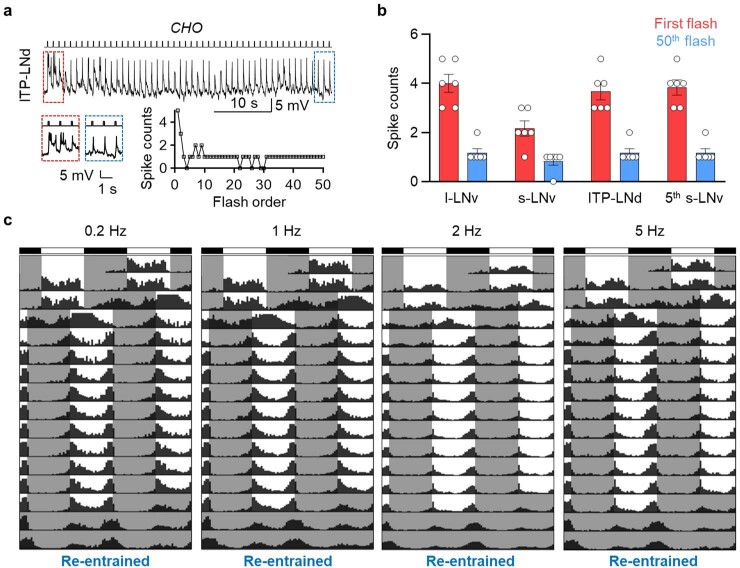
Vision enables both image-forming perception, driven by a contrast-based pathway, and unconscious non-image-forming circadian photoentrainment, driven by an irradiance-based pathway1,2. Although two distinct photoreceptor populations are specialized for each visual task3-6, image-forming photoreceptors can additionally contribute to photoentrainment of the circadian clock in different species7-15. However, it is unknown how the image-forming photoreceptor pathway can functionally implement the segregation of irradiance signals required for circadian photoentrainment from contrast signals required for image perception. Here we report that the Drosophila R8 photoreceptor separates image-forming and irradiance signals by co-transmitting two neurotransmitters, histamine and acetylcholine. This segregation is further established postsynaptically by histamine-receptor-expressing unicolumnar retinotopic neurons and acetylcholine-receptor-expressing multicolumnar integration neurons. The acetylcholine transmission from R8 photoreceptors is sustained by an autocrine negative feedback of the cotransmitted histamine during the light phase of light-dark cycles. At the behavioural level, elimination of histamine and acetylcholine transmission impairs R8-driven motion detection and circadian photoentrainment, respectively. Thus, a single type of photoreceptor can achieve the dichotomy of visual perception and circadian photoentrainment as early as the first visual synapses, revealing a simple yet robust mechanism to segregate and translate distinct sensory features into different animal behaviours.


Conflict of interest statement

The authors declare no competing interests.

Figures

Fig. 1
Fig. 1. Histamine-independent irradiance signals.
a, Left: schematic of patch-clamp recording from a clock neuron (ITP-LNd); right: representative current (top: voltage clamp) and voltage (bottom: current clamp) responses to light stimuli (470 nm, 2.51 × 107 photons μm−2 s−1, top: 2 ms, bottom: 500 ms). The timing of light stimulation is indicated at the top of the response traces. Genotypes are listed in Supplementary Table 1. b, Histamine-independent responses of clock neurons. Top: representative light responses (470 nm, 2 ms, intensities of 0.01, 0.04, 0.20, 0.41, 0.81, 1.93 and 2.80 × 107 photons μm−2 s−1). WT, wild type. Bottom: pooled saturated response amplitudes. c, Histamine-independent inputs require PLC signalling in compound eyes. Top: schematic of eye input manipulation; middle: representative responses of ITP-LNd in HO flies, norpAP41;;HO flies, HO flies with eyes removed, Rh6-hid,rpr;HO flies and HO flies with HB eyelet axons laser ablated; bottom: pooled saturated response amplitudes. Light: 470 nm, 2 ms, intensities of 0.01, 0.04, 0.20, 0.41, 0.81, 1.93 and 2.80 × 107 photons μm−2 s−1. d, Histamine-independent signals from R8 photoreceptors. Left: schematic of a compound eye with approximately 750 ommatidia, with each ommatidium containing 8 photoreceptors (R1–R8) that express different rhodopsins (Rh1, Rh3–Rh6); middle: histamine-independent responses in norpAP41;;HO mutant flies with norpA rescued in different photoreceptors (with HB eyelet axons laser ablated); right: histamine-independent responses in HO flies with mutations in different rhodopsins (with HB eyelet axons laser ablated). e, R8 photoreceptors do not use histamine to transmit irradiance signals. Top: schematic of photoreceptor signalling; bottom: pooled saturated response amplitudes of R8 photoreceptors of norpAP41 flies with norpA rescued in pR8 or yR8 photoreceptors (with or without HO mutants; with HB eyelet axons laser ablated). Light in d,e: 470 nm, 2 ms, 2.80 × 107 photons μm−2 s−1. Pooled data are shown as mean ± s.e.m. *P < 0.05; **P < 0.01; ***P < 0.001; NS, not significant. Statistical analysis is summarized in Supplementary Table 2.
Fig. 2
Fig. 2. R8 photoreceptors use histamine for motion detection and ACh for circadian photoentrainment.
a, R8 photoreceptors contain ACh. Left: schematic of genetic intersection; right: ChAT in R8 photoreceptors (Rh5-Gal4 + Rh6-Gal4). Scale bar, 100 μm. b, ACh in pR8 (Rh5-Gal4) and yR8 (Rh6-Gal4) photoreceptors. Scale bar, 100 μm. c, Single R8 photoreceptors express both VAChT and LOVIT. Scale bar, 50 μm. d, Single R8 photoreceptors express both ChAT and LOVIT. Scale bar, 50 μm. e, Motion detection by R8 photoreceptors. Left: schematic of behavioural motion detection; right: pooled angular speed in R8-Gal4 (Rh5-Gal4,Rh6-Gal4)>norpA (n = 12), norpAP41 (n = 18) and norpAP41;R8-Gal4>norpA (n = 13) flies. f, Circadian photoentrainment by R8 photoreceptors. Average actograms of norpAP41;;cry02 flies (left: n = 102), flies with only R8 photoreceptors and HB eyelets in dim-light detection (middle: n = 93) and flies with only R8 photoreceptors in dim-light detection (with HB eyelets ablated by Rh6-hid,rpr; right: n = 73). g,h, ort is indispensable for R8-mediated motion detection but not circadian photoentrainment. g, Motion detection in ort mutants (n = 13), ort mutants with functional R8 photoreceptors (n = 11) or mutants with Hdc-knockout in R8 photoreceptors (n = 11). h, Average actograms following genetic ablation of ort in norpAP41;;cry02 flies with norpA rescued in R8 photoreceptors (n = 91). i,j, ACh signalling is required for R8-mediated circadian photoentrainment but not motion detection. i, Average actograms following genetic ablation of both ort and ChAT in norpAP41;;cry02 flies with norpA rescued in R8 photoreceptors (n = 74). j, Pooled angular speed for motion detection by R8 photoreceptors after ChAT knockout in norpAP41 flies with norpA rescued in R8 photoreceptors (n = 12). e,g,j, visual moving bars: wave width of 30°, angular velocity of 180° s−1, contrast of 100%, duration of 1 s. Data are represented as mean (solid line) ± s.e.m. (shading). f,h,i, LD1: 200 lux (white light) together with 25 °C/18 °C temperature cycles; LD2: 0.05 lux (white light) at 25 °C; DD: 25 °C. Low-intensity light (0.05 lux) in LD2 cycles is used to examine NorpA-dependent re-entrainment.
Fig. 3
Fig. 3. ACh and histamine act on distinct neurons.
a, ort-independent postsynaptic neurons. Left: schematic of trans-Tango tracing with ort-QS excluding QF-driven tdTomato (tdT.) expression in ort-expressing neurons; right: ort-independent postsynaptic neurons of pR8 and yR8 photoreceptors. Open arrowheads mark multicolumnar arborization, arrows mark accessory medulla innervation, and filled arrowheads mark the arcuate commissure. Scale bar, 100 μm. b, VT037867-labelled neurons overlap with ort-independent postsynaptic neurons of pR8 (left) and yR8 (right) photoreceptors. Arrowheads mark co-labelled cells. Scale bar, 5 μm. c, Connections between R8 photoreceptors and AMA neurons. Left: schematic of GRASP labelling; right: GRASP between AMA neurons and pR8 (Rh5-Gal4), yR8 (Rh6-Gal4) or all (GMR-Gal4) photoreceptors. Scale bar, 50 μm. d, AMA neurons are excited by R8 photoreceptors. Top: schematic of photoreceptor manipulation: wild-type flies (left), Rh52;Rh61 flies (middle) and norpAP41 flies with norpA rescued in R8 photoreceptors (right). Middle: representative light-induced depolarization; insets represent spikes outlined by the dashed line. Bottom: representative light-induced inward current. Light: 470 nm, 5.56 × 107 photons μm−2 s−1, 200 ms (current clamp) and 2 ms (voltage clamp). e, Light-induced saturated responses in AMA neurons. cKO, conditional knockout. f, Light-induced hyperpolarization of ort-expressing postsynaptic neurons of R8 photoreceptors. Left: representative light-induced hyperpolarization of L1, Tm9 and Tm20 neurons. Right: pooled saturated response amplitudes. g, AMA and Tm9 or Tm20 neurons share the same polyadic R8 synapse. h, Histamine-mediated responses in ort-expressing AMA neurons. Left: schematic of R8 inputs. Right: representative biphasic light responses in normal saline (top left); depolarization in CIM, hyperpolarization in MCA and no response in CIM + MCA (right) and pooled data (bottom left). i, A model of postsynaptic segregation of cotransmission. Although histamine signalling dominates in transmission from R8 photoreceptors to L1 and Tm pathways, very minor ACh signalling also exists in this pathway (f). Light in df,h: 470 nm, 5.56 × 107 photons μm−2 s−1, duration of 2 ms (e,f) and 200 ms (d,h). Pooled data are shown as mean ± s.e.m. ***P < 0.001; NS, not significant. Statistical analysis is summarized in Supplementary Table 2.
Fig. 4
Fig. 4. A three-node circuit for circadian photoentrainment.
a, AMA neurons are presynaptic to clock neurons. Left: schematic of retrograde BAcTrace tracing; right: AMA neurons overlap with the BAcTrace-labelled presynaptic neurons of clock neurons. Scale bars, 20 µm. b, AMA neurons excite clock neurons through ACh signalling. Left: GFP expression intersected by ChAT-FLP and AMA-Gal4; scale bar, 100 µm. Middle: schematic of simultaneous optogenetic activation and patch-clamp recordings. Right: pooled responses of clock neurons to optogenetic activation of AMA neurons (with or without MCA). Light: 617 nm, 2 ms, 2.22 × 109 photons μm−2 s−1. c, R8 photoreceptors excite clock neurons through AMA neurons. Left: schematic of TNT blockade of AMA transmission; right: a complete loss of R8-mediated light responses in clock neurons of AMA-Gal4 > TNT flies (top) and pooled data (bottom). Light: 470 nm, 2 ms, 5.56 × 107 photons μm−2 s−1. d, Spatial irradiance integration by AMA neurons. Left: arborization of two MCFO-labelled AMA neurons; arrows indicate cell bodies and arrowheads indicate multicolumnar arborization. Middle: single MCFO-labelled AMA neurons. Top right: pooled counting data for dendritic branches of single AMA neurons and for dendritic branch overlaps between two AMA neurons. Scale bars, 50 µm. e, Co-labelling of pR8 or yR8 photoreceptors and AMA neurons. Pooled data counting the overlap between AMA dendritic branches and photoreceptor axons are shown on the bottom left. Scale bar, 50 µm. f, Electrical and chemical synapses among AMA neurons. Left: representative dual recordings (with current injection to AMA1) in wild-type flies (with or without 50 µM MCA) or shakB2 mutant flies (with or without 100 µM CdCl2); right: pooled peak response amplitudes of the AMA2 neuron. Hyperpolarization current: −30 pA; depolarization current: 30 pA. Pooled data are shown as mean ± s.e.m. **P < 0.01; ***P < 0.001; NS, not significant. Statistical analysis is summarized in Supplementary Table 2.
Fig. 5
Fig. 5. Histamine feedback sustains ACh cotransmission.
a, ACh-mediated circadian photoentrainment requires HisCl1. Average actogram of CHO flies (left: n = 61) and CHO flies with HisCl1 rescued in R8 photoreceptors (right: n = 71). b, Light step-induced AMA responses in wild-type (black), CHO (orange) and CO (blue) flies. Left: representative voltage responses (current clamp). Middle: representative current responses (voltage clamp). Right: pooled peak and steady voltage response amplitudes (top), current response amplitudes (middle) and firing rates (bottom). Light: 470 nm, 60 s, intensities of 0.0094, 0.19 and 1.88 × 106 photons μm−2 s−1. c, HisCl1 in R8 photoreceptors restored steady depolarization in CHO flies. Top: representative recordings in CHO flies with HisCl1 rescued in R8 photoreceptors; middle and bottom: pooled data. Light: 470 nm, 60 s, intensities of 0.0094, 0.19 and 1.88 × 106 photons μm−2 s−1. d, Negative histamine feedback to histamine release. Left: Histamine-mediated hyperpolarization in ort-expressing AMA neurons is increased in HO flies when ACh-mediated depolarization is blocked by MCA. Right: pooled steady and peak response amplitudes and their corresponding ratios. Light: 470 nm, 60 s, 1.88 × 106 photons μm−2 s−1. e, Normal ACh sensitivity in CHO flies. Left: representative ACh-induced depolarization before, during and after light stimulation; right: pooled data. Light: 470 nm, 60 s, 1.88 × 106 photons μm−2 s−1. f, Frequency dependence of light-pulse-induced responses in AMA neurons. Left: representative responses to light pulses of 0.2 Hz and 1 Hz; right: pooled peak response ratios between the first and fiftieth pulses. Light pulses: 470 nm, duration of 100 ms, 5.65 × 107 photons μm−2 s−1. g, Circadian photoentrainment of CHO flies to brief light pulses. Average actograms to 100-ms flashes at 0.2 Hz (n = 63), 1 Hz (n = 65), 2 Hz (n = 60) and 5 Hz (n = 54). h, A model of negative histaminergic feedback in R8 photoreceptors. Pooled data are shown as mean ± s.e.m. *P < 0.05; **P < 0.01; ***P < 0.001; NS, not significant. Statistical analysis is summarized in Supplementary Table 2.
Extended Data Fig. 1
Extended Data Fig. 1. R8-mediated irradiance signals.
a, PLC-dependent, but histamine- and cryptochrome-independent light responses. Top, Representative light-triggered currents of ITP-LNd in norpAP41 (left) and CHO (right) flies; middle, representative light-triggered depolarization; bottom, pooled data. Light: 470 nm, 5.65 × 10⁷ photons/μm2/s, 2 ms (top) and 2 s (middle). b, H-B eyelet ablation in Rh6-hid,rpr flies on day 3 after eclosion. c, Time-dependent H-B eyelet ablation by Rh6-hid,rpr. Top, H-B eyelet axons and yR8s on different days after eclosion; middle, top views of yR8 loss; bottom, probability of H-B eyelet existence (left), and pooled data of yR8 counts (right). Arrow: H-B eyelet axons. d, Histamine-independent light responses remained in the absence of H-B eyelets. Top, schematic of laser cutting H-B axons, middle, representative ITP-LNd responses; bottom, pooled data. Arrow: intact GFP-labeled H-B eyelet axons; arrowhead: a cavitation bubble associated with laser-ablation of H-B eyelet axons. Light stimulation: 470 nm, 2 ms, 5.65 × 10⁷ photons/μm2/s. e-g, Specificity and completeness of laser cutting H-B eyelet axons. e, Top, representative H-B eyelets and yR8s (left), and their calcium response to light stimulation (right); bottom, laser cutting of H-B eyelet axons (left), and representative light-triggered calcium responses. Light stimulation: 460 nm, 2 s, 1.18 × 10⁶ photons/μm2/s. White rectangle: axon bundle of H-B eyelets; arrow: a cavitation bubble associated with laser ablation. f, Representative calcium responses of yR8s (top) and H-B eyelets (bottom). Light stimulation: 460 nm, 2 s, intensities of 0.03, 0.30, 0.97, 1.18, and 2.36 × 10⁶ photons/μm2/s. Blue bars: timing of light stimulation. g, Pooled calcium responses of yR8s (n = 5 flies) and H-B eyelets (n = 5 flies). Light stimulation: 460 nm, 2 s, 1.18 × 10⁶ photons/μm2/s. h, Histamine-independent responses after photoreceptor silenced by TNT. Pooled data: mean ± s.e.m. *P < 0.05; **P < 0.01; ***P < 0.001; NS, not significant. Statistical analysis is summarized in Supplementary Table 2.
Extended Data Fig. 2
Extended Data Fig. 2. R8s contain histamine.
a, Histamine in compound eyes. Top, anti-LOVIT staining in the medulla; bottom, GFP expression by Hdc-Gal4 in the medulla. R8s terminate in the medullar layers of M1-M3, and R7s in M1-M6. GMR-LexA labeled all eye photoreceptors. b, R8s contain histamine. Top, anti-LOVIT staining; bottom, HDC expression. c, No ACh, glutamate, dopamine, and GABA in R1-R7 photoreceptors. d, No glutamate, dopamine, serotonin, and GABA in R8s.
Extended Data Fig. 3
Extended Data Fig. 3. R8s use histamine for motion detection and ACh for circadian photoentrainment.
a, Motion detection by R8s to slow (60°/s) visual stimuli. Pooled angular speed in norpAP41 (n = 10), R8-Gal4 (Rh5-Gal4,Rh6-Gal4)>norpA (n = 12), and norpAP41; R8-Gal4>norpA (n = 11) flies. Data are represented as mean (solid line) and s.e.m. (shading). b, Circadian photoentrainment by R8s. Phase plots of evening peaks of wild-type flies (left, n = 33), norpAP41;; cry02 mutant flies (second panel from left, n = 102), the flies with only R8s and H-B eyelets in dim-light detection (third panel from left, n = 93), and the flies with only R8s in dim-light detection (with H-B eyelets genetically ablated by Rh6-hid,rpr) (right, n = 73). c, Motion detection by R8s depends on histamine. Pooled angular speed of flies with Hdc-knockout in R8s (n = 11). d and e, Phase plots of evening peaks following genetic loss of ort (d, n = 91), or loss of both ort and ChAT (e, n = 74) in norpAP41;; cry02 flies with norpA rescued in R8s. f, R8-mediated motion detection does not depend on ACh from R8s. Pooled angular speed for R8-mediated motion detection after ChAT knockout in norpAP41 flies with norpA rescued in R8s (n = 9). Visual moving bars in a, c, and f: wave width of 30°, angular velocity of 60°/s, contrast of 100%, duration of 1 s. Pooled data: mean ± s.e.m.
Extended Data Fig. 4
Extended Data Fig. 4. Morphological features of AMA neurons.
a, Postsynaptic candidates of R8s. Left, schematic of trans-Tango labeling; right, postsynaptic neurons of pR8s (Rh5-Gal4) and yR8s (Rh6-Gal4). b, VT037867-labled neurons overlap with R8s’ postsynaptic neurons that do not express ort. c, Single MCFO-labeled AMA neuron innervates the aMe, arborizes in multiple medullar visual columns, and exhibits an arcuate dorsal commissure. Left, an overview of the entire brain; middle, an expanded view of the aMe region; right, an expanded view of columnar arborization. Asterisk: cell body; dashed triangle: aMe; arrows: arborization in medulla columns; arrowhead: arcuate dorsal commissure. d, Single-cell morphology of the recorded AMA neurons. Single-cell morphology of a recorded AMA neuron, revealed by neurobiotin injection via the recording pipette after whole-cell recordings. Asterisk: cell body; dashed triangle: aMe; arrows: multicolumnar arborization; arrowhead: arcuate dorsal commissure. e, Multicolumnar arborization of AMA neurons. Top, RFP-labeled photoreceptors and a MCFO-labeled AMA neuron; bottom, an expanded view of the dashed boxes in top panels. f, Color inputs to AMA neurons. AMA neurons innervate pR8 columns (Rh5-eGFP, top), and yR8 columns (Rh6-eGFP, bottom). Arrowheads: overlap between an AMA neuron and R8s. Scale bar: 10 µm. g, Synapses between R8s and AMA neurons. Single-section image of GRASP signals between AMA neurons and pR8s (left) and yR8s (right).
Extended Data Fig. 5
Extended Data Fig. 5. Postsynaptic neurons of R8s.
a, PA-GFP labeling of AMA neurons postsynaptic to R8s. Left, tdTomato is used to identify the dorsal commissure (yellow dashed box) in VT037867-Gal4,UAS-tdTomato,UAS-PA-GFP flies for photoactivation (top), PA-GFP-labeled cell bodies and commissure of AMA neurons (middle), merged image (bottom); right, negative control of PA-GFP labeling: tdTomato-labeled dorsal commissure track in VT037867-Gal4,UAS-tdTomato,UAS-PA-GFP flies (top), no PA-GFP-labeling without photoactivation (middle), merged image (bottom). b, pooled total number of PA-GFP-labeled AMA neurons. Pooled data: mean ± s.e.m. c, aMe 12 belong to AMA neurons. Left, Co-labeling of aMe 12 (SS01050 > RFP) and AMA neurons (VT037867-LexA > GFP); right, an expanded view of the dashed boxes. d, Ort-expressing neurons postsynaptic to R8s. Overlap of anterograde tdTomato labeling with trans-Tango and ort-LexA > GFP revealed ort-expressing postsynaptic neurons downstream of pR8s (top) and yR8s (bottom). e, Histamine-responsive neurons postsynaptic to R8s. GFP expression is intersected by ort-LexA > FLP and L1, Tm5, Tm9, or Tm20-spGal4. f, GRASP between R8s and L1, Tm5, Tm9, and Tm20.
Extended Data Fig. 6
Extended Data Fig. 6. Electrical and anatomic features of postsynaptic neurons of R8s.
a, R8-mediated light responses in AMA neurons. Left, Representative response of AMA neurons in norpAP41 flies and norpAP41 flies with norpA-rescued in R8s; right, pooled data. Light stimulation: 470 nm, 2 ms, 5.56 × 10⁷ photons/μm2/s. b, Histamine hyperpolarizes L1, Tm9 and Tm20 neurons. Left, representative hyperpolarization (first column), which is blocked by 2 mM CIM (second column) and recovered after wash out (third column) in the presence of Cd2+. Right, pooled data. Histamine: 1 mM, duration of 200 ms. c, R8-driven light responses in L1, Tm9, and Tm20 neurons require histamine. Left, representative light responses; right, pooled data. Light: 470 nm, 2 ms, 5.65 × 10⁷ photons/μm2/s. Note a tiny light-triggered depolarization in the absence of histamine signaling. d, Schematic of p-GRASP labeling. Two complementary split-GFP segments fused to ICAM5 are expressed in postsynaptic sites of two different neurons. GFP signals appear when these two neurons share the same presynaptic site. e, Negative control of p-GRASP. No p-GRASP signal between AMA neurons (VT037867-LexA) and L2 neurons (SS00690-spGal4), consistent with the no sharing of presynaptic site from the hemibrain connectome data. f, AMA neurons share the same polyadic R8 synapse with Tm20/Tm9. Left, p-GRASP between AMA neurons (VT037867-LexA) and Tm9 neurons (SS00307-spGal4) (top), anti-LOVIT labels R8 axons in the medulla (middle), and overlap image (bottom); right, an expanded view of the white boxes in left panels. g, Ectopic expression of ort in AMA neurons. Left, representative histamine-induced responses in AMA neurons of wild-type flies (top) and transgenic flies with ort expressed ectopically in AMA neurons; right, pooled data of peak response amplitudes (n = 6). Histamine: 1 mM, duration of 250 ms. Pooled data are mean ± s.e.m. *P < 0.05; **P < 0.01; ***P < 0.001. Statistical analysis is summarized in Supplementary Table 2.
Extended Data Fig. 7
Extended Data Fig. 7. Clock neurons are postsynaptic to AMA neurons.
a, Clock neurons overlap with postsynaptic neurons of AMA neurons. Double-labeling clock neurons (with anti-TIM and anti-PDF) shows overlap with tdTomato-labeled postsynaptic neurons of AMA neurons (VT037867-Gal4>trans-Tango). b, An expanded view of the white rectangles (top) and the dashed boxes (bottom) in a. Arrow: LNds; asterisk: 5th s-LNv; arrowhead: l-LNv; unfilled arrowhead: s-LNv. c, Evening clock neurons are postsynaptic to AMA neurons. Top, Co-labeling ITP-LNd and 5th s-LNv (R54D11-LexA > GCaMP7s) and postsynaptic neurons of AMA neurons (VT037867-Gal4>trans-Tango); bottom, an expanded view of the white boxes in top panels. Arrow: LNds; asterisk: 5th s-LNv. d, Varied synaptic strengths between AMA neurons and clock neurons. Left, schematic of dual-patch recordings; middle, representative responses of a pair of ITP-LNd and s-LNv to optogenetic activation of AMA neurons; right, pooled peak responses (lines represent pairs of neurons simultaneously recorded with dual patch-clamp recordings). Light: 617 nm, 2 ms, 2.22 × 10⁹ photons/μm2/s. e, R8s differentially excite different clock neurons. Left, representative R8-driven light responses of different clock neurons; right, pooled peak response amplitudes (mean ± s.e.m.). Light: 470 nm, 2 ms, 5.65 × 10⁷ photons/μm2/s. Pooled data are mean ± s.e.m. *P < 0.05; **P < 0.01. Statistical analysis is summarized in Supplementary Table 2.
Extended Data Fig. 8
Extended Data Fig. 8. Mutual synapse and receptive field of AMA neurons.
a, Mutual electrical/chemical synapses between AMA neurons. Top, neurobiotin injection to an AMA neuron labels another AMA neuron; middle, loss of neurobiotin coupling in AMA neurons of shakB2 flies; bottom, AMA neurons are their own postsynaptic neurons labeled by trans-Tango. Arrows: neurobiotin-injected cell; arrowhead: neurobiotin-coupled cells. b, Mapping receptive field of AMA neurons. Left, Schematic of preparations for mapping receptive field. The recording chamber was made of a thin sheet of stainless steel (20 μm thick), with a hole slightly larger than a compound eye. Fly brains with intact eyes were dissected, and one compound eye was exposed to the air of the bottom of the chamber. The other compound eye was stabilized in the chamber with glue. A hemispherical screen (diameter of 40 mm) was placed under the chamber, with the exposed compound eye facing the center of the screen. Light spots were projected to the screen from a back projector via a reflecting mirror. Light simulation of 460 nm was used to avoid interference with the fluorescence-imaging detector. Calcium responses reported by GCaMP6m were acquired with a two-photon microscopy and fluorescence excitation by a two-photon laser of 920 nm. Right, a representative top view of the brain preparation (top) and bottom view of the exposed compound eye (bottom). Scale bar: 500 µm. c, Large receptive field of AMA neurons. Left, representative calcium imaging of AMA neurons; middle, representative response traces of AMA neurons to visual stimuli; right, pooled normalized peak responses against spot size. Light stimulation: 460 nm, 2.5 s, 2.36 × 10⁶ photons/μm2/s, spot size: 15°, 40°, 73°, 100°, 120°, and 180°. Blue bars show the timing of light stimulation. Pooled data are mean ± s.e.m. Statistical analysis is summarized in Supplementary Table 2.
Extended Data Fig. 9
Extended Data Fig. 9. ACh release sustained by histamine feedback in R8s.
a, Intact light-pulse-triggered responses in AMA neurons of CHO flies. Top, representative voltage responses (left) and representative current responses (right). Light stimulation: 470 nm, 2 ms, intensities of 0.51, 0.94, 1.51, 1.88, 2.82, 4.52, and 6.59 × 10⁷ photons/μm2/s. Bottom, pooled data to light of 470 nm, 2 ms, and 5.65 × 10⁷ photons/μm2/s. b, CIM reduced steady depolarization of AMA neurons. Top, representative recordings in normal saline, CIM, and after washout of CIM; bottom, pooled peak amplitudes (left) and steady response amplitudes (right). Light: 470 nm, 60 s, 1.88×10⁶ photons/μm2/s. c, Top, representative light step-triggered steady currents (left), depolarization and spike firing (right); bottom, pooled peak and steady membrane depolarization (left), inward currents (middle), and firing rates (right). Light stimuli: 470 nm, 60 s, 1.88×10⁶ photons/μm2/s. d, Normal AChR functions in AMA neurons of HO flies. Representative response to 1 mM ACh in wild-type (top) and HO flies (middle), and pooled data (bottom). Note, there is a hyperpolarization after washing out ACh (top). e, Enhanced light-triggered calcium influx in R8 axon terminals of CHO flies. Left, representative calcium responses; right, representative calcium response families of yR8 axons in wild-type (top) and CHO flies (middle), and pooled peak and steady response amplitudes (bottom). Light: 470 nm, 60 s, intensities of 0.33, 1.81, 4.22, and 9.64 × 10⁵ photons/μm2/s. Blue bars indicate timing of light stimulation. Scale bar: 10 µm. Pooled data are mean ± s.e.m. ***P < 0.001. f, Distinct calcium sensitivity of histamine and ACh release. Left, representative flash-triggered responses of ort-expressing AMA neurons in the presence of CIM (left) or MCA (right) at different calcium concentrations; right, pooled data. Light stimulation: 470 nm, 2 ms, 9.41 × 10⁶ photons/μm2/s (dim) and 6.78 × 10⁷ photons/μm2/s (bright). Pooled data are mean ± s.e.m. **P < 0.01; ***P < 0.001. Statistical analysis is summarized in Supplementary Table 2.
Extended Data Fig. 10
Extended Data Fig. 10. Flash frequency-dependent photoentrainment.
a, Top, representative response to 1 Hz flashes of ITP-LNd in CHO flies; bottom, an expanded view of the first three (red box) and last three (blue box) responses (left), and spike counts (right). b, Pooled data of the first and the 50th flash-induced spikes in different clock neurons of CHO flies. Light: 470 nm, 100 ms, 4.71 × 10⁷ photons/μm2/s. Pooled data are mean ± s.e.m. c, Average actograms to light flashes (duration of 100 ms) of wild-type flies at 0.2 Hz (n = 15), 1 Hz (n = 20), 2 (n = 23), and 5 Hz (n = 21). LD1: 200 lux (white light) together with 25 °C/18 °C temperature cycles; LD2: 0.5 lux (white light) at 25 °C; DD: 25 °C. Statistical analysis is summarized in Supplementary Table 2.

References

    1. Lazzerini Ospri L, Prusky G, Hattar S. Mood, the circadian system, and melanopsin retinal ganglion cells. Annu. Rev. Neurosci. 2017;40:539–556. doi: 10.1146/annurev-neuro-072116-031324. - DOI - PMC - PubMed
    1. Do MTH. Melanopsin and the intrinsically photosensitive retinal ganglion cells: biophysics to behavior. Neuron. 2019;104:205–226. doi: 10.1016/j.neuron.2019.07.016. - DOI - PMC - PubMed
    1. Berson DM, Dunn FA, Takao M. Phototransduction by retinal ganglion cells that set the circadian clock. Science. 2002;295:1070–1073. doi: 10.1126/science.1067262. - DOI - PubMed
    1. Hattar S, Liao HW, Takao M, Berson DM, Yau KW. Melanopsin-containing retinal ganglion cells: architecture, projections, and intrinsic photosensitivity. Science. 2002;295:1065–1070. doi: 10.1126/science.1069609. - DOI - PMC - PubMed
    1. Emery P, So WV, Kaneko M, Hall JC, Rosbash M. CRY, a Drosophila clock and light-regulated cryptochrome, is a major contributor to circadian rhythm resetting and photosensitivity. Cell. 1998;95:669–679. doi: 10.1016/S0092-8674(00)81637-2. - DOI - PubMed

MeSH terms

LinkOut - more resources