. 2023 Oct;622(7984):712-717.
doi: 10.1038/s41586-023-06601-8. Epub 2023 Oct 25.

Geophysical evidence for an enriched molten silicate layer above Mars's core

Affiliations

Geophysical evidence for an enriched molten silicate layer above Mars's core

Henri Samuel et al. Nature. 2023 Oct.

Erratum in

Abstract

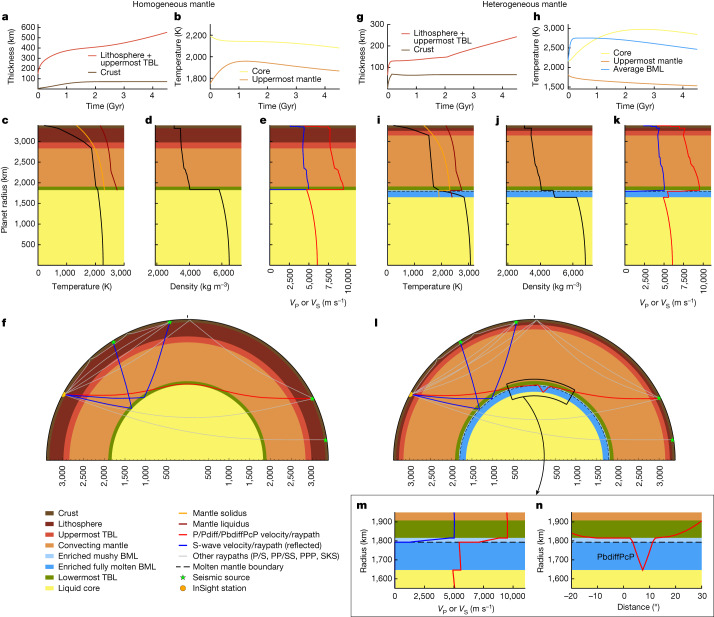
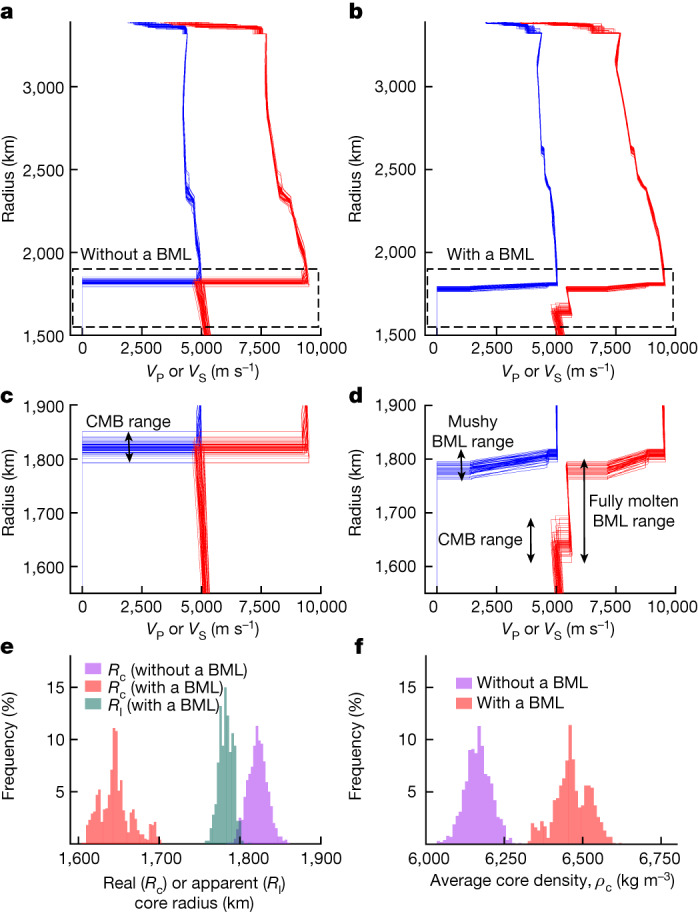
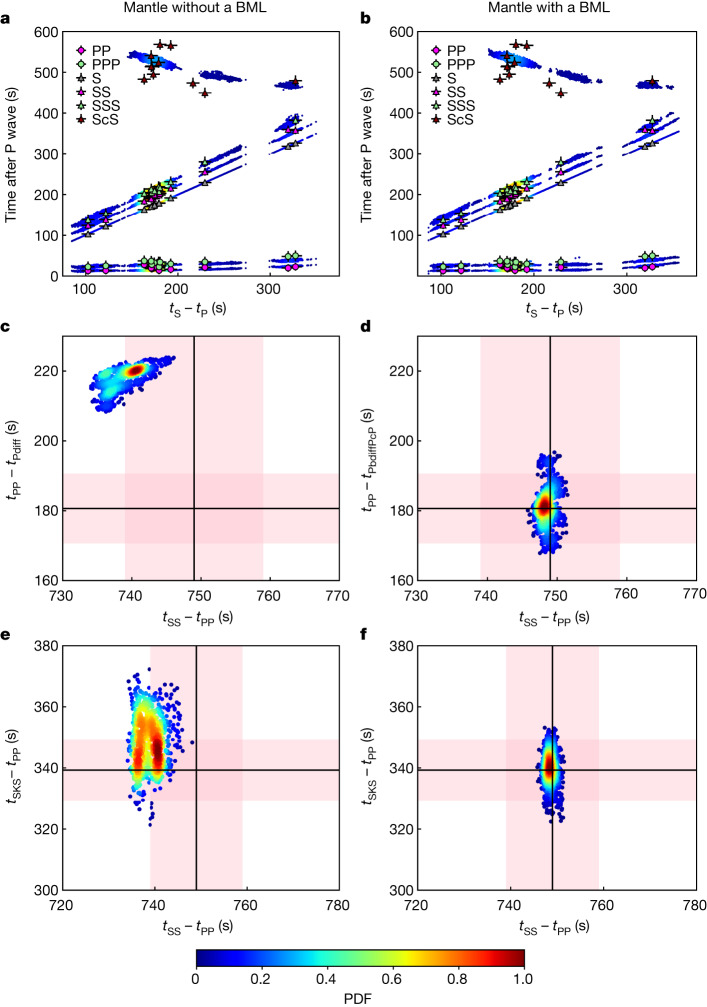
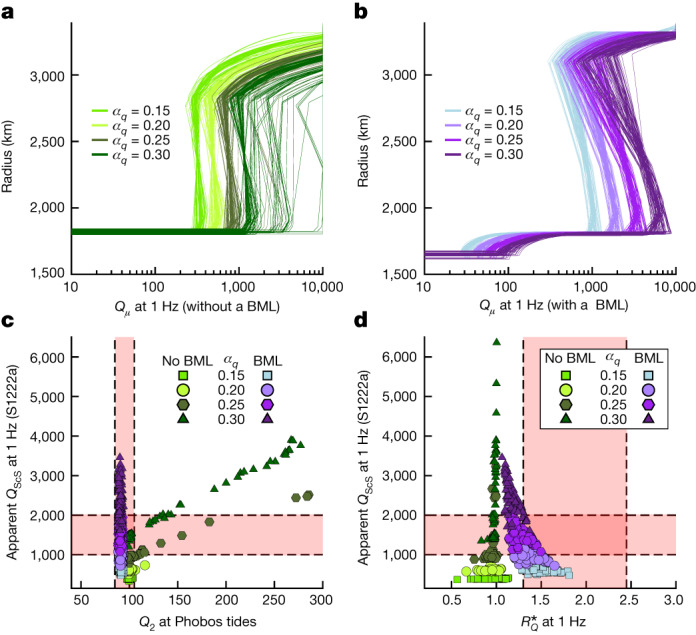
The detection of deep reflected S waves on Mars inferred a core size of 1,830 ± 40 km (ref. 1), requiring light-element contents that are incompatible with experimental petrological constraints. This estimate assumes a compositionally homogeneous Martian mantle, at odds with recent measurements of anomalously slow propagating P waves diffracted along the core-mantle boundary2. An alternative hypothesis is that Mars's mantle is heterogeneous as a consequence of an early magma ocean that solidified to form a basal layer enriched in iron and heat-producing elements. Such enrichment results in the formation of a molten silicate layer above the core, overlain by a partially molten layer3. Here we show that this structure is compatible with all geophysical data, notably (1) deep reflected and diffracted mantle seismic phases, (2) weak shear attenuation at seismic frequency and (3) Mars's dissipative nature at Phobos tides. The core size in this scenario is 1,650 ± 20 km, implying a density of 6.5 g cm-3, 5-8% larger than previous seismic estimates, and can be explained by fewer, and less abundant, alloying light elements than previously required, in amounts compatible with experimental and cosmochemical constraints. Finally, the layered mantle structure requires external sources to generate the magnetic signatures recorded in Mars's crust.


Conflict of interest statement

The authors declare no competing interests.

Figures

Fig. 1
Fig. 1. Inversion results.
Thermochemical evolution and present-day structure of Mars. One model among the best 50 is displayed for each inversion set. af, Without a BML (homogeneous mantle), with η0 = 6 × 1021 Pa s, E* = 300 kJ mol−1, V* = 3.8 cm3 mol−1. gl, With a BML (heterogeneous mantle), with η0 = 5 × 1020 Pa s, E* = 110 kJ mol−1, V* = 4.4 cm3 mol−1. a,g, Evolution of crustal and lithospheric thicknesses (including the uppermost mantle thermal boundary layer (TBL)). b,h, Evolution of uppermost convective mantle (Tm) and core (Tc) temperatures. c,i, Present-day temperature profiles and mantle melting curves from ref. accounting for the influence of iron in the BML. d,j, Density profiles. e,k, Shear and compressional wave speed profiles. f,l, Raypaths for waves reflected at (blue) or diffracted along (red) deep mantle interfaces. Additional raypaths for other phases considered for the inversion are shown in grey. m,n, Close-up views of the region delineated in the vicinity of the BML in l, showing the P- and S-wave velocity structure (m) and raypath (n) of the P-diffracted wave reflected at the CMB (PbdiffPcP). In the homogeneous mantle, S-wave reflection occurs at the CMB, while in the heterogeneous mantle, it occurs above the CMB where velocity decreases abruptly due to the transition from a partially molten to a fully/essentially molten state in the BML (dotted curves). In the heterogeneous mantle, the P-diffracted phase (PbdiffPcP) travels in a molten silicate mantle with slower wave speeds compared with those in a solid mantle, significantly delaying its travel time. The PbdiffPcP phase results from multiple rays diffracted at the top of the fully molten BML before and/or after core reflection, which contribute to this seismic phase. The path displayed corresponds to one of these contributions, which is the reason why it is not symmetric. However, because the seismic model is spherically symmetric, the sum of the contributions will result in a symmetric path (Supplementary Fig. 4). Source data
Fig. 2
Fig. 2. Inversion results of Mars’s seismic data with or without a BML.
a, Seismic profiles for P-wave (red) and S-wave (blue) velocities for 50 models chosen among the best 1,000 models without a BML. b, Same as a but for a mantle that contains a BML. c,d, Zoom-in of the areas delineated by the dashed rectangles in a and b, respectively. The maximum or minimum depth ranges of three distinct seismic regions and interfaces are marked by vertical arrows: the CMB range, the range for the interface between the mushy layer and the fully molten BML, and the fully/essentially molten BML region. e, Histograms for real and apparent core radii for the best 1,000 models. The core radius is considerably smaller when a BML is present but the apparent core radii (that is, the radius of liquid iron alloy plus the thickness of the fully molten silicate layer) are similar in both cases. f, Histograms of Mars’s core density for the best 1,000 models. The smaller core size in the heterogeneous-mantle case leads to a denser core compared with the homogeneous-mantle case. Panels ad contain a smaller number of models compared with e and f to allow for a clear visualization of the seismic structures. Source data
Fig. 3
Fig. 3. Datafit for the differential travel times, considering a mantle without and with a BML for the best 1,000 models.
The results are displayed in terms of probability density functions (PDFs). Blue and red colours show small and large probabilities, respectively. a,b, Body wave differential times with respect to P waves as a function of tS − tP. Markers and error bars represent observed differential arrival times and their uncertainty, respectively. cf, tPP − tPdiff (c), tPP − tPbdiffPcP (d) and tSKS − tPP (e,f) as a function of tSS − tPP for event S1000a. The observed differential travel time measurements are displayed with black lines. The pink bands indicate uncertainties on the measurements. Panels a,c,e correspond to the inversion set without a BML, and b,d,f to the inversion set with a BML. Source data
Fig. 4
Fig. 4. Attenuation at seismic and Phobos’s tide periods deduced from the 100 best models.
a,b, Present-day shear attenuation profiles at 1 Hz for the inversion set without a BML (a) and with a BML (b) for various frequency dependence (αq) of the shear quality factor. c, Apparent shear quality factor for the S-reflected wave, QScS, at 1 Hz and for event S1222a as a function of the global quality factor at Phobos tidal frequency (5 h 55 min). QScS was computed by integrating 1/Qμ for each model along the ScS raypath, determined using the TauP toolkit. Models without BML are displayed in green tones and models with a BML are as shown in purple tones depending on the value of αq. The acceptable ranges for QScS and Qμ are displayed in pink. d, QScS at 1 Hz and for event S1222a as a function of RQ*, the ratio of reflected S to direct S amplitudes AScS/AS between events S0185a and S1222a at 1 Hz that samples different solid mantle depths. The colour and symbol coding are identical to that in c. Source data

References

    1. Stähler SC, et al. Seismic detection of the martian core. Science. 2021;373:443–448. doi: 10.1126/science.abi7730. - DOI - PubMed
    1. Posiolova LV, et al. Largest recent impact craters on Mars: orbital imaging and surface seismic co-investigation. Science. 2022;378:412–417. doi: 10.1126/science.abq7704. - DOI - PubMed
    1. Samuel H, et al. The thermo-chemical evolution of Mars with a strongly stratified mantle. J. Geophys. Res.-Planet. 2021;126:e2020JE006613. doi: 10.1029/2020JE006613. - DOI
    1. Stevenson, D.J. in Origin of the Earth (eds Newsom H. E. & Jones J. H.) 231–249 (Oxford Univ. Press, 1990).
    1. Solomatov, V.S. in Treatise on Geophysics (ed. Schubert G.) 81–104 (Elsevier, 2015).