. 2023 Dec;17(12):2326-2339.
doi: 10.1038/s41396-023-01542-6. Epub 2023 Oct 25.

Diverse electron carriers drive syntrophic interactions in an enriched anaerobic acetate-oxidizing consortium

Affiliations

Diverse electron carriers drive syntrophic interactions in an enriched anaerobic acetate-oxidizing consortium

Elizabeth A McDaniel et al. ISME J. 2023 Dec.

Abstract

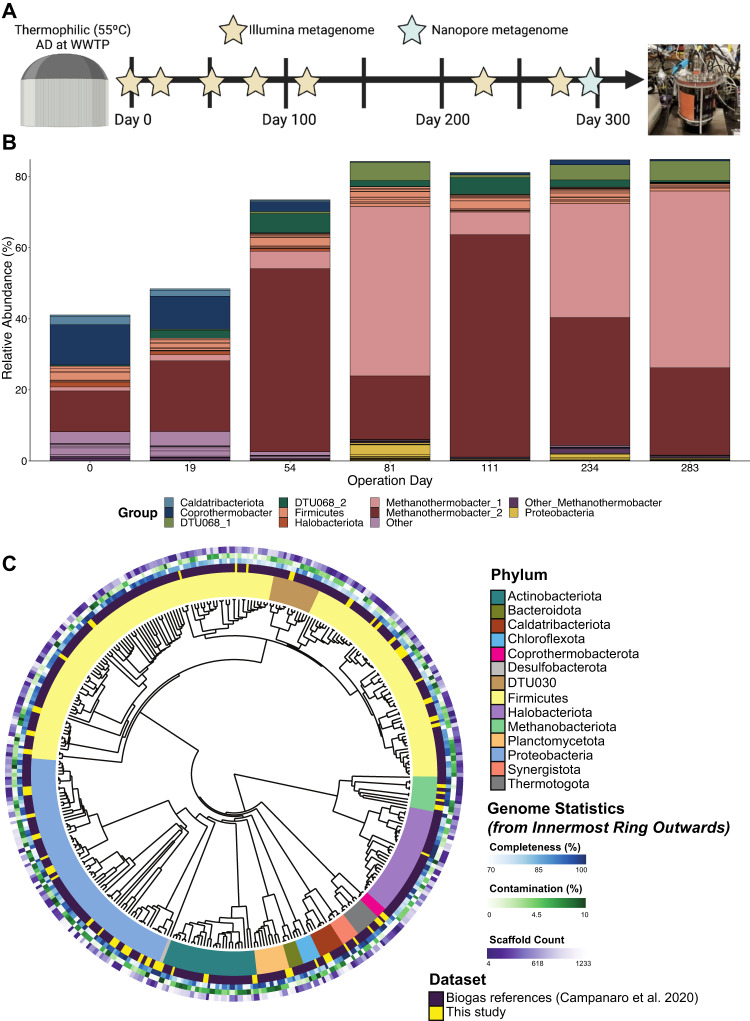
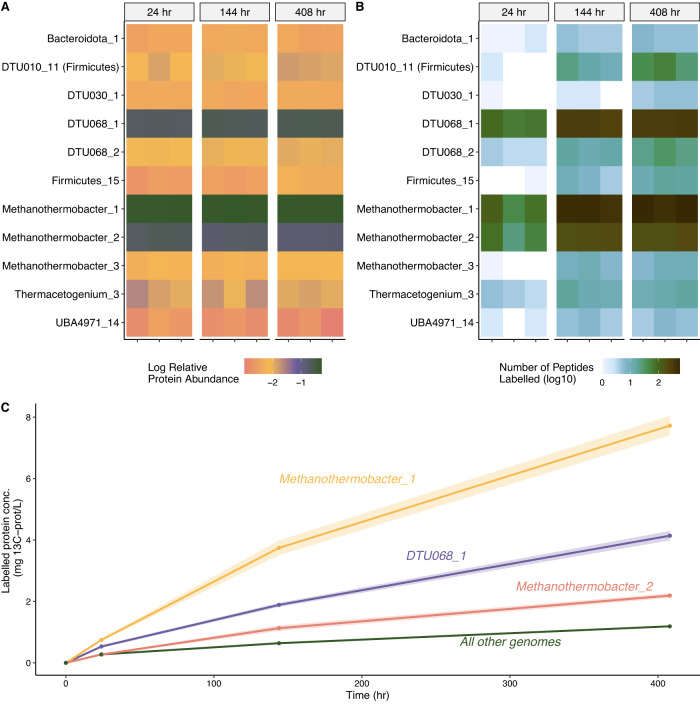
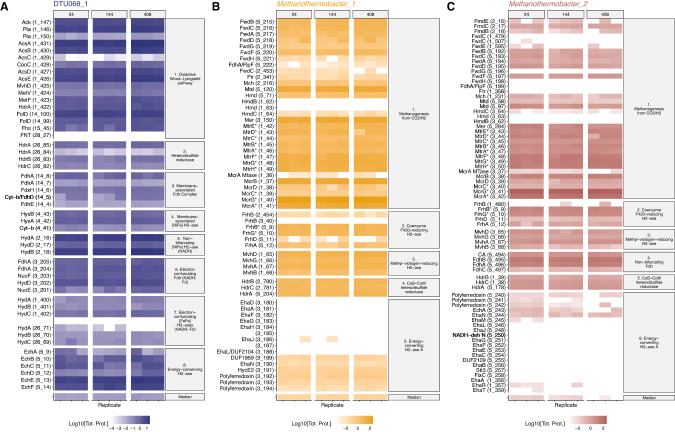
In many anoxic environments, syntrophic acetate oxidation (SAO) is a key pathway mediating the conversion of acetate into methane through obligate cross-feeding interactions between SAO bacteria (SAOB) and methanogenic archaea. The SAO pathway is particularly important in engineered environments such as anaerobic digestion (AD) systems operating at thermophilic temperatures and/or with high ammonia. Despite the widespread importance of SAOB to the stability of the AD process, little is known about their in situ physiologies due to typically low biomass yields and resistance to isolation. Here, we performed a long-term (300-day) continuous enrichment of a thermophilic (55 °C) SAO community from a municipal AD system using acetate as the sole carbon source. Over 80% of the enriched bioreactor metagenome belonged to a three-member consortium, including an acetate-oxidizing bacterium affiliated with DTU068 encoding for carbon dioxide, hydrogen, and formate production, along with two methanogenic archaea affiliated with Methanothermobacter_A. Stable isotope probing was coupled with metaproteogenomics to quantify carbon flux into each community member during acetate conversion and inform metabolic reconstruction and genome-scale modeling. This effort revealed that the two Methanothermobacter_A species differed in their preferred electron donors, with one possessing the ability to grow on formate and the other only consuming hydrogen. A thermodynamic analysis suggested that the presence of the formate-consuming methanogen broadened the environmental conditions where ATP production from SAO was favorable. Collectively, these results highlight how flexibility in electron partitioning during SAO likely governs community structure and fitness through thermodynamic-driven mutualism, shedding valuable insights into the metabolic underpinnings of this key functional group within methanogenic ecosystems.


Conflict of interest statement

With the exception of SJH, the authors declare no competing interests associated with this work. SJH is a co-founder of Koonkie Inc., a bioinformatics consulting company that designs and provides scalable algorithmic and data analytics solutions in the cloud. Koonkie Inc. was not involved in any aspect of this research.

Figures

Fig. 1
Fig. 1. Enrichment of an anaerobic acetate-oxidizing consortium.
A Conceptual schematic of 300-day chemostat enrichment period of the acetate oxidizing consortium showing the dates that short-read metagenomes were sequenced with Illumina and the long-read metagenome sequenced with Nanopore; B The relative read abundance in the short-read metagenomes of the recovered set of de-replicated MAGs within bioreactor R2, which was the bioreactor sampled for the stable isotope probing experiment. The relative read abundance is the number of reads mapped to a given genomic entity divided by the total reads in the sample. Each color in the plot represents a different genomic entity (e.g., a MAG or group of MAGs). C Phylogenetic tree of the recovered MAGs and a subset of biogas genome references from Campanaro et al. [69]. Moving from inside to outside in the colored rings: the first (inner) ring shows a phylum level taxonomic classification, the second ring indicates what study the genome originates from, the third ring shows genome completeness, the fourth shows contamination, and the fifth (outer) ring shows the number of scaffolds in the genome. The tree was constructed from ribosomal protein markers with metabolisHMM v2.21 [101] by searching for markers with hmmsearch as part of the HMMER v3.2.1 suite [102], aligning hits for each marker with muscle v3.8.31 [103], and building the phylogenetic tree with fasttree v2.1.11 [104]. The tree was visualized and metadata overlaid on the tree with EMPRESS v1.2.0. [105].
Fig. 2
Fig. 2. Anoxic stable isotope probing microcosms fed with labeled acetate.
A Experimental overview of the stable isotope probing (SIP) microcosms and metaproteogenomic analysis; B Cumulative methane production and acetate concentrations over time in the SIP microcosms fed with acetate, along with the unfed control (blank). Shaded regions represent the standard error of biological triplicates. C Ratio (%) of atom-percent 13CO2 to that of 13CH4 measured in the headspace of the SIP microcosms fed with 2-13C (methyl-C labeled) acetate, corrected for background 12C from dissolved inorganic carbon (see Supplementary Tables S3–S5).
Fig. 3
Fig. 3. Time-resolved proteomic labeling of SAO consortium within SIP microcosms.
Heatmaps of (A) relative protein abundance (log10-scaled, based on label-free quantification) and (B) the number of 13C-labeled peptides identified, for the 11 most abundant MAGs at 24, 144, and 408 h of the SIP incubation. Values from biological triplicates are shown for each time point sampled. C The 13C-labeled protein concentration (mg/L) inferred from the total protein quantification approach, relative isotope abundance (RIA), and labeling ratio (LR) of all proteins from MAGs throughout the SIP incubation. Shaded regions indicate the standard error across biological triplicates, accounting for variance in mean RIA and LR across all proteins in the genome. The MAG names used in this figure are derived from Supplementary Data 1.
Fig. 4
Fig. 4. Protein expression of key metabolic pathways in the three-member SAO consortium.
Total protein expression (nM; log10-scaled) for enzymes of interest throughout the acetate-fed SIP incubations in (A) DTU068_1, (B) Methanothermobacter_1, (C) Methanothermobacter_2. The vertical facets represent different sampling time points (24, 144, and 408 h), and the horizontal facets represent protein groups based on different metabolic functions and/or protein complexes. The value labeled “Median” at the bottom represents the genome-wide median protein expression. Values are shown for biological triplicates. For each protein unit, the associated gene locus is given in parentheses next to the name. Proteins in Methanothermobacter_1 and Methanothermobacter_2 that have an asterisk (*) indicate these associated subunits were identical within the two genomes, and thus the shown protein abundance represents this redundancy. Protein abbreviations: Ack acetate kinase, Acs acetyl-coA synthase/carbon monoxide dehydrogenase (CODH), CooC Acs accessory protein, Cyt cytochrome, DUF domain of unknown function, Ech energy-conserving hydrogenase, Eha energy-converting hydrogenase, Fdh formate dehydrogenase, Fhs formate-THF ligase, Fol methenyl-THF cyclohydrolase, Frh F420-reducing hydrogenase, Ftr formyl-MFR:H4MPT formyltransferase, Fwd formyl-MFR dehydrogenase, Hdr heterodisulfide reductase, Hmd H2-dependent methylene-H4MPT dehydrogenase, Hya hydrogenase, Hyd hydrogenase, Mch methenyl-H4MPT cyclohydrolase, Mer methylene-H4MPT reductase, Mtd F420-dependent methylene-H4MPT dehydrogenase, MTase methyltransferase, Mtr F420-dependent methylene-H4MPT dehydrogenase, Mvh F420-non-reducing hydrogenase, Mcr methyl-CoM reductase, Nuo NADH:ubiquinone oxidoreductase, Pta phosphotransacetylase.
Fig. 5
Fig. 5. Predicted metabolic fluxes in the three-member SAO consortium.
Cell diagrams showing the predicted metabolic pathways for acetate oxidation in DTU068_1 and methane generation from hydrogen/formate in Methanothermobacter_1 and Methanothermobacter_2. Values of predicted flux, obtained from parsimonious flux balance analysis, are shown in red text within boxes. Net catabolic reactions are based on stoichiometry obtained from parsimonious flux balance analysis. Protein abbreviations are defined in the legend of Fig. 4.
Fig. 6
Fig. 6. Formate metabolism in Methanothermobacter spp.
A Heatmap showing the ability to grow on formate [73, 75, 106] and the presence/absence of the fdhCAB gene cluster and fdhA-fwd gene cluster for all available sequenced Methanothermobacter genomes, along with the two Methanothermobacter MAGs from this study. The yellow borders used for the formate growth values of the two MAGs indicates that these are inferred traits based on the results of this study. B Map of the genomic arrangement of the formate dehydrogenase-carbonic anhydrase gene cluster found only within genomes of certain Methanothermobacter species, all of which are known to grow on formate, and (C) the tungsten formylmethanofuran dehydrogenase gene cluster observed in all available representative Methanothermobacter genomes. The gene clusters for the Methanothermobacter_A MAGs identified in this study are also shown. The direction of the gene arrows indicate their direction of transcription. NCBI RefSeq accessions of each representative genome is given in parenthesis below its species name. Each gene is labeled with its locus tag, which is sometimes located above/below a gene arrow for visualization purposes. fwd tungsten formylmethanofuran dehydrogenase, fdh formate dehydrogenase, CA carbonic anhydrase, moa GTP 3’,8’-cyclase, mob molybdopterin-guanine dinucleotide biosynthesis-domain protein.
Fig. 7
Fig. 7. An energetic basis for utilizing diverse electron shuttles during SAO by DTU068_1.
Free energy yields (ΔG) per mole of ATP produced for each member of the syntrophic acetate oxidizing consortium as a function of hydrogen partial pressure (PH2), for the cases where the Methanothermobacter_2 MAG (A) is present; and (B) is not present. The dashed gray line represents the ATP phosphorylation potential measured in cells performing acetogenesis from H2 and CO2 (−32.1 kJ/mol-ATP) [96]. Shaded regions represent the ranges of hydrogen partial pressure that would support ATP synthesis by DTU068_1 and Methanothermobacter_1 (yellow region) or DTU068_1 and Methanothermobacter_2 (red region). The free energy values were calculated based on reaction stoichiometry predicted by the parsimonious flux balance analysis model for both cases (Supplementary Data 2), assuming environmentally-relevant concentrations of acetate (50 mM), formate (7.5 μM), methane (0.5atm) and carbon dioxide (0.5atm).

References

    1. Nobu MK, Narihiro T, Mei R, Kamagata Y, Lee PKH, Lee P-H, et al. Catabolism and interactions of uncultured organisms shaped by eco-thermodynamics in methanogenic bioprocesses. Microbiome. 2020;8:111. doi: 10.1186/s40168-020-00885-y. - DOI - PMC - PubMed
    1. Conrad R. Contribution of hydrogen to methane production and control of hydrogen concentrations in methanogenic soils and sediments. FEMS Microbiol Ecol. 1999;28:193–202. doi: 10.1111/j.1574-6941.1999.tb00575.x. - DOI
    1. Conklin AS, Chapman T, Zahller JD, Stensel HD, Ferguson JF. Monitoring the role of aceticlasts in anaerobic digestion: activity and capacity. Water Res. 2008;42:4895–904. doi: 10.1016/j.watres.2008.09.024. - DOI - PubMed
    1. Jetten MSM, Stams AJM, Zehnder AJB. Methanogenesis from acetate: a comparison of the acetate metabolism in Methanothrix soehngenii and Methanosarcina spp. FEMS Microbiol Lett. 1992;88:181–97. doi: 10.1111/j.1574-6968.1992.tb04987.x. - DOI
    1. Zinder SH, Koch M. Non-aceticlastic methanogenesis from acetate: acetate oxidation by a thermophilic syntrophic coculture. Arch Microbiol. 1984;138:263–72. doi: 10.1007/BF00402133. - DOI

Associated data