. 2023 Oct 25;21(1):751.
doi: 10.1186/s12967-023-04445-4.

Decoding meningioma heterogeneity and neoplastic cell-macrophage interaction through single-cell transcriptome profiling across pathological grades

Affiliations

Decoding meningioma heterogeneity and neoplastic cell-macrophage interaction through single-cell transcriptome profiling across pathological grades

Hailang Fan et al. J Transl Med. .

Abstract

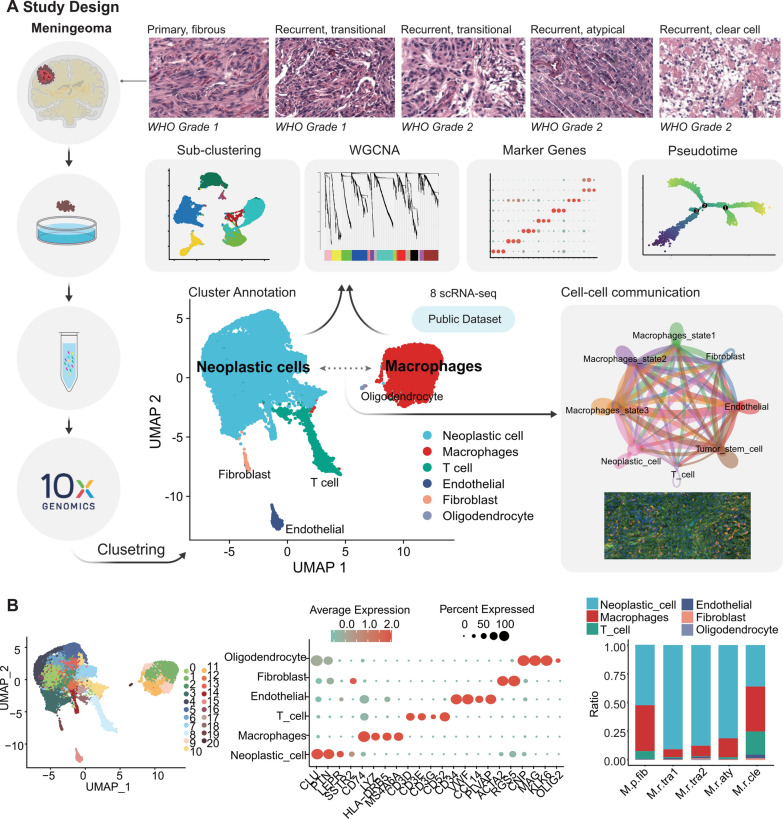
Background: Analyzing meningioma of distinct pathological types at the single-cell level can provide new and valuable insights into the specific biological mechanisms of each cellular subpopulation, as well as their vital interplay within the tumor microenvironment.

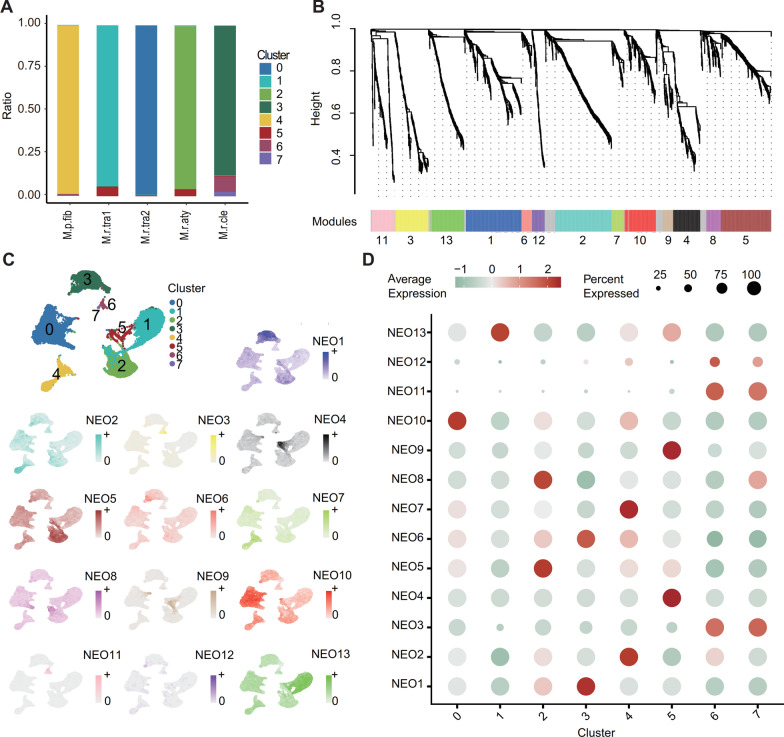
Methods: We recruited patients diagnosed with four distinct types of meningioma and performed single-cell RNA sequencing on their tumor samples, concurrently analyzing a publicly available dataset for comparison. Next, we separated the cells into discrete clusters and identified their unique identities. Using pseudotime analysis, we demonstrated cellular differentiation and dynamics. To investigate biological function, we employed weighted gene co-expression network analysis, gene regulatory network, and gene set enrichment analysis. Additionally, we conducted cell-cell communication analyses to characterize interactions among different clusters and validated a crucial interaction using multiple immunofluorescence staining.

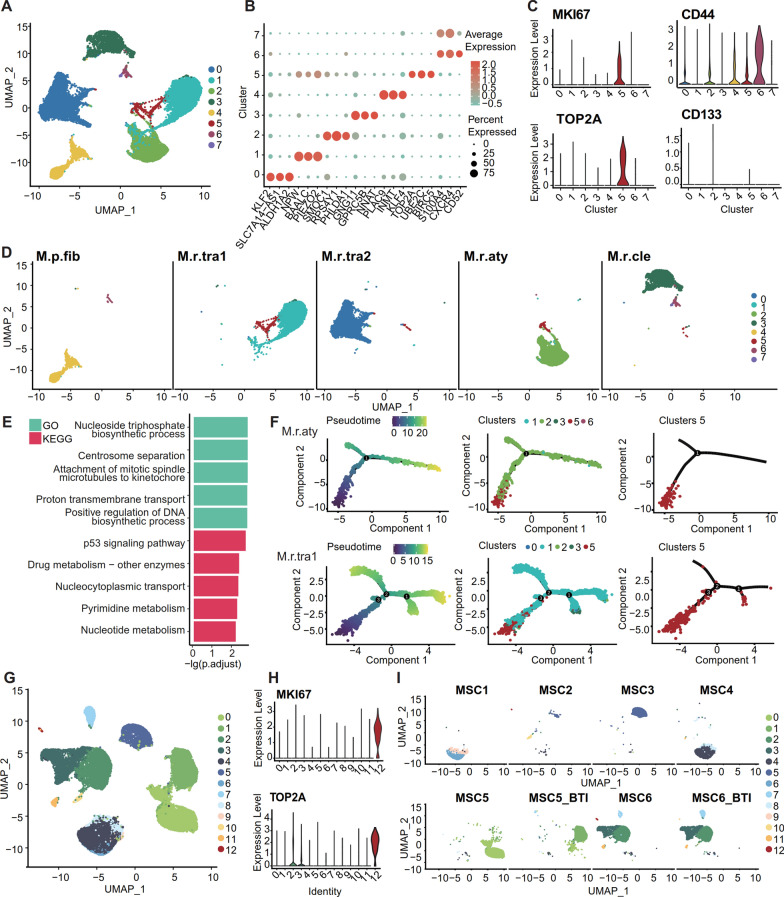
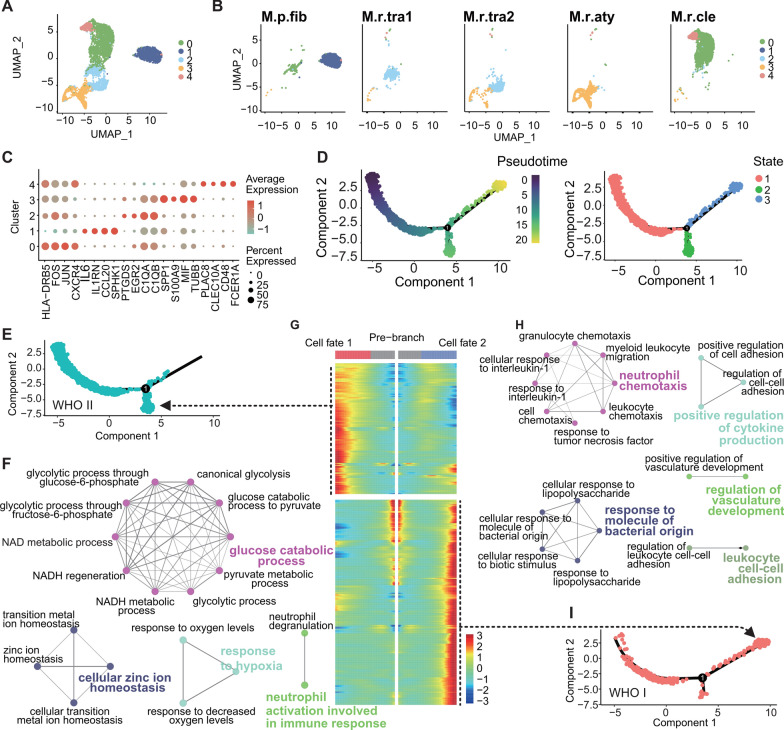
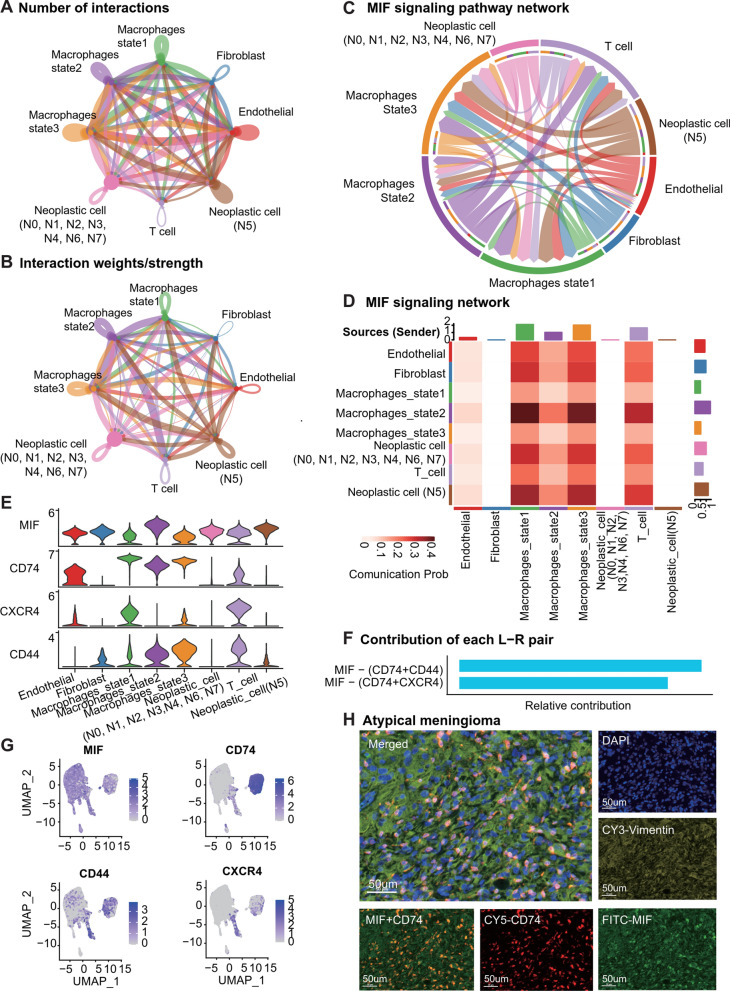
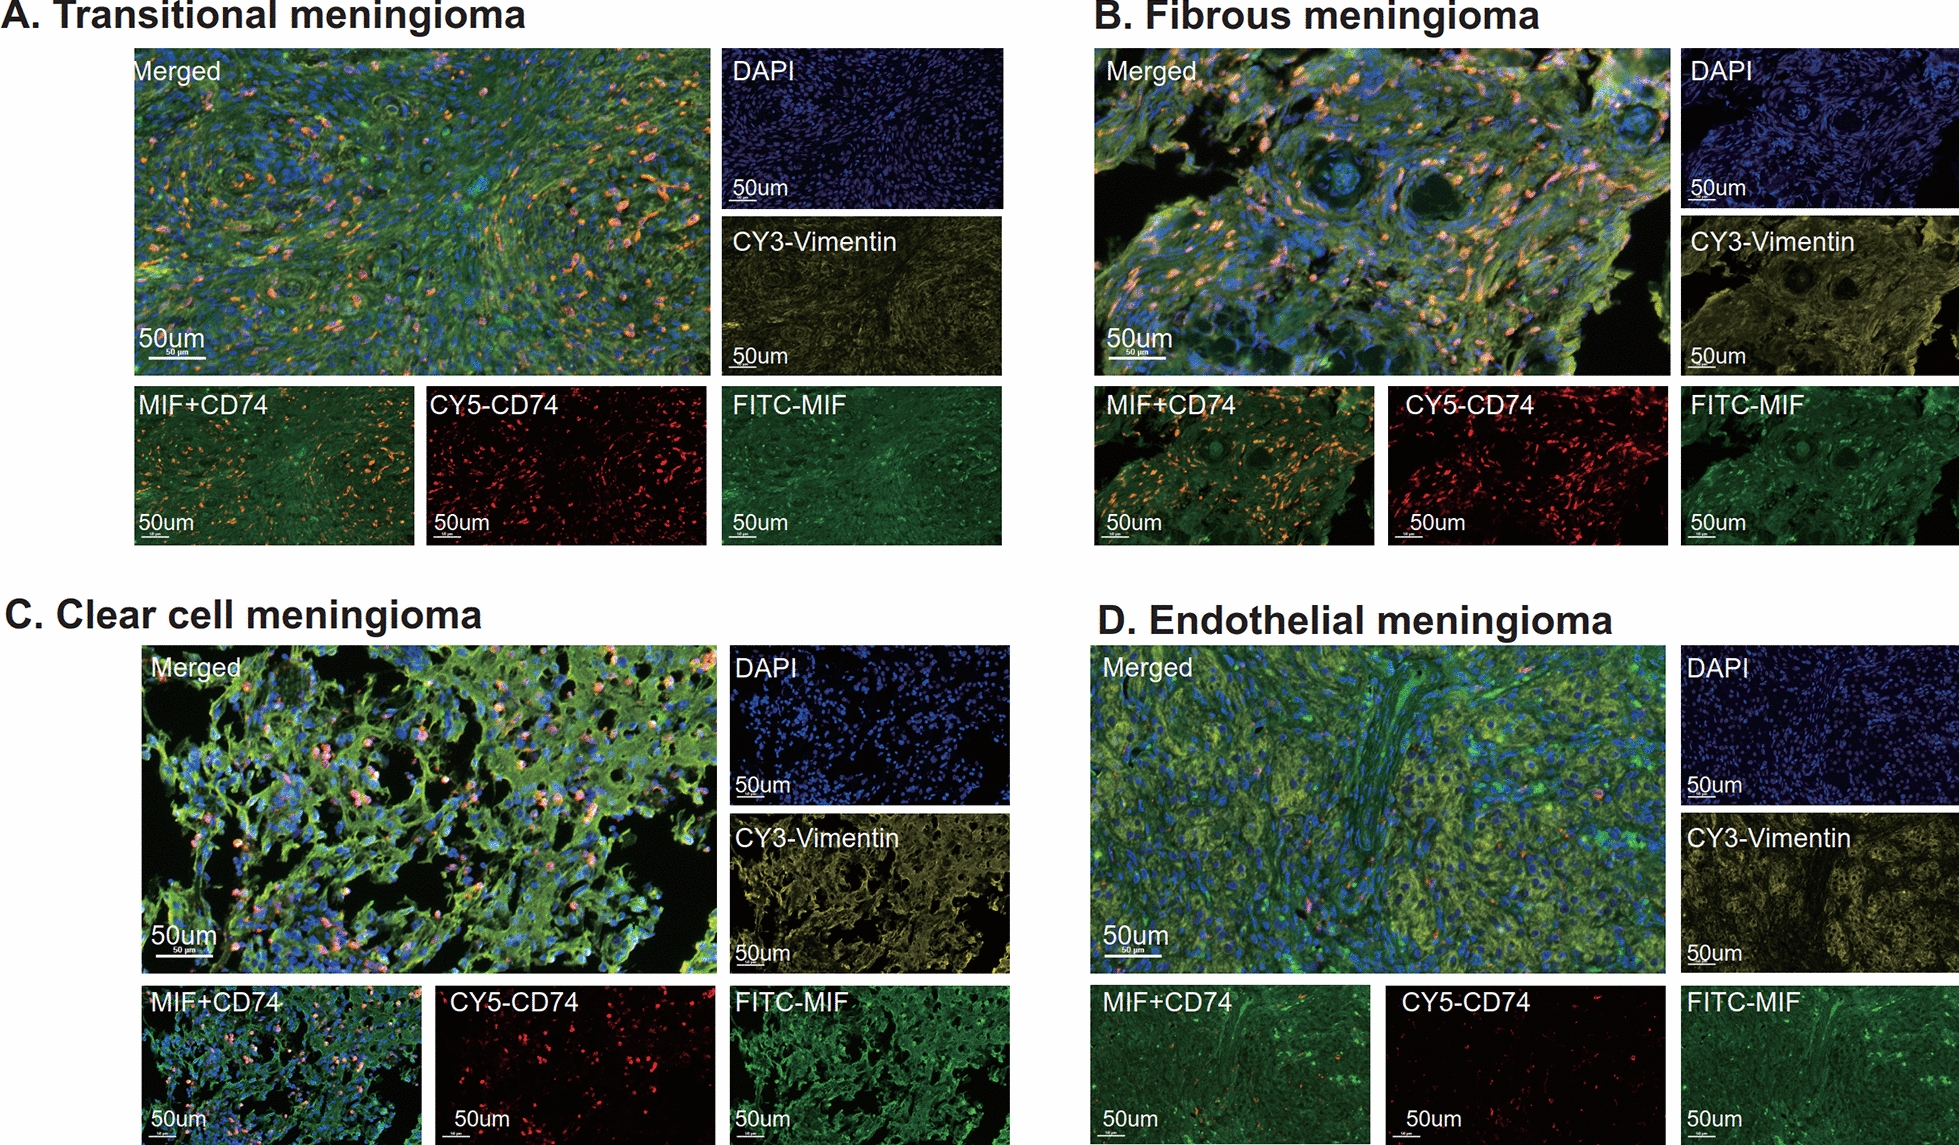
Results: The single-cell transcriptomic profiles for five meningioma of different pathological types demonstrated that neoplastic cells exhibited high inter-sample heterogeneity and diverse biological functions featured by metabolic regulation. A small cluster of neoplastic cells (N5 cluster, < 3%) was most proliferative, indicated by high expression of MKI67 and TOP2A. They were primarily observed in our atypical and transitional meningioma samples and located at the beginning of the pseudotime differentiation branch for neoplastic cells. Macrophages, the most abundant immune cells present, showed two distinct developmental trajectories, one promoting and the other suppressing meningioma growth, with the MIF-CD74 interaction serving as the primary signaling pathway for MIF signals in the tumor environment. Unexpectedly, despite its small cluster size, the N5 cluster demonstrated a significant contribution in this interaction. By staining pathological sections of more samples, we found that this interaction was widely present in different types of meningiomas.

Conclusions: Meningioma neoplastic cells' diverse types cause inter-sample heterogeneity and a wide range of functions. Some proliferative neoplastic cell may educate macrophages, which promotes tumorigenesis possibly through the MIF-CD74 interaction. It provides novel clues for future potential therapeutic avenues.

Keywords: CD74; Heterogeneity; MIF; Meningiomas; scRNA-seq.


Conflict of interest statement

The authors declare that the research was conducted in the absence of any commercial or financial relationships that could be construed as a potential conflict of interest.

Figures

Fig. 1
Fig. 1
Study design and meningioma landscape. A The Meningioma specimens were collected during surgical resection of brain tumors and histologically classified into five distinct pathological types or WHO grades using HE staining. The samples were subjected to scRNA-seq analysis, and after data integration, clustering, and cell type identification, we identified six distinct cell types. We further explored the biological significance and communication relationships of important cell populations during meningioma tumorigenesis using cell type-specific clustering, WGCNA, pseudotime analysis, and cell communication analysis. Additionally, we performed the same analyses on publicly available datasets. B Uniform manifold approximation and projection (UMAP) plot of 23,695 cells (left), color-coded by associated cluster. Each point depicts a single cell. All cells were identified as six different cell types, and corresponding marker genes were determined for each cell type (middle): neoplastic cells (CLU, PTN, LEPR, and SSTR2); macrophages (HLA-DRB5, CD74, MS4A6A, and LYZ); T cells (CD3D, CD3E, CD3G, and CD52); endothelial cells (CD34, VWF, CCL14, and PLVAP); fibroblasts (ACTA2 and RGS5); and oligodendrocytes (CNP, MAG, KLK6, and OLIG2). Scaled color bar = average expression, Size of the point = percent expressed. Proportions of the six cell types in the sample are shown on the right
Fig. 2
Fig. 2
Neoplastic cells subclustering and pseudotime analysis. A UMAP plot of 16,901 neoplastic cells, color-coded by associated cluster. Neoplastic cells were re-clustered into eight subclusters (N0-N7). Each point depicts a single cell. B Marker genes for neoplastic cells in subclusters N0-N7. Scaled color bar = average expression, size of the point = percent expressed. C Expression of MKI67, TOP2A, CD44, and CD133 in neoplastic cells. D Separation of neoplastic cell subclusters in each sample. E GO and KEGG enrichment analysis of marker genes in N5 neoplastic cells (Top 5, p adjusted < 0.05). F Pseudotime analysis of M.r.aty and M.r.tra1 neoplastic cells. The pseudotime evolution time relationship is shown. Scaled color bar = pseudotime (left). Distribution of neoplastic cell on the pseudotime map (right). Each cell in the branched pseudotime trajectory was colored by its pseudotime value and its Seurat clusters. G In a public dataset, neoplastic cells were re-clustered into 13 subclusters. H Expression of MKI67 and TOP2A in neoplastic cells from the public dataset. I Separation of tumor cell subclusters in each sample from the public dataset. Tumor cell distribution showed similarity in tissues from the same sample (e.g., MSC6 and MSC6_BTI). Of these samples, MSC5 (tumor bulk) and MSC5_BTI (brain-tumor interface) were obtained from one patient, while MSC6 (tumor bulk) and MSC6_BTI (brain-tumor interface) from another patient. Each of the remaining samples was from distinct patients
Fig. 3
Fig. 3
WGCNA analysis of neoplastic cells. A Proportions of different subclusters of neoplastic cells in the samples. B Gene co-expression modules identified by WGCNA analysis of neoplastic cells. Thirteen modules (NEO1-NEO13) were identified, with each module represented by a different color except for the gray module. C Expression profiles of the top 50 genes in each of the 13 modules in the neoplastic cell UMAP. D Expression of the genes in the 13 modules across different subpopulations of neoplastic cells. Scaled color bar = average expression, size of the point = percent expressed
Fig. 4
Fig. 4
Subclustering and pseudotime analysis of macrophages in meningiomas. A UMAP plot of 4795 macrophages, color-coded according to their associated clusters. Macrophages were re-clustered into five subclusters. Each point represents a single cell. B Macrophage subclusters were separated across different pathological types of meningiomas and showed similar distribution in samples with the same pathological type (M.r.tra1 and M.r.tra2). C Marker genes for each macrophage subcluster. Scaled color bar = average expression, size of the point = percent expressed. D Pseudotime analysis of macrophages. Scaled color bar represents the pseudotime (left). Distribution of macrophage pseudotime states (right). Each cell in the branched pseudotime trajectory was colored by its pseudotime value and its Seurat clusters. E Distribution of WHO grade II meningioma macrophages in pseudotime analysis, mainly in state1 and state3. F Grouped network of enriched GO terms for high-expression genes in cell fate 1. G Heatmap of high-expression genes for different cell fates in pseudotime analysis. Scaled color bar indicates the average expression. The high-expression gene set for cell fate 1 is predominantly located on the left side of the heatmap, while that for cell fate 2 is concentrated on the right side. H Distribution of WHO grade I meningioma macrophages in pseudotime analysis, mainly in state1 and state2. I Grouped network of enriched GO terms for high-expression genes in cell fate 2
Fig. 5
Fig. 5
Intercellular communication analysis in meningiomas. A Number of interactions network among cells. The thickness of the lines represents the number of interactions. B Interaction weight network among cells. The thickness of the lines represents the interaction weight. C Chord plot showing the inferred intercellular communication network of MIF signaling. D Heatmap of communication probability in MIF signaling, scaled color bar = Communication Probability. E Violin plots of ligand and receptor genes (MIF, CD74, CXCR4, and CD44) expression in cells in the MIF signaling. F Ligand-receptor pairs included in the MIF signaling and their relative contribution. G UMAP plot showing cells expressing MIF, CD74, CXCR4, and CD44 colored. H Multiplex immunofluorescence staining of atypical meningioma, MIF (red fluorescence), CD74 (green fluorescence), Vimentin (yellow fluorescence), and DAPI (blue fluorescence). Scale bar, 50 μm
Fig. 6
Fig. 6
Multiple immunofluorescence staining of different pathological types of meningioma tissues. A Multiple immunofluorescence staining of transitional meningioma. B Multiple immunofluorescence staining of fibrous meningioma. C Multiple immunofluorescence staining of clear cell meningioma. D Multiple immunofluorescence staining of endothelial meningioma. The staining includes MIF (green fluorescence), CD74 (red fluorescence), Vimentin (yellow fluorescence) and DAPI (blue fluorescence). Scale bar, 50 μm

References

    1. Whittle IR, Smith C Fau - Navoo P, Navoo P Fau - Collie D, Collie D. Meningiomas. Lancet. 2004;363:1535–43. - PubMed
    1. Harter PN, Braun Y, Plate KH. Classification of meningiomas-advances and controversies. Chin Clin Oncol. 2017;6(Suppl 1):S2. doi: 10.21037/cco.2017.05.02. - DOI - PubMed
    1. Louis DN, Perry A, Wesseling PA-O, Brat DA-O, Cree IA, Figarella-Branger D, Hawkins C, Ng HK, Pfister SM, Reifenberger G, et al. WHO classification of tumors of the central nervous system: a summary. Neuro Oncol. 2021;23:1231–1251. doi: 10.1093/neuonc/noab106. - DOI - PMC - PubMed
    1. Nassiri F, Liu J, Patil V, Mamatjan Y, Wang JZ, Hugh-White R, Macklin AM, Khan S, Singh O, Karimi S, et al. A clinically applicable integrative molecular classification of meningiomas. Nature. 2021;597:119–125. doi: 10.1038/s41586-021-03850-3. - DOI - PMC - PubMed
    1. Youngblood MW, Miyagishima DF, Jin L, Gupte T, Li C, Duran D, Montejo JD, Zhao A, Sheth A, Tyrtova E, et al. Associations of meningioma molecular subgroup and tumor recurrence. Neuro Oncol. 2021;23:783–794. doi: 10.1093/neuonc/noaa226. - DOI - PMC - PubMed

Publication types

LinkOut - more resources