

Shoulder replacement surgery's rising demand, inequality of provision, and variation in outcomes: cohort study using Hospital Episode Statistics for England
- PMID: 37880689
- PMCID: PMC10601312
- DOI: 10.1186/s12916-023-03112-1
Shoulder replacement surgery's rising demand, inequality of provision, and variation in outcomes: cohort study using Hospital Episode Statistics for England
Abstract
Background: The aim of this study was to forecast future patient demand for shoulder replacement surgery in England and investigate any geographic and socioeconomic inequalities in service provision and patient outcomes.
Methods: For this cohort study, all elective shoulder replacements carried out by NHS hospitals and NHS-funded care in England from 1999 to 2020 were identified using Hospital Episode Statistics data. Eligible patients were aged 18 years and older. Shoulder replacements for malignancy or acute trauma were excluded. Population estimates and projections were obtained from the Office for National Statistics. Standardised incidence rates and the risks of serious adverse events (SAEs) and revision surgery were calculated and stratified by geographical region, socioeconomic deprivation, sex, and age band. Hospital costs for each admission were calculated using Healthcare Resource Group codes and NHS Reference Costs based on the National Reimbursement System. Projected rates and hospital costs were predicted until the year 2050 for two scenarios of future growth.
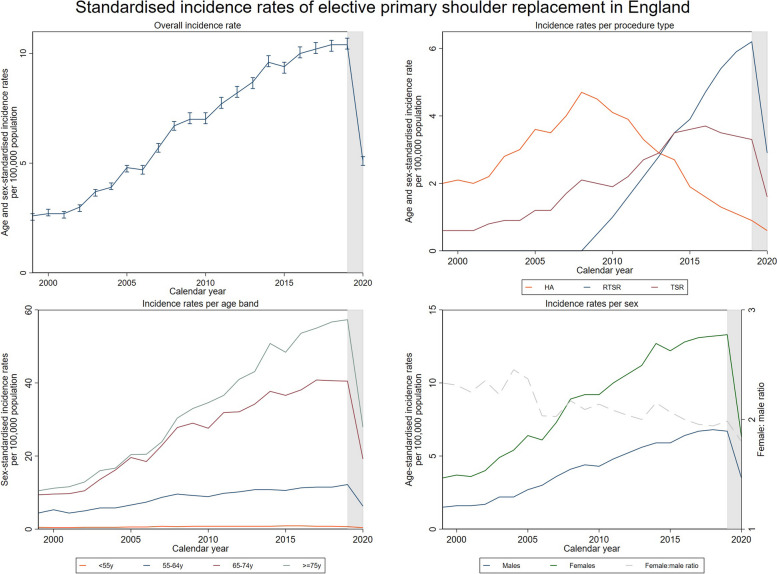
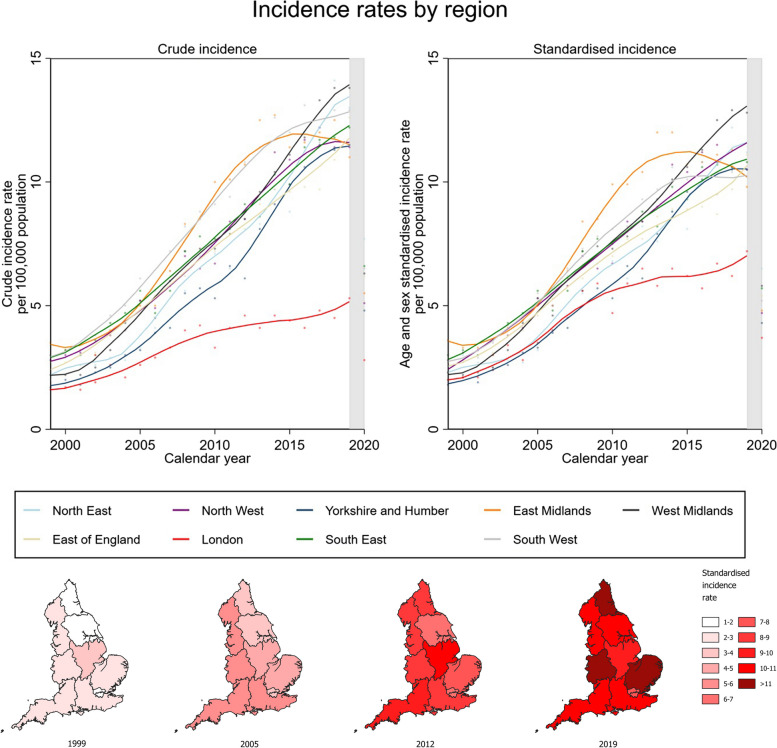
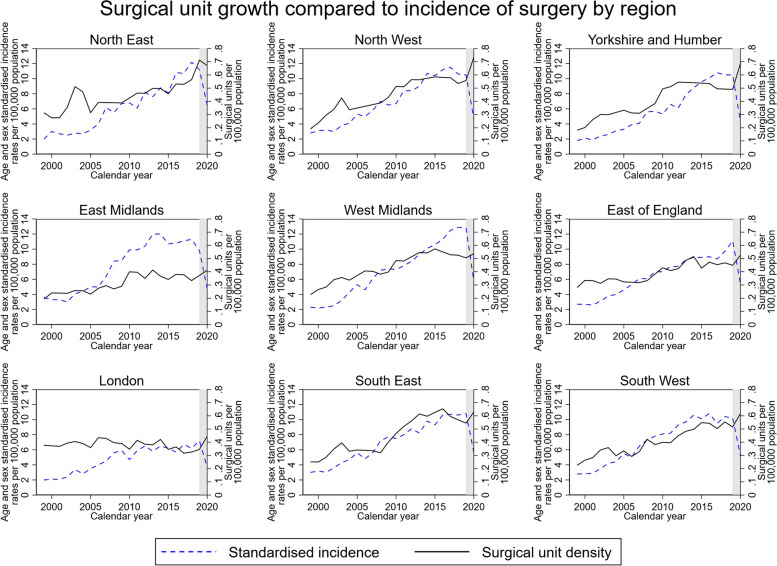
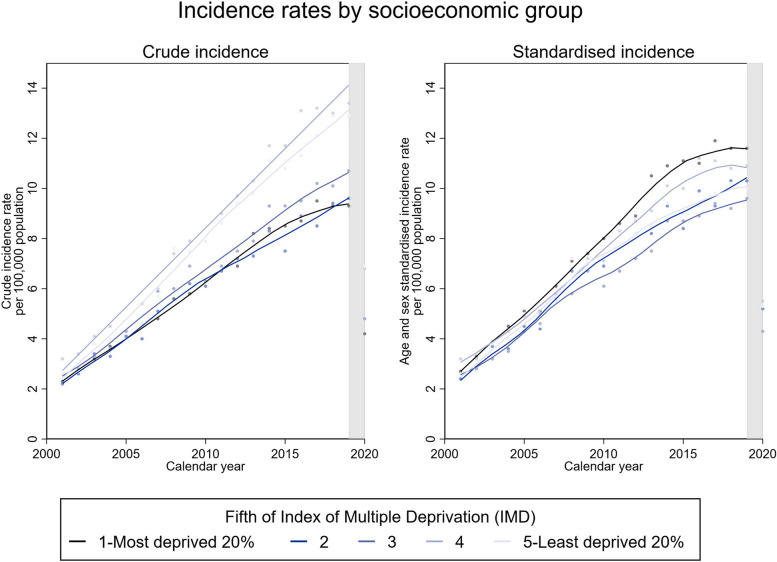
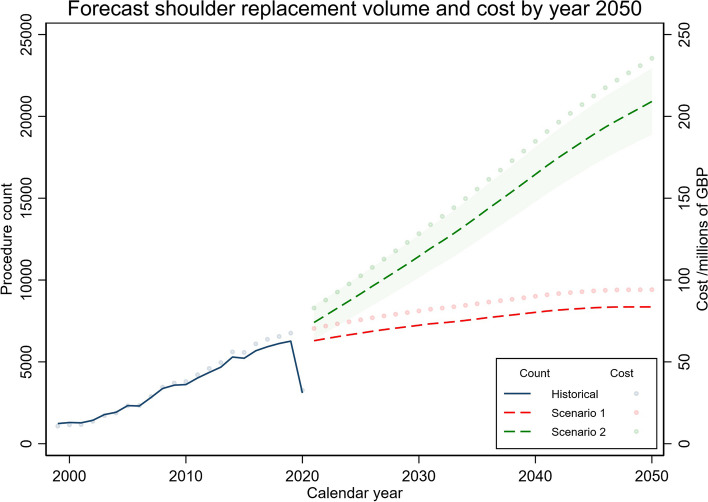
Results: A total of 77,613 elective primary and 5847 revision shoulder replacements were available for analysis. Between 1999 and 2020, the standardised incidence of primary shoulder replacements in England quadrupled from 2.6 to 10.4 per 100,000 population, increasing predominantly in patients aged over 65 years. As many as 1 in 6 patients needed to travel to a different region for their surgery indicating inequality of service provision. A temporal increase in SAEs was observed: the 30-day risk increased from 1.3 to 4.8% and the 90-day risk increased from 2.4 to 6.0%. Patients from the more deprived socioeconomic groups appeared to have a higher risk of SAEs and revision surgery. Shoulder replacements are forecast to increase by up to 234% by 2050 in England, reaching 20,912 procedures per year with an associated annual cost to hospitals of £235 million.
Conclusions: This study reports a rising incidence of shoulder replacements, regional disparities in service provision, and an overall increasing risk of SAEs, especially in more deprived socioeconomic groups. These findings highlight the need for better healthcare planning to match local population demand, while more research is needed to understand and prevent the increase observed in SAEs.
Keywords: Cohort study; Service provision; Shoulder replacement; Temporal trends.
© 2023. BioMed Central Ltd., part of Springer Nature.
Conflict of interest statement
GSC declares no competing interests. EMV is an NIHR doctoral fellowship award holder. RPV is a co-applicant on research grants to NIHR at the University of Oxford. JLR holds an NIHR senior investigator award and is the president of the British Elbow and Shoulder Society. AS and JLR hold a contract with the NJR (FTS 010307–2022: Statistical Analysis, Support and Associated Services).
Figures

References
-
- Nygren A, Berglund A, Von Koch M. Neck-and-shoulder pain, an increasing problem. Strategies for using insurance material to follow trends. Scand J Rehabil Med. 1995;32(Suppl):107–12. - PubMed
-
- Brown JS, Gordon RJ, Peng Y, Hatton A, Page RS, Macgroarty KA. Lower operating volume in shoulder arthroplasty is associated with increased revision rates in the early postoperative period: long-term analysis from the Australian orthopaedic association national joint replacement registry. J Shoulder Elbow Surg. 2020;29:1104. - DOI - PubMed
Publication types
MeSH terms
Grants and funding
LinkOut - more resources
Full Text Sources
Research Materials
