. 2023 Oct 25;42(1):281.
doi: 10.1186/s13046-023-02853-4.

Implementing patient derived organoids in functional precision medicine for patients with advanced colorectal cancer

Affiliations

Implementing patient derived organoids in functional precision medicine for patients with advanced colorectal cancer

Jérôme Cartry et al. J Exp Clin Cancer Res. .

Abstract

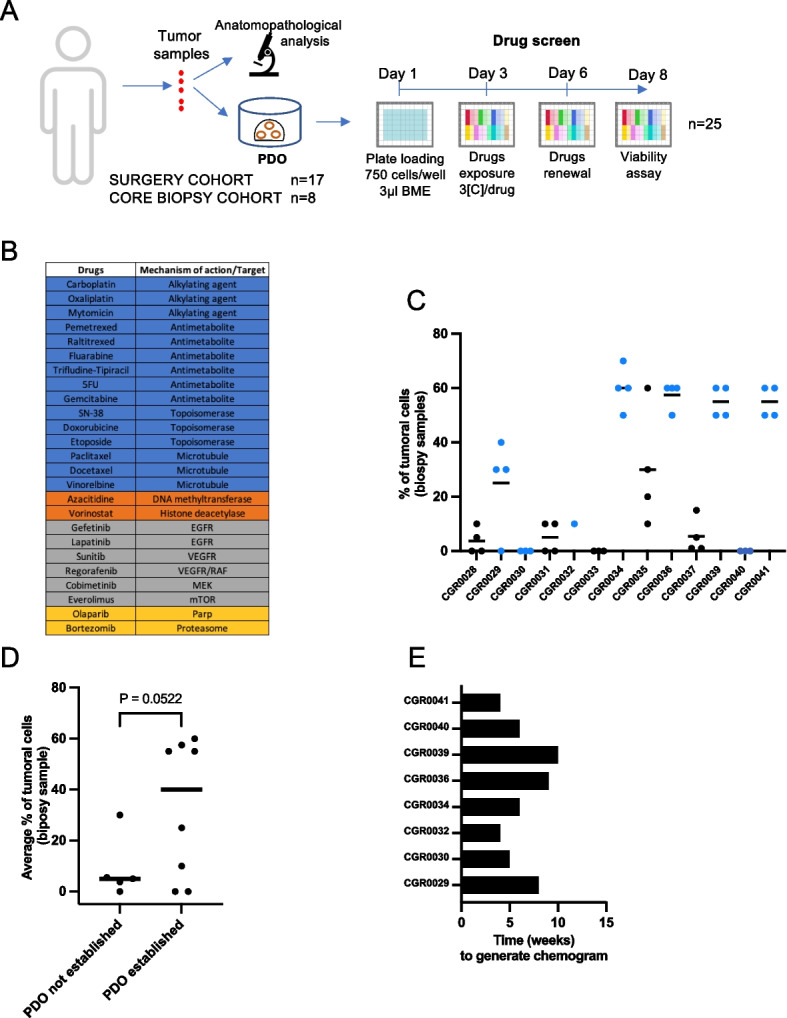
Background: Patient Derived Organoids (PDOs) emerged as the best technology to develop ex vivo tumor avatars. Whether drug testing on PDOs to identify efficient therapies will bring clinical utility by improving patient survival remains unclear. To test this hypothesis in the frame of clinical trials, PDO technology faces three main challenges to be implemented in routine clinical practices: i) generating PDOs with a limited amount of tumor material; ii) testing a wide panel of anti-cancer drugs; and iii) obtaining results within a time frame compatible with patient disease management. We aimed to address these challenges in a prospective study in patients with colorectal cancer (CRC).

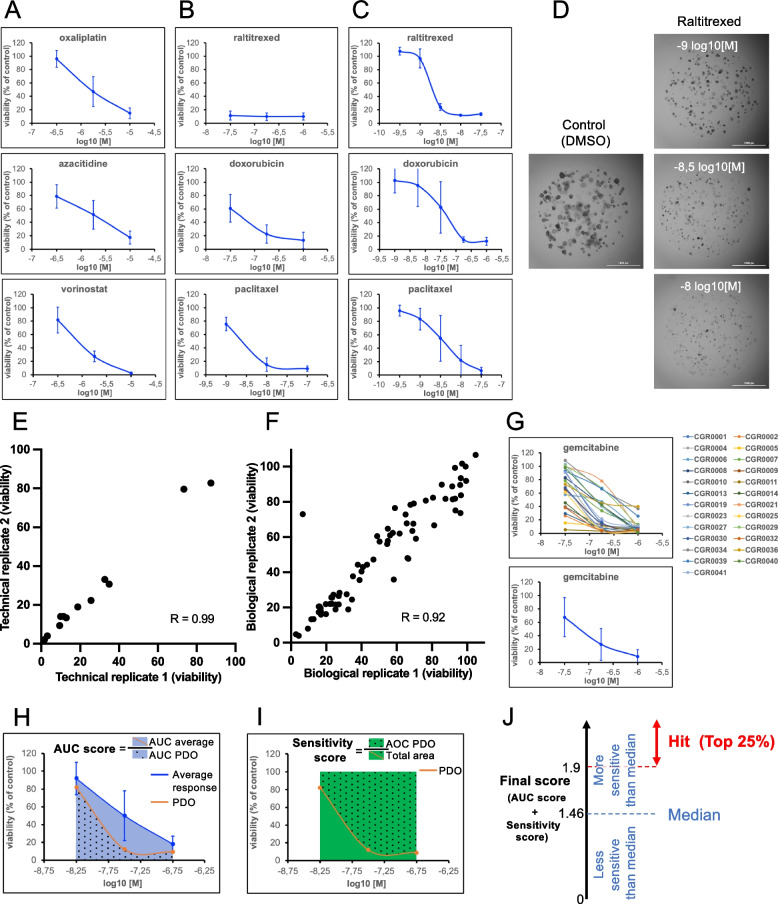
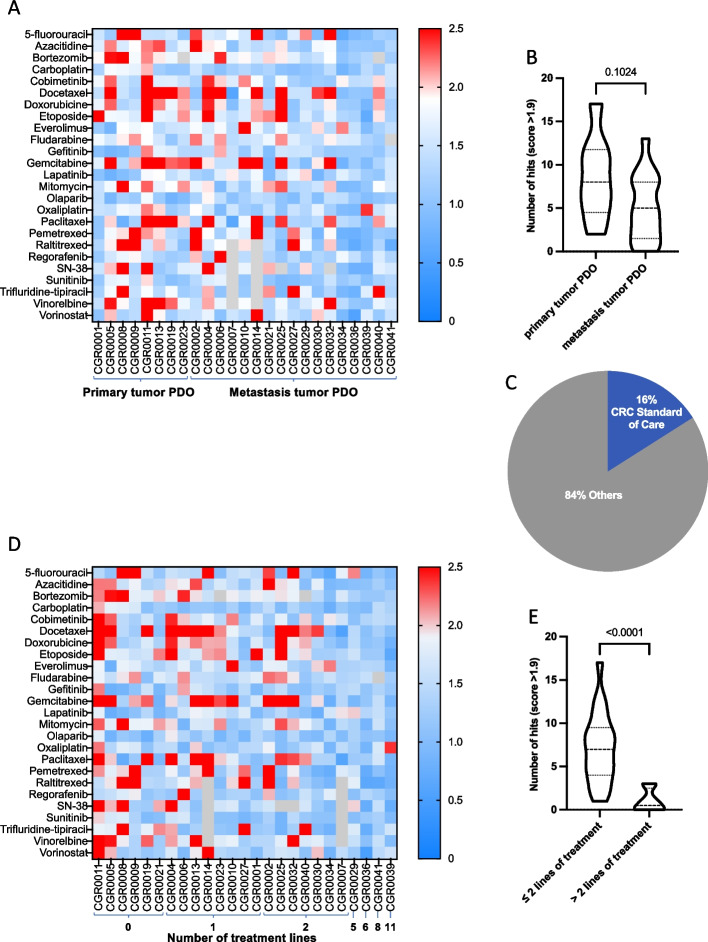
Methods: Fresh surgical or core needle biopsies were obtained from patients with CRC. PDOs were established and challenged with a panel of 25 FDA-approved anti-cancer drugs (chemotherapies and targeted therapies) to establish a scoring method ('chemogram') identifying in vitro responders. The results were analyzed at the scale of the cohort and individual patients when the follow-up data were available.

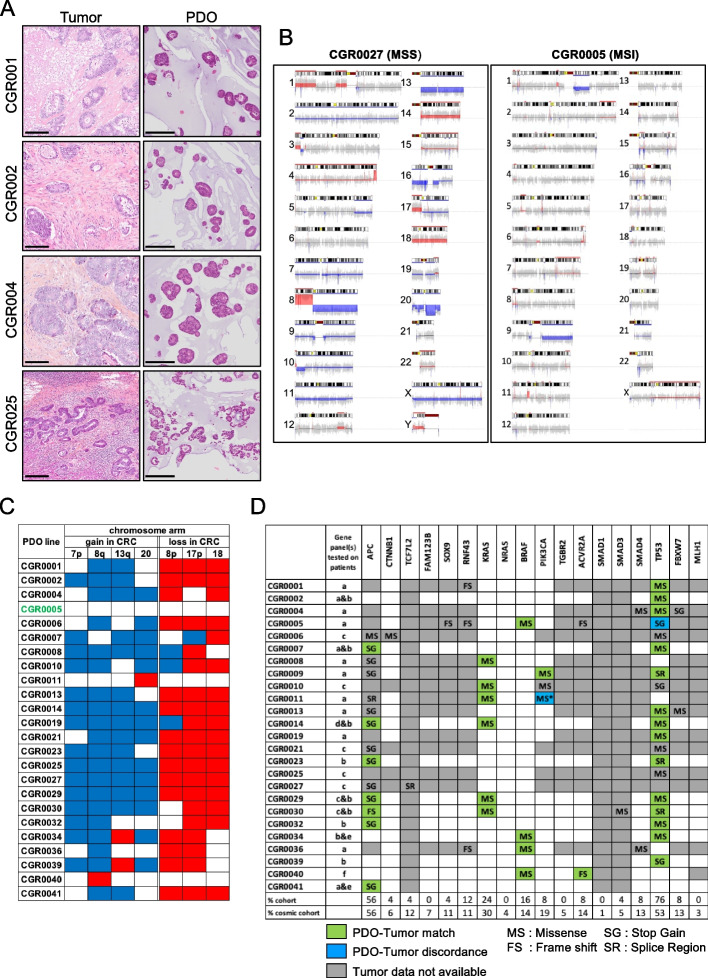
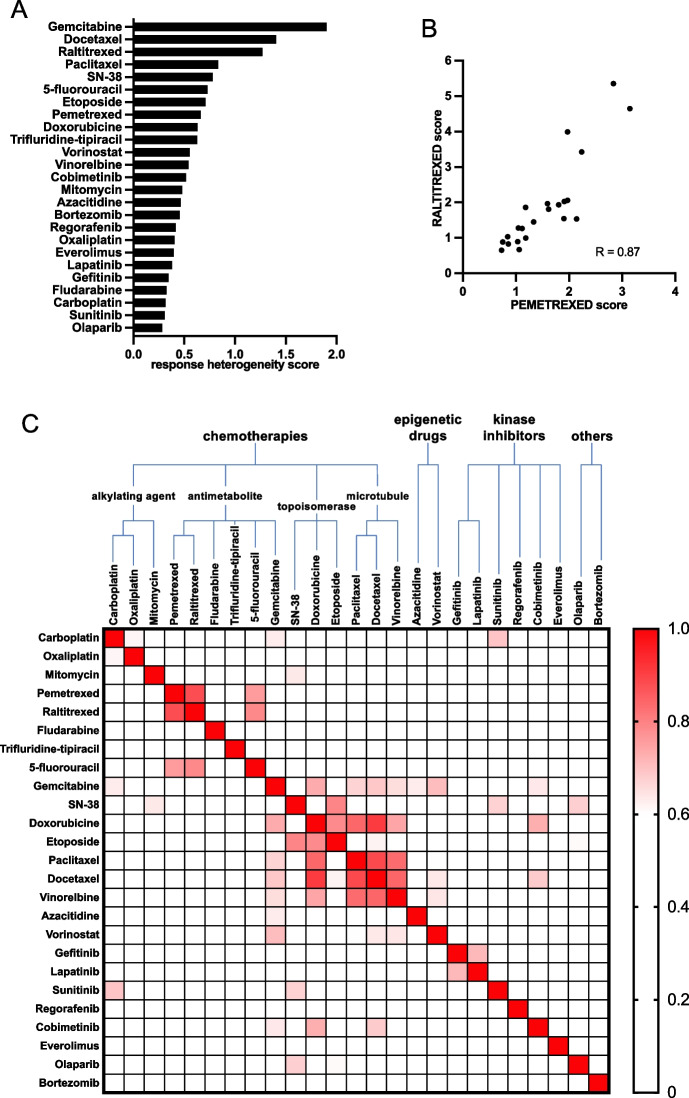
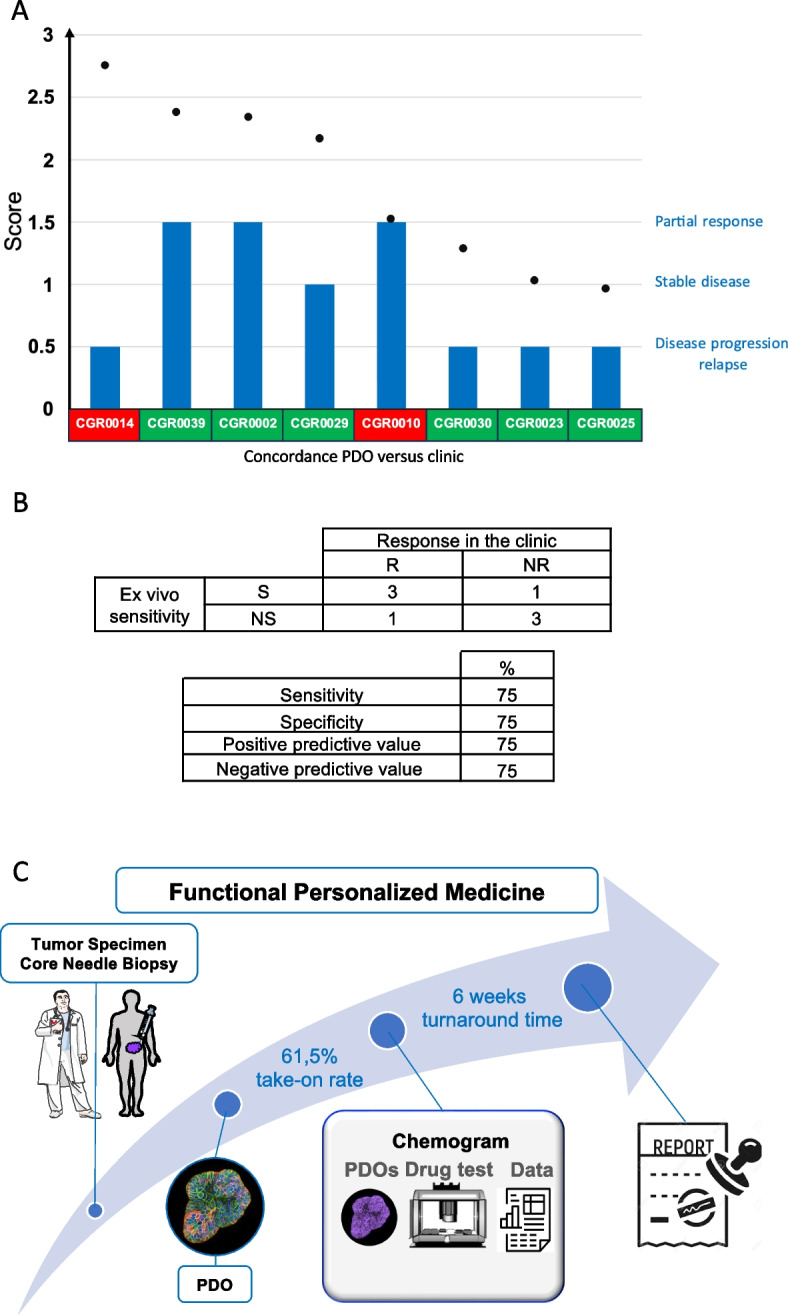
Results: A total of 25 PDOs were successfully established, harboring 94% concordance with the genomic profile of the tumor they were derived from. The take-on rate for PDOs derived from core needle biopsies was 61.5%. A chemogram was obtained with a 6-week median turnaround time (range, 4-10 weeks). At least one hit (mean 6.16) was identified for 92% of the PDOs. The number of hits was inversely correlated to disease metastatic dissemination and the number of lines of treatment the patient received. The chemograms were compared to clinical data obtained from 8 patients and proved to be predictive of their response with 75% sensitivity and specificity.

Conclusions: We show that PDO-based drug tests can be achieved in the frame of routine clinical practice. The chemogram could provide clinicians with a decision-making tool to tailor patient treatment. Thus, PDO-based functional precision oncology should now be tested in interventional trials assessing its clinical utility for patients who do not harbor activable genomic alterations or have developed resistance to standard of care treatments.

Keywords: Chemogram; Colorectal cancer; Organoids; Precision medicine.


Conflict of interest statement

F.J and J.C are co-founders of ORAKL Oncology. The authors declare that they have no competing interests.

Figures

Fig. 1
Fig. 1
Study design and PDOs derivation. A Overview of the procedure. B Mechanism of action or target of the drugs used in the study (blue: chemotherapies, orange: epigenetic drugs, grey: kinase inhibitors, yellow: others). C Percentage of tumor cells retrieved from core needle biopsy samples. During each biopsy procedure, several tumor samples were taken. Amongst all samples collected, 1 (e.g., CGR0030) to 4 (e.g., CGR0029) of them were assessed for cellularity. Each dot represents one core needle biopsy sample, the dots are blue when the corresponding PDO line has been successfully derived. D Average percentage of tumoral cells in the biopsy samples according to PDO establishment. E Time (in weeks) lasting from biopsy to chemogram results. Data are presented as each value and mean in C and D. Significance is determined with unpaired two-tailed t-test with Welch’s correction in D
Fig. 2
Fig. 2
Histological and molecular analysis of PDOs. A H&E (hematoxylin/eosin) staining of tumor and matching PDO. Scale Bar, 250 μm. B CNA representation of an MSS PDO (left panel) and an MSI PDO (right panel). Blue and Red indicate gain and loss regions respectively. C CNA of the 25 PDO lines for 7 chromosome arms frequently altered in CRC carcinogenesis. D Oncogenic somatic mutations of the PDOs for 18 genes and comparison with available molecular alterations of matching tumors. The percentage of each mutation in the PDO cohort is compared to the percenatge of mutations observed in the cosmic cohort. MS*: The missense PIK3CA mutation is found in the tumor tissue but not in the matching CGR0011 PDO. The gene panels tested on tumor tissues are detailed in Supplementary Table 2
Fig. 3
Fig. 3
Chemogram Calibration. A-B Drug concentrations first characterization. Average response of 8 PDOs. C Drug concentrations second characterization. Average response of 8 PDOs. D Bright-Field imaging at day 8 of CGR0002 PDO exposed to 3 concentrations of Raltitrexed. E Drug test technical reproducibility. F Drug test biological reproducibility. G Relative viability (%) of the 25 PDO lines tested with gemcitabine at 3 concentrations (top panel). Bottom panel shows the average response of the 25 PDO lines to gemcitabine. H-J Scoring system. H AUC score: for each drug the average response of the 25 PDOs to an individual drug is determined (blue line) and allows for average AUC calculation (blue area ± dots). This AUC is divided by the AUC of the response of an individual PDO line (orange line and blue area with dots). I Sensitivity score: ratio between the area over the curve (green with dots) and the total area (green ± dots). J The AUC score was summed to the sensitivity score to give rise to the final score used in this study. Hit determination according to the median score of the entire dataset (25 PDOs tested with 25 drugs). Data are presented as the mean ± SD in A, B and C (n = 8 PDOs), as the mean ± SD in G (bottom panel; n = 25 PDOs), as the mean of triplicates in E (CGR0025 screened twice on the same run with 4 drugs at 3 concentrations (12 dots)), as the mean of triplicates in F (CGR0025 screened on two different runs with a 2-week interval for 25 drugs at 3 concentrations (75 dots)). Correlation is determined with the Pearson correlation coefficient (R) in E and F
Fig. 4
Fig. 4
Drug test correlation. A Response heterogeneity score (standard deviation of the scores) calculated for the 25 PDOs to each drug. B Scatterplot of the 25 PDOs score to both Pemetrexed and Raltitrexed. Each dot represents one PDO. C Drug Correlation matrix. The score of the 25 PDO lines to all drugs is analyzed with a Pearson correlation test in C. Color coding highlights the correlation based on the Pearson correlation coefficient (R)
Fig. 5
Fig. 5
Drug response landscape across the PDOs collection. A Heatmap of scores of all 25 drugs tested on the 25 PDOs. Grey square indicates not tested. PDOs were clustered according to origin of the tumor samples (primary or metastasis). B Number of hits identified in primary tumor and metastasis derived PDO. C Percentage of hits belonging to the CRC therapeutic arsenal versus drugs with authorization in other pathologies. D Heatmap of PDO scores to each of the 25 drugs tested. PDOs were clustered according to the number of treatment lines received by the patients pre-surgery/biopsy used to generate the PDO was done. E Numbers of hits per PDO according to the number of previous treatment lines. Data are presented as a violin plot with median (dashed line), 1st and 3rd quartiles (dotted lines) in B and E. Significance is determined with unpaired two-tailed t-test with Welch’s correction in B and E
Fig. 6
Fig. 6
Case report. A Score of the 25 drugs tested on CGR0039 PDO. B Oxaliplatin score for the 25 PDOs. C Lab value of ALP, ASAT, ALAT (liver function) ACE and CA 19–9 (tumor marker) blood levels collected from the biopsy date (day = 0) up to 50 days after the end of the CAPOX treatment. D CT-scan before and 2 months after the beginning of the CAPOX treatment. Red line delimits the peritoneal effusion before treatment which is not observed after 2 months of CAPOX treatment
Fig. 7
Fig. 7
Clinical concordance between PDOs and matching patients. A Plotting of drug score (black dots) and clinical response (blue bars) on 8 PDOs with matching clinical data. Green and red rectangles indicate concordance and discrepancy respectively between PDO sensitivity and clinical response. B Patient and matching PDO response. S: Sensitive, NS: Non-Sensitive, R: Responder, NR: Non-Responder (upper table). Predictive scores (lower table). C Functional Personalized Medicine workflow

References

    1. Cervantes A, Adam R, Roselló S, Arnold D, Normanno N, Taïeb J, et al. Metastatic colorectal cancer: ESMO Clinical Practice Guideline for diagnosis, treatment and follow-up. Ann Oncol. 2022;S0923–7534(22):04192–4198. - PubMed
    1. Cuppen E, Elemento O, Rosenquist R, Nikic S, IJzerman M, Zaleski ID, et al. Implementation of Whole-Genome and Transcriptome Sequencing Into Clinical Cancer Care. JCO Precis Oncol. 2022;6:e2200245. - PMC - PubMed
    1. Rodon J, Soria JC, Berger R, Miller WH, Rubin E, Kugel A, et al. Genomic and transcriptomic profiling expands precision cancer medicine: the WINTHER trial. Nat Med. 2019;25(5):751–758. - PMC - PubMed
    1. Massard C, Michiels S, Ferté C, Le Deley MC, Lacroix L, Hollebecque A, et al. High-Throughput Genomics and Clinical Outcome in Hard-to-Treat Advanced Cancers: Results of the MOSCATO 01 Trial. Cancer Discov. 2017;7(6):586–595. - PubMed
    1. Cobain EF, Wu YM, Vats P, Chugh R, Worden F, Smith DC, et al. Assessment of Clinical Benefit of Integrative Genomic Profiling in Advanced Solid Tumors. JAMA Oncol. 2021;7(4):525–533. - PMC - PubMed

Substances