. 2023 Nov 29;89(11):e0098823.
doi: 10.1128/aem.00988-23. Epub 2023 Oct 26.

Diversity at single nucleotide to pangenome scales among sulfur cycling bacteria in salt marshes

Affiliations

Diversity at single nucleotide to pangenome scales among sulfur cycling bacteria in salt marshes

Sherlynette Pérez Castro et al. Appl Environ Microbiol. .

Abstract

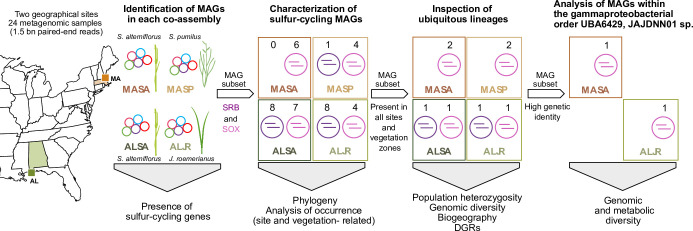
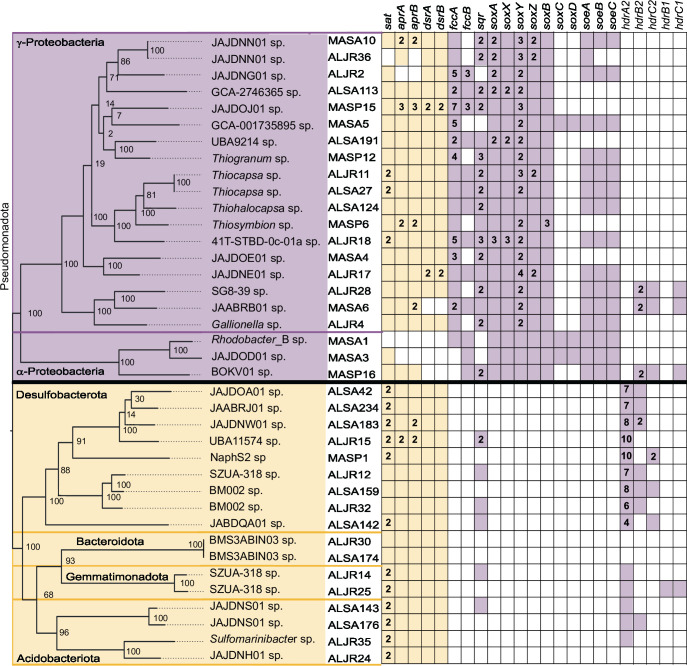
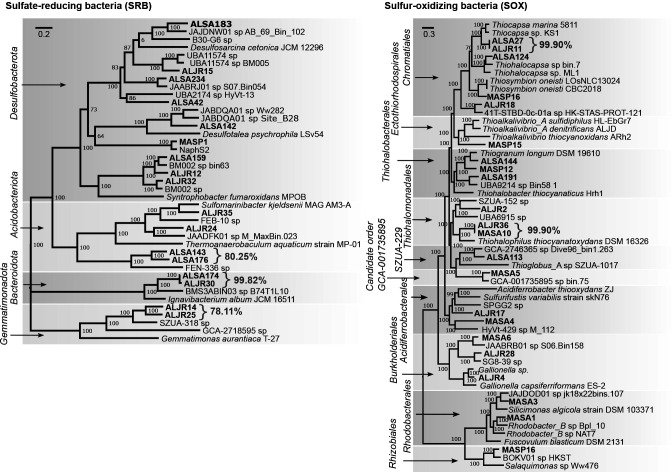
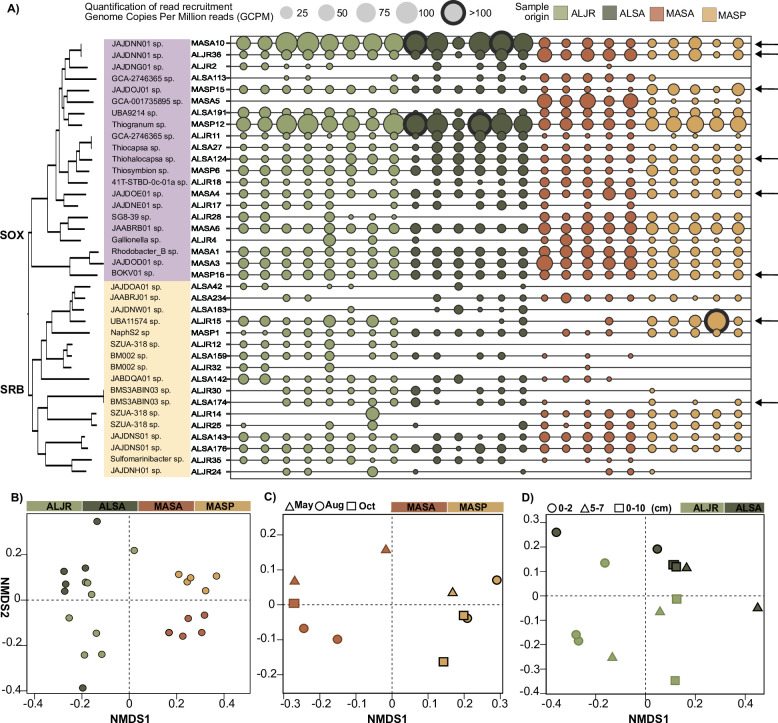
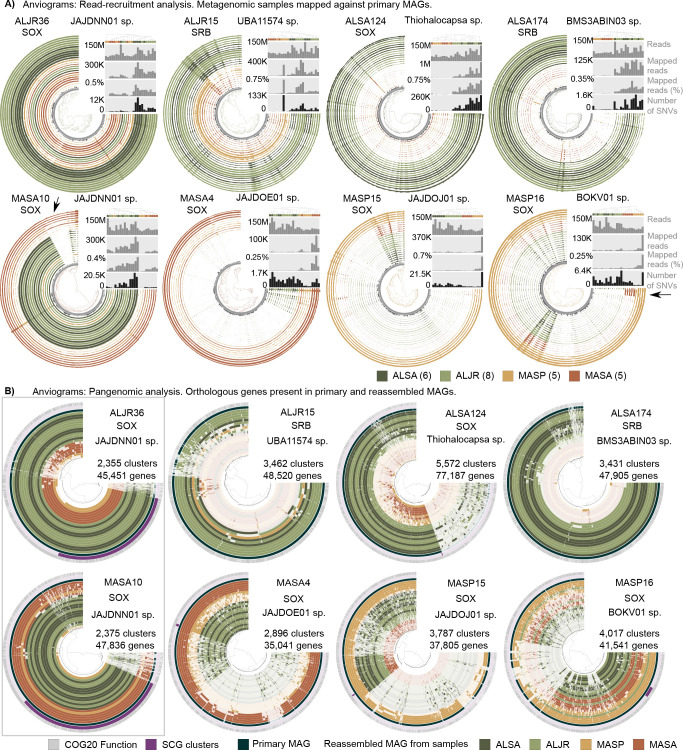
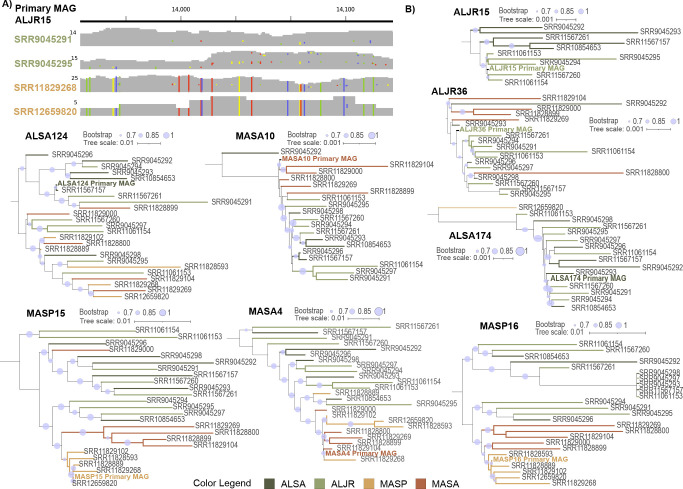
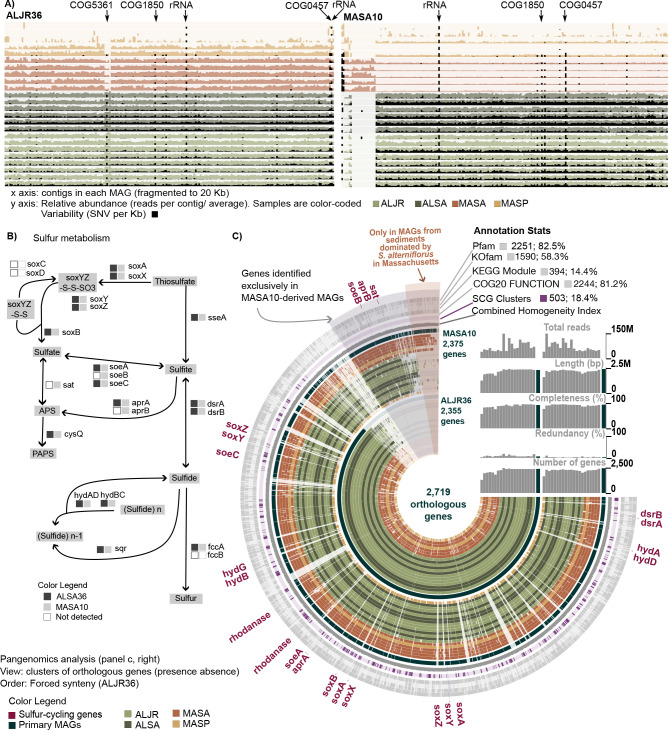
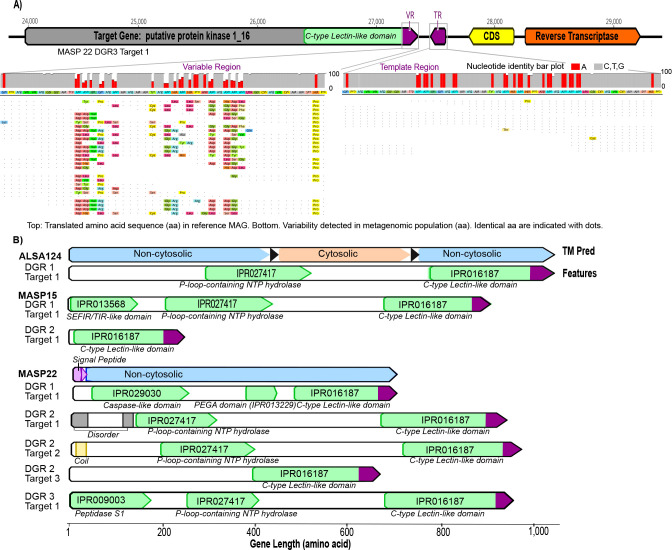
Salt marshes are known for their significant carbon storage capacity, and sulfur cycling is closely linked with the ecosystem-scale carbon cycling in these ecosystems. Sulfate reducers are key for the decomposition of organic matter, and sulfur oxidizers remove toxic sulfide, supporting the productivity of marsh plants. To date, the complexity of coastal environments, heterogeneity of the rhizosphere, high microbial diversity, and uncultured majority hindered our understanding of the genomic diversity of sulfur-cycling microbes in salt marshes. Here, we use comparative genomics to overcome these challenges and provide an in-depth characterization of sulfur-cycling microbial diversity in salt marshes. We characterize communities across distinct sites and plant species and uncover extensive genomic diversity at the taxon level and specific genomic features present in MAGs affiliated with uncultivated sulfur-cycling lineages. Our work provides insights into the partnerships in salt marshes and a roadmap for multiscale analyses of diversity in complex biological systems.

Keywords: diversity-generating retroelement; pangenomics; single-nucleotide polymorphism; site-specific genetic diversity; sulfate-reducing bacteria; sulfur-oxidizing bacteria.


Conflict of interest statement

The authors declare no conflict of interest.

Figures

Fig 1
Fig 1
Overview of study sites and metagenomic workflow. Rhizosphere sediment samples were collected in Alabama under J. roemerianus (ALJR) and S. alterniflorus (ALSA) and in Massachusetts under S. alterniflorus (MASA) and S. pumilus (MASP). Twenty-four metagenomes yielded 38 MAGs for S-cycling bacteria (17 SRB and 21 SOX). Ubiquitous lineages were used to investigate genomic diversity.
Fig 2
Fig 2
Core sulfur-cycling genes detected in MAGs from Alabama and Massachusetts salt marsh samples. Key genes encoded dissimilatory sulfate reduction (yellow) and sulfur oxidation (purple). MAGs are organized by their GTDB-tk taxonomy, and named by site (AL or MA), vegetation, and bin identification number. Multiple copy genes are given as numbers.aprAB, adenylylsulfate reductase, subunit A/B; dsrAB, dissimilatory sulfite reductase alpha/beta subunit; fccA, cytochrome subunit of sulfide dehydrogenase; fccB, sulfide dehydrogenase [flavocytochrome c] flavoprotein chain; sat, sulfate adenylyltransferase; sqr, sulfide:quinone oxidoreductase; soxAX, L-cysteine S-thiosulfotransferase; soxY, sulfur-oxidizing protein; soxB, S-sulfosulfanyl-L-cysteine sulfohydrolase; soxC, sulfane dehydrogenase subunit; soxD, S-disulfanyl-L-cysteine oxidoreductase; soeABC, sulfite dehydrogenase (quinone) subunit; hdrA2B2C2B1C1, heterodisulfide reductase subunit A2/B2/C2/B1/C1.
Fig 3
Fig 3
Maximum likelihood phylogenetic trees of sulfate-reducing (left) and sulfur-oxidizing (right) MAGs from Alabama and Massachusetts salt marshes, and their closest relatives, based on analysis of single-copy genes. Phyla are shown on the left of each tree.
Fig 4
Fig 4
Distribution of sulfur-cycling primary MAG sequences across sites and vegetation zones. (A) MAG abundance estimates across AL and MA samples, with coverage values standardized by library size and contig length and expressed as genome copies per million reads (GCPM). Arrows indicate the MAGs used for pangenomic analyses. (B–D) Non-metric multidimensional scaling (NMDS) analyses comparing MAGs distribution as expressed as GCPM in: (B) Alabama and Massachusetts salt marshes, (C) Massachusetts salt marshes by month, and (D) Alabama salt marshes by depth.
Fig 5
Fig 5
(A) Anvi’o coverage profiles of eight selected sulfur-cycling bacteria MAGs. Outer circles represent the contig coverage (as mean coverage) of each of the 24 salt-marsh metagenomic samples included in this analysis. Inner rings represent GC content (dark gray) and contig length (gray). Contigs are clustered (inner tree) based on the sequence composition and differential coverage using Euclidean distance and Ward hierarchical clustering method. Sample order (rings) was determined using a clustering method based on the mean coverage and each ring is color-coded according to site and vegetation type. Bar plots represent (top to bottom) the total number of reads in each library, the total number of reads mapped to each respective MAG, the percentage of mapped reads, and the total number of single-nucleotide variants (SNVs). (B) Anvi’o pangenomic analysis of eight sulfur-cycling bacteria MAGs. In each ring, each radial line represents a gene. Gene order was determined using Euclidean distance and Ward clustering method based on presence/absence of a gene cluster across MAGs. Annotation based on COG 2020 is indicated in gray and single-copy core genes in purple. Primary MAG is shown in dark teal blue. Each of the remaining circles represents a reference-guided reassembled MAG from each of the salt-mash metagenomic samples included in this analysis. Samples are color-coded according to geographical site and vegetation.
Fig 7
Fig 7
Biogeographic and vegetation-specific distributions of genomic variability. (A) Example aggregated view of metagenomic reads from different samples mapped to the MAG ALJR15. Samples collected in Alabama matched the reference while those collected in Massachusetts in sediments dominated by S. pumilus displayed numerous fixed mismatches. Mismatches are indicated with colors: green, T; yellow, G; blue, C; red, A. (B) Trees depicting phylogenetic relationships among reassembled sample-specific metagenomes. Trees were built using single-copy genes, housekeeping genes, and sulfur-cycling genes. Tree branches are color-coded according to site and vegetation.
Fig 6
Fig 6
Comparative analysis of genomic and metabolic diversity of two closely related sulfur-oxidizing MAGs (Thiohalomonadales) (A) Distribution of genetic variability represented as SNV per kilobase (black bars) and calculated for each metagenomic sample. Hotspots of variability include COG5361 (Mobilome), COG1850 (Rubisco-like protein), COG0457 [Tetratricopeptide (TPR) repeat], and rRNA. (B) Diagram of sulfur metabolism pathways highlighting the differences in gene content between sample-specific MAGs from the ALJ36 and MASA10 primary MAG groups (adapted from Kegg map00920). (C) Pangenomic analysis of metagenomes from group ALJR36 and MASA10. Primary MAGs are indicated by the dark ring and sample-specific reassembled MAGs are color-coded by site and vegetation. Genes clusters are ordered with forced synteny to ALJR36 to highlight the genes exclusively found in the MASA10 group. Annotations, single-copy core genes, and the combined homogeneity index are shown in outer rings.
Fig 8
Fig 8
(A) Structure of an example DGR identified in MASP22. Diversification of this DGR in this metagenomic sample is indicated by the accumulation of in-frame mutations in the variable region (VR) among the aligned reads. The template region (TR) is conserved both at the nucleotide and amino acid levels. In the bar graphs, the bar size is proportional to the degree of conservation of the nucleotide position. Adenine positions in the VR and TR regions are indicated in red. In the recruited reads, identical residues are indicated with dots, and changes are color coded. (B) Structure and domain composition of the target genes containing variable regions (in purple) of the DGRs.

References

    1. Wu B, Liu F, Fang W, Yang T, Chen G-H, He Z, Wang S. 2021. Microbial sulfur metabolism and environmental implications. Sci Total Environ 778:146085. doi: 10.1016/j.scitotenv.2021.146085 - DOI - PubMed
    1. Anantharaman K, Hausmann B, Jungbluth SP, Kantor RS, Lavy A, Warren LA, Rappé MS, Pester M, Loy A, Thomas BC, Banfield JF. 2018. Expanded diversity of microbial groups that shape the dissimilatory sulfur cycle. 7. ISME J 12:1715–1728. doi: 10.1038/s41396-018-0078-0 - DOI - PMC - PubMed
    1. Lee RW, Kraus DW, Doeller JE. 1999. Oxidation of sulfide by Spartina alterniflora roots. Limnol Oceanogr 44:1155–1159. doi: 10.4319/lo.1999.44.4.1155 - DOI
    1. Lamers LPM, Govers LL, Janssen ICJM, Geurts JJM, Van der Welle MEW, Van Katwijk MM, Van der Heide T, Roelofs JGM, Smolders AJP. 2013. Sulfide as a soil phytotoxin—a review. Front Plant Sci 4:268. doi: 10.3389/fpls.2013.00268 - DOI - PMC - PubMed
    1. Zhang P, Luo Q, Wang R, Xu J. 2017. Hydrogen sulfide toxicity inhibits primary root growth through the ROS-NO pathway. Sci Rep 7:868. doi: 10.1038/s41598-017-01046-2 - DOI - PMC - PubMed

Publication types

LinkOut - more resources