. 2023 Nov 29;89(11):e0102723.
doi: 10.1128/aem.01027-23. Epub 2023 Oct 26.

Biofilm formation and cell plasticity drive diazotrophy in an anoxygenic phototrophic bacterium

Affiliations

Biofilm formation and cell plasticity drive diazotrophy in an anoxygenic phototrophic bacterium

Víctor Fernández-Juárez et al. Appl Environ Microbiol. .

Abstract

The contribution of non-cyanobacterial diazotrophs (NCDs) to total N2 fixation in the marine water column is unknown, but their importance is likely constrained by the limited availability of dissolved organic matter and low O2 conditions. Light could support N2 fixation and growth by NCDs, yet no examples from bacterioplankton exist. In this study, we show that the phototrophic NCD, Rhodopseudomonas sp. BAL398, which is a member of the diazotrophic community in the surface waters of the Baltic Sea, can utilize light. Our study highlights the significance of biofilm formation for utilizing light and fixing N2 under oxic conditions and the role of cell plasticity in regulating these processes. Our findings have implications for the general understanding of the ecology and importance of NCDs in marine waters.

Keywords: Baltic Sea; N2 fixation; biofilm; light; nutrients; oxygen (O2); purple non-sulfur bacteria (PNSB); water column.


Conflict of interest statement

The authors declare no conflict of interest.

Figures

Fig 1
Fig 1
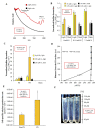
Effects of light and O2 on growth and N2 fixation in BAL398 under varying carbon (C) and nitrogen (N). (A) Growth rates (µ) and duplication times (Tg) under different light, O2, and N conditions. In red, the growth rate under aerobic conditions. (B) Cell abundance under different photon irradiance (from 0 to 250 µmol photons m−2 s−1) at N2 fixing (0.15 mM N) and anoxic conditions. (C) Growth under varying O2 levels (0, 100, and 250 O2 µM) at 35 mM C. (D) N2 fixation rates under different O2 concentrations and light conditions. (E) Cell abundance. (F) N2 fixation under different light, O2, C (0. 0.35, and/or 35 mM), and N availability (0, 0.15, and/or 7.5 mM). Note that in (F), N2 fixation was not measured at C = 0 mM and N = 0 mM. The values represent the mean, and the error bars indicate the standard error between the replicates (n = 3). Different letters indicate pairwise analysis among variables (P < 0.05), using a post hoc test (Wilcoxon) after Kruskal-Wallis over the whole data set. Plots (A−F) are from independent experiments. In (A), data points were recorded every day during 10 d, and in (B−F), values were measured after 7 d. For more detailed information about the conditions tested, please refer to Table 1, Section 1.
Fig 2
Fig 2
Nitrogenase content in BAL398 under different environmental conditions. (A) Effect of O2 concentration (0 and 250 µM O2). (B) Impact of N concentration (0, 0.15, and 7.5 mM) and light availability on the nitrogenase content of BAL398. In panels (A and B) BAL398 cells were cultured under high C concentration (35 mM). In panel (A) BAL398 cells were harvested under light and N2-fixing conditions. The values represent the mean, and the error bars indicate the standard error between the replicates (n = 3). Different letters indicate pairwise analysis among the variables (P < 0.05), using a post hoc test (Wilcoxon) after Kruskal-Wallis over the entire data set. A.U is defined as arbitrary units. (A and B) are from independent experiments, and values were measured after 7 d. For more detailed information about the conditions tested, please refer to Table 1, Section 1.
Fig 3
Fig 3
Biofilm formation on different hydrophobic surfaces under varying environmental conditions. (A) In vivo absorption spectrum of BAL398 under anoxic and oxic conditions. (B) Normalized biofilm formation on polystyrene (PS) well plates at different light and nutrient regimes, under anoxic conditions. (C) Normalized biofilm formation measured on different surfaces, i.e., polyethylene (PE), polystyrene, and glass, under different light and O2 availability. (D) O2 profile onto the PS surface with and without cells. (E) N2 fixation rates of BAL398 cells growing in media with PS under light and oxic conditions. Controls without PS were added. (F) Motility assay of BAL398 under standard conditions. Cells were inoculated with an inoculation loop from the bottom to the top of the tube. Positive motility was considered when cells diffused in the agar. In panels (C, D, and E) experiments were carried out under N2-fixing conditions, i.e., 35 mM C and 0.15 mM N. The values represent the mean, and the error bars indicate the standard error between the replicates (n = 3). Different letters indicate pairwise analysis among the variables (P < 0.05), using a post hoc test (Wilcoxon) after Kruskal-Wallis over the entire data set. In (C) asterisks indicate pairwise differences between the PS and PE. All plots (A–F) are from independent experiments and were measured after 7 d. For more detailed information about the conditions tested, please refer to Table 1, Section 2.
Fig 4
Fig 4
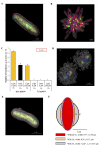
Cell attachment and rosette-like structures of BAL398 on polystyrene under (A) oxic and (B) anoxic and N2-fixing and light conditions, using an epifluorescence microscope under 100× magnification. (C) Number of rosettes per square millimeter on PS depending on the light and O2 availability. White arrows indicate the rosette-like structures. Different letters indicate pairwise analysis among the variables (P < 0.05), using a post hoc test (Wilcoxon) after Kruskal-Wallis over the entire data set. In (A through C) variables were measured after 3 d. For more detailed information about the conditions tested, please refer to Table 1, Section 2.
Fig 5
Fig 5
Effect of light, O2, and nutrients on cell structure and bacterial capsule in BAL398 under N2-fixing conditions. (A) A rod-shaped BAL398 cell under anoxic conditions. (B) Rosette-like structures. Note that the green colors represent the nitrogenase detected by the immunolabeling approach. (C) Number of rosettes depending on the light, O2, and N levels. (D) Cyst formation under aerobic and light and nitrogen-fixing conditions. (E) Rod-shaped BAL398 cells under oxic conditions. Note that blue, red, and gray colors represent the inner membrane, outer membrane, and capsule, respectively. The blue color in (D) represents possible large intracellular granules. (F) Length, width, and capsule thickness depending on the light and O2 conditions. In panels (C and F) the values represent the mean, and the error bars indicate the standard error between the replicates (n = 3). Different letters indicate pairwise analysis among the variables (P < 0.05), using a post hoc test (Wilcoxon) after Kruskal-Wallis over the entire data set. Panels (A, B, D, and E) were taken by holotomographic microscopy. Panels (A through F) are from the same experiments, and variables were measured after 7 d. For more detailed information about the conditions tested, please refer to Table 1, Section 3.

References

    1. Zehr JP, Capone DG. 2020. Changing perspectives in marine nitrogen fixation. Science 368:eaay9514. doi:10.1126/science.aay9514 - DOI - PubMed
    1. Sohm JA, Webb EA, Capone DG. 2011. Emerging patterns of marine nitrogen fixation. Nat Rev Microbiol 9:499–508. doi:10.1038/nrmicro2594 - DOI - PubMed
    1. Zehr JP. 2011. Nitrogen fixation by marine cyanobacteria. Trends Microbiol 19:162–173. doi:10.1016/j.tim.2010.12.004 - DOI - PubMed
    1. Zehr JP, Mellon MT, Zani S. 1998. New nitrogen-fixing microorganisms detected in oligotrophic oceans by amplification of nitrogenase (nifH) genes. Appl Environ Microbiol 64:3444–3450. doi:10.1128/AEM.64.12.5067-5067.1998 - DOI - PMC - PubMed
    1. Riemann L, Farnelid H, Steward GF. 2010. Nitrogenase genes in non-cyanobacterial plankton: prevalence, diversity and regulation in marine waters. Aquat Microb Ecol. 61:235–247. doi:10.3354/ame01431 - DOI

Publication types

LinkOut - more resources