. 2024 Jan 2;134(1):e163242.
doi: 10.1172/JCI163242.

Somatic estrogen receptor α mutations that induce dimerization promote receptor activity and breast cancer proliferation

Affiliations

Somatic estrogen receptor α mutations that induce dimerization promote receptor activity and breast cancer proliferation

Seema Irani et al. J Clin Invest. .

Abstract

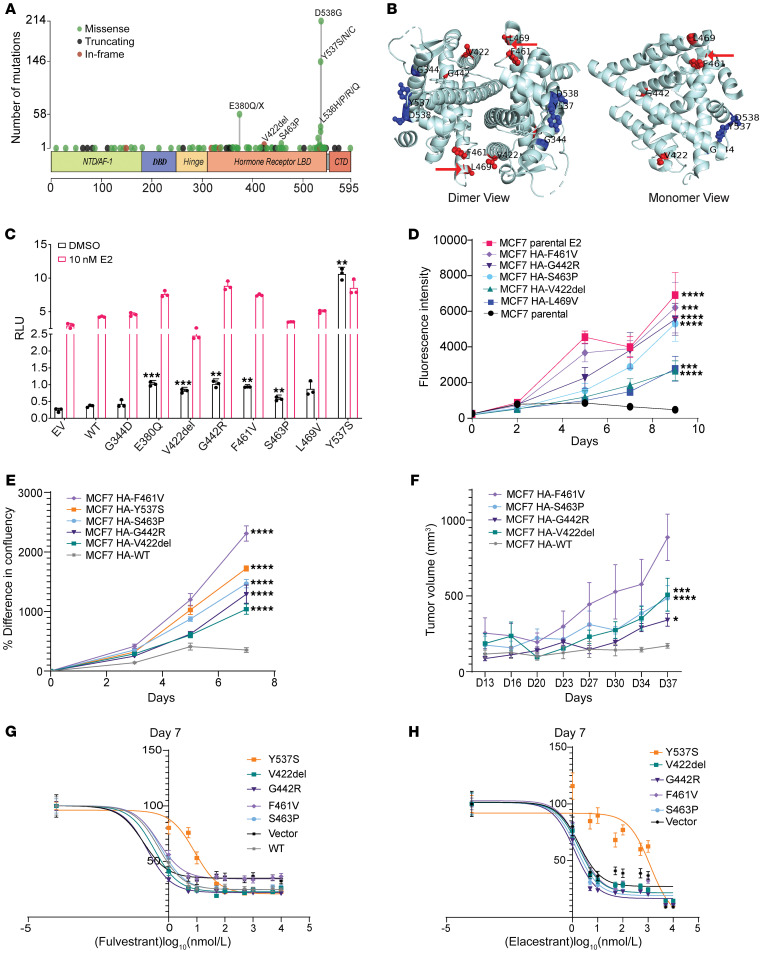
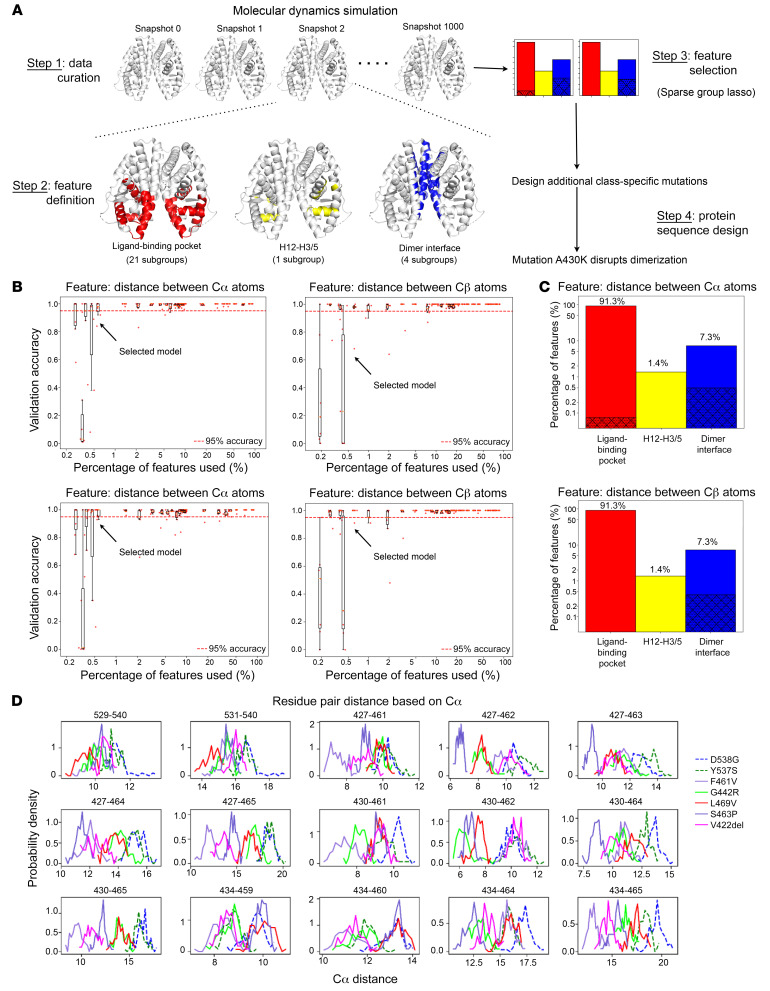
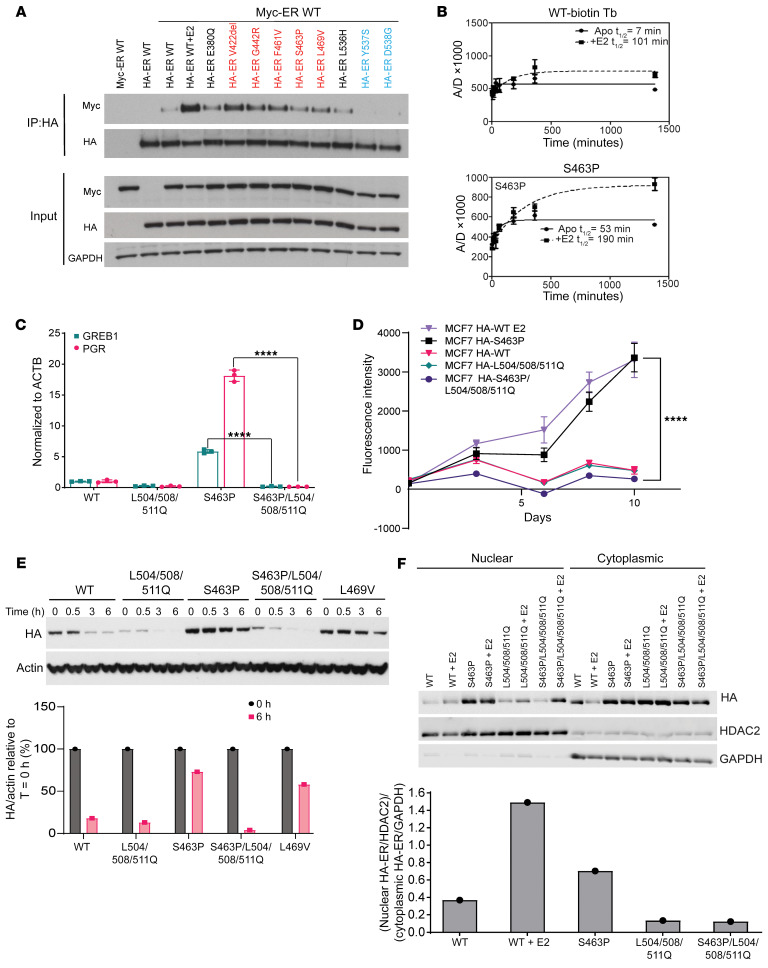
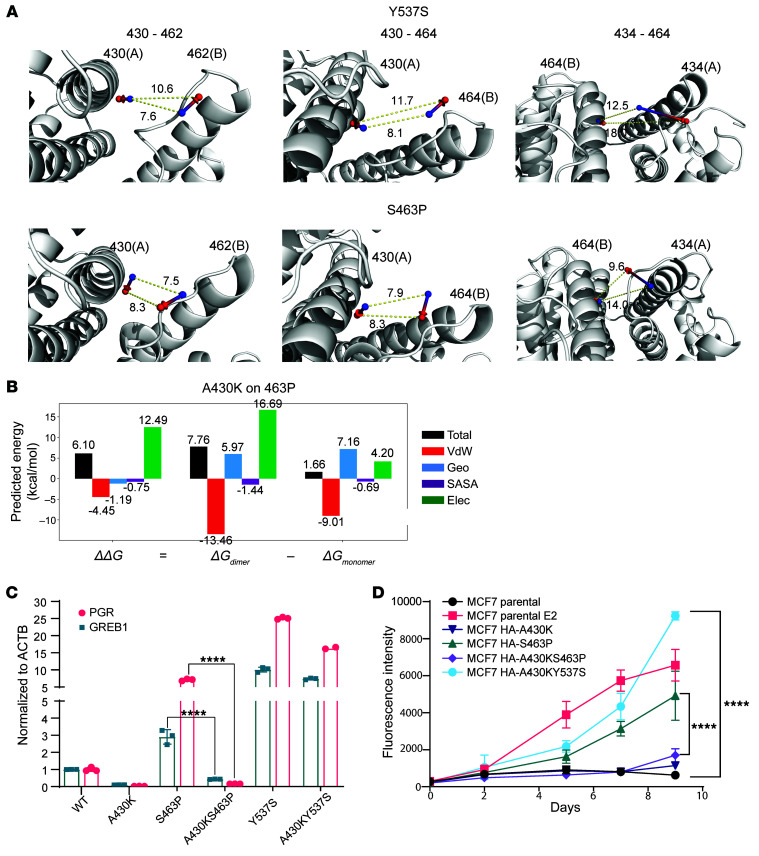
Physiologic activation of estrogen receptor α (ERα) is mediated by estradiol (E2) binding in the ligand-binding pocket of the receptor, repositioning helix 12 (H12) to facilitate binding of coactivator proteins in the unoccupied coactivator binding groove. In breast cancer, activation of ERα is often observed through point mutations that lead to the same H12 repositioning in the absence of E2. Through expanded genetic sequencing of breast cancer patients, we identified a collection of mutations located far from H12 but nonetheless capable of promoting E2-independent transcription and breast cancer cell growth. Using machine learning and computational structure analyses, this set of mutants was inferred to act distinctly from the H12-repositioning mutants and instead was associated with conformational changes across the ERα dimer interface. Through both in vitro and in-cell assays of full-length ERα protein and isolated ligand-binding domain, we found that these mutants promoted ERα dimerization, stability, and nuclear localization. Point mutations that selectively disrupted dimerization abrogated E2-independent transcriptional activity of these dimer-promoting mutants. The results reveal a distinct mechanism for activation of ERα function through enforced receptor dimerization and suggest dimer disruption as a potential therapeutic strategy to treat ER-dependent cancers.

Keywords: Breast cancer; Drug therapy; Endocrinology; Oncology; Sex hormones.


Figures

Figure 1
Figure 1. Activating ESR1 mutations outside helix 12 of the LBD.
(A) ESR1 mutations (n = 649) in breast cancer samples from the MSK clinical sequencing cohort. NTD, N-terminal domain; DBD, DNA-binding domain; LBD, ligand-binding domain; CTD, C-terminal domain. (B) Mapping of a few of the ESR1 mutations onto the structure of the ERα-LBD (Protein Data Bank ID 1GWR). Residues in the vicinity of the dimer interface are shown in red (a red arrow indicates the disordered region having residue S463), and those closer to the H11–H12 loop are shown in blue. (C) Luciferase reporter assay of MCF7 cells transfected with the HA-tagged ESR1 mutants/WT or empty vector (EV), estrogen response element (ERE)–luciferase reporter, and Renilla luciferase reporter plasmids. The graph represents individual data points and mean ± SD (n = 3), with P values (Welch’s t test) for mutant versus WT indicated. (D) Cell viability of doxycycline-inducible (Dox-inducible) MCF7 cells and parental cells with or without 10 nM E2 growing in hormone-depleted medium supplemented with 0.5 μg/mL Dox; plotted as mean ± SD (n = 6), with P values calculated from Welch’s t test for mutant versus parental cells on the final day indicated. (E) Plot of the percentage increase in confluence from initial time point for the Dox-inducible MCF7 cells, growing in hormone-depleted medium with 0.5 μg/mL of Dox. Data are plotted as mean ± SEM (n = 6); statistical analysis was performed using 2-way ANOVA for mutant versus WT on the final day indicated. (F) MCF7 HA-ESR1 WT or mutant–expressing cell-derived xenograft tumor growth represented as mean ± SEM (n = 3–6 mice per group). The estrogen pellet was removed after the tumor volume reached 250 mm3, and mice were fed with Dox to induce HA-tagged ESR1 expression. Statistical analysis was performed using 2-way ANOVA on the final day indicated. F461V had 2 mice after day 16 and hence was not included in statistical analysis. (G and H) Growth inhibition of MCF7 cells expressing HA-ESR1 mutants or empty vector, as measured by cell viability assay, in the presence of fulvestrant (G) and elacestrant (H); EC50 values for sigmoidal fit are presented in Supplemental Tables 2 and 3. *P < 0.05, **P < 0.01, ***P < 0.001, ****P < 0.0001.
Figure 2
Figure 2. Developing machine learning models to simultaneously classify ERα-activating variants and select differential conformational features.
(A) Flowchart representing the methodology adopted to study the differences between the 2 classes of ESR1 mutations. Class I variants include Y537S and D538G, and class II variants include V422del, G442R, F461V, S463P, and L469V. (B) The accuracy versus percentage of features used, for the logistic regression models with sparse group lasso trained on 7 variants’ molecular dynamic trajectories (training set: 300 equi-spaced snapshots at 50–80 nanoseconds for each variant) to classify 7 activating variants into 2 classes, for the validation set (100 snapshots at 80–90 nanoseconds) (top) and the test set (100 snapshots at 90–100 nanoseconds) (bottom). On the left, features refer to the distances between the Cα atoms of respective residues; on the right, features refer to the distances between the Cβ atoms of residues. (C) Bar graphs showing the distribution of features across different regions of the ERα structure. In red are features that describe the geometry of the ligand-binding pocket (averaged over 2 monomers), in yellow are distances between H12 and surrounding H3/H5 (averaged over 2 monomers), and in blue are features that represent the monomer-monomer proximity across the dimer interface. The features selected by machine learning models (having over 95% median accuracy in classifying the variants) are shown as shadowed portions. On the top, features refer to the distances between the Cα atoms of respective residues; on the bottom, features refer to the distances between the Cβ atoms of residues. (D) Distributions of machine learning–selected pairwise Cα distances for 7 variants in class I (dashed line) and class II (solid line).
Figure 3
Figure 3. A distinct class of mutants that relies on dimerization for hormone-independent activity.
(A) Immunoprecipitation of HA-ER WT/mutant from MCF7 cell lysate after cotransfection with plasmids containing MYC-ESR1 WT and HA-ESR1 WT/mutant. Class II mutants are shown in red, class I mutants in blue; 10 nM E2 was added wherever indicated. (B) Stability of WT ERα and S463P ERα LBD dimers evaluated by measurement of tr-FRET assay signal from dimer exchange of terbium-labeled ERα LBD at C417 and fluorescein-labeled ERα LBD at C530. The solid line indicates signal from the apo form of protein, and the dotted line indicates signal from protein exposed to 1 μM E2 for 30 minutes before dimer exchange. A/D, Acceptor emission/Donor emission. (C) Quantitative reverse transcription PCR (RT-qPCR) of GREB1 and PGR transcripts after growing of SKBR3 cells transiently transfected with HA-ESR1 WT or mutant plasmids in hormone-depleted medium. Bar graph/data points represent fold change relative to WT; error bars represent SD (n = 3 qPCR reactions); statistical analysis performed using 1-way ANOVA. (D) Cell viability of Dox-inducible HA-ER mutant/WT–expressing MCF7 cells growing in hormone-depleted medium with Dox; 10 nM E2 was added wherever indicated. Data are plotted as mean ± SD (n = 6); statistical analysis performed using 2-way ANOVA for the final day indicated. (E) Top: Immunoblotting of the HA-tagged ERα variants and actin levels from MCF7 cells growing in hormone-depleted medium, transiently transfected with the respective HA-ESR1 mutant plasmids, and exposed to HSP90 inhibitor SNX2112 at 500 nM concentration for indicated periods of time. Bottom: Signal quantification showing the ratio of HA to actin signal for T = 0 hours and T = 6 hours; signal ratio at T = 0 hours for each variant has been scaled to 100%. (F) Top: Immunoblotting of HA-tagged ERα variants in nuclear and cytoplasmic fractions of transiently transfected MCF7 cells that had been grown in hormone-depleted medium supplemented with 10 nM E2 whenever indicated. Bottom: Signal quantification showing relative enrichment of HA-ERα variants in the nucleus for samples in hormone-depleted medium. All densitometric analysis was performed on Image Studio Lite software. ****P < 0.0001.
Figure 4
Figure 4. Selective disruption of enhanced dimerization impairs function.
(A) Dynamics visualization of differential inter-residue Cβ distances selected by the activating-variant classifier (3 representatives: 430-462, 430-464, and 434-464). Arrow from blue to red spheres indicates the dislocation of corresponding Cβ atoms from 0 nanoseconds to 100 nanoseconds. (B) The secondary mutation of A430K to S463P was suggested by the multistate protein design method interconnected cost function networks (iCFN) to electrostatically weaken dimerization compared with S463P. The energy is decomposed into Van der Waals (VdW), geometric (Geo), solvent-accessible surface area (SASA), and electrostatics (Elec). (C) RT-qPCR demonstrating transcriptional activation of PGR and GREB1 genes in SKBR3 cells transfected with HA-ESR1 WT/mutant plasmids, grown in hormone-depleted medium for 48 hours. Bar graph represents fold change relative to WT, and error bars represent SD (n = 3 qPCR reactions); statistical analysis performed using 1-way ANOVA. (D) Cell viability assay of Dox-inducible MCF7 Tet-On stable cell lines expressing HA-tagged ER mutants, grown in hormone-depleted medium and supplemented with 0.5 μg/mL Dox. MCF7 Tet-On parental cell lines supplemented with 0.5 μg/mL Dox or 0.5 μg/mL Dox and 10 nM E2 are also included as controls. Data are plotted as mean ± SD (n = 6); statistical analysis performed using 2-way ANOVA for the final day indicated. ****P < 0.0001.

Similar articles

Cited by

References

    1. Rusidzé M, et al. Estrogen receptor-α signaling in post-natal mammary development and breast cancers. Cell Mol Life Sci. 2021;78(15):5681–5705. doi: 10.1007/s00018-021-03860-4. - DOI - PMC - PubMed
    1. Saha S, et al. Steroid hormone receptors: links with cell cycle machinery and breast cancer progression. Front Oncol. 2021;11:620214. doi: 10.3389/fonc.2021.620214. - DOI - PMC - PubMed
    1. Yaşar P, et al. Molecular mechanism of estrogen-estrogen receptor signaling. Reprod Med Biol. 2016;16(1):4–20. doi: 10.1002/rmb2.12006. - DOI - PMC - PubMed
    1. Manavathi B, et al. Estrogen receptor coregulators and pioneer factors: the orchestrators of mammary gland cell fate and development. Front Cell Dev Biol. 2014;2:34. doi: 10.3389/fcell.2014.00034. - DOI - PMC - PubMed
    1. Heldring N, et al. Estrogen receptors: how do they signal and what are their targets. Physiol Rev. 2007;87(3):905–931. doi: 10.1152/physrev.00026.2006. - DOI - PubMed

Publication types