. 2023 Oct 26;21(10):e3002354.
doi: 10.1371/journal.pbio.3002354. eCollection 2023 Oct.

Histone methyltransferase activity affects metabolism in human cells independently of transcriptional regulation

Affiliations

Histone methyltransferase activity affects metabolism in human cells independently of transcriptional regulation

Marcos Francisco Perez et al. PLoS Biol. .

Abstract

The N-terminal tails of eukaryotic histones are frequently posttranslationally modified. The role of these modifications in transcriptional regulation is well-documented. However, the extent to which the enzymatic processes of histone posttranslational modification might affect metabolic regulation is less clear. Here, we investigated how histone methylation might affect metabolism using metabolomics, proteomics, and RNA-seq data from cancer cell lines, primary tumour samples and healthy tissue samples. In cancer, the expression of histone methyltransferases (HMTs) was inversely correlated to the activity of NNMT, an enzyme previously characterised as a methyl sink that disposes of excess methyl groups carried by the universal methyl donor S-adenosyl methionine (SAM or AdoMet). In healthy tissues, histone methylation was inversely correlated to the levels of an alternative methyl sink, PEMT. These associations affected the levels of multiple histone marks on chromatin genome-wide but had no detectable impact on transcriptional regulation. We show that HMTs with a variety of different associations to transcription are co-regulated by the Retinoblastoma (Rb) tumour suppressor in human cells. Rb-mutant cancers show increased total HMT activity and down-regulation of NNMT. Together, our results suggest that the total activity of HMTs affects SAM metabolism, independent of transcriptional regulation.


Conflict of interest statement

The authors have declared that no competing interests exist.

Figures
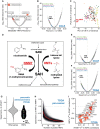
Fig 1
Fig 1. Total HMT expression is strongly anticorrelated with the activity of NNMT in cancers.
(A) Volcano plot showing Pearson’s correlation and FDR for 225 metabolites to total HMT expression (total RNA-seq median of ratios-normalised pseudocounts) across 927 cancer cell lines from the CCLE. (B) Volcano plot showing Pearson’s correlation and FDR for expression of 10,275 expressed genes to levels of 1MNA across 927 CCLE cancer cell lines. The top and bottom 2.5% of points are shown in darker grey. HMT-encoding genes are shown as points coloured according to their association with transcriptional activation (green), repression (magenta), or an unclear relationship (blue). Pearson’s r for total HMT expression is shown as a black point. (C) PCA of metabolite levels across 927 cancer cell lines from the CCLE. 1MNA is highlighted with a red circle. (D) NNMT and HMTs both convert SAM to SAH and so can affect cellular methylation potential by acting as a “sink.” (E) Volcano plot showing Spearman’s correlation and FDR for expression of NNMT vs. 52,440 genes in a pan-cancer analysis of 927 CCLE cell lines across 23 cancer types. HMT-encoding genes are shown as points as in panel 1B. (F) Volcano plot showing Spearman’s correlation and FDR for expression of NNMT vs. 60,489 genes in a pan-cancer analysis of TCGA primary tumours across 33 cancer types. HMT-encoding genes are shown as points as in panel 1B. (G) Violin plot showing Spearman’s correlation to NNMT for HMTs (black, right) or other genes (left, grey) in 79 primary ACC tumours from the TCGA. Individual HMT-encoding genes are shown as points as in panel 1B. (H) Spearman’s correlation vs. NNMT expression of total expression of pooled HMTs added to the pool in a random order, and 1,000 individual iterations are shown as black lines, with the locally estimated smoothing (Loess fit) trendline shown in red. (I) TCGA pan-cancer analysis showing rank percentile position of total HMTs among correlations of NNMT expression to 60,489 genes and vice versa in 33 distinct cancer types. Bubble size is inversely proportional to the log of the “relative reciprocal score,” the sum of squares of the ranks of total HMTs/NNMT in the reciprocal distribution. The dashed grey box indicates correlations in the strongest 2.5% of anticorrelated genes. Underlying data for all panels can be found in https://zenodo.org/record/8383542. 1MNA, 1-methylnicotinamide; ACC, adrenocortical carcinoma; CCLE, Cancer Cell Line Encyclopedia; FDR, false discovery rate; HMT, histone methyltransferase; NNMT, nicotinamide N-methyltransferase; SAH, S-adenosyl homocysteine; SAM, S-adenosyl methionine; TCGA, The Cancer Genome Atlas.
Fig 2
Fig 2. Total HMT expression is strongly anticorrelated with the expression of PEMT in healthy tissues.
(A) Analysis showing rank percentile position of total HMTs among correlations of NNMT expression to 56,200 genes and vice versa in 48 distinct healthy tissue types from the GTEx project. Bubble size is inversely proportional to the log of the “relative reciprocal score,” the sum of squares of the ranks of total HMTs/NNMT in the reciprocal distribution (see Methods). The dashed grey box indicates correlations in the strongest 2.5% of anticorrelated genes, with tissues labelled. (B) Volcano plot showing Spearman’s correlation and FDR for expression of NNMT vs. 56,200 genes in a pan-cancer analysis of GTEx primary tumours across 48 tissue types. HMT-encoding genes are shown as points coloured according to association with transcriptional regulation; correlation for total HMT expression is shown as a black point. (C) Analysis showing rank percentile position of total HMTs among correlations of PEMT expression and vice versa in healthy tissue types from the GTEx project. Bubble size and dashed grey box as in panel 2A. (D) Volcano plot showing Spearman’s correlation and FDR for expression of PEMT vs. 56,200 genes in a cross-tissue analysis of 18 tissue types with a strong HMT-PEMT relationship (within the grey box in panel 2C). HMT-encoding genes are shown as points as in panel 2B. (E) Violin plot showing Spearman’s correlation to PEMT of HMTs (black, right) or other genes (left, grey) in 375 patient samples from the gastroesophageal junction. HMT-encoding genes are shown as points as in panel 2B. (F) Spearman’s correlation vs. PEMT expression of total expression of pooled HMTs added to the pool in a random order in a cross-tissue analysis of tissues with a strong HMT-PEMT relationship (within the grey box in panel 2C); 1,000 individual iterations are shown as black lines, with Loess fit trendline in red. (G) Analysis showing rank percentile position of total HMTs among correlations of PEMT expression to 60,489 genes and vice versa in 33 cancer types from the TCGA. Bubble size and dashed grey box as in panel 2A. (H) PEMT sequentially methylates phosphoethanolamine to produce PC, converting 3 molecules of SAM to SAH. (I) Analysis showing rank percentile position of HMTs classified by their substrate histone lysine residues among correlations of NNMT expression and vice versa in cancer types from the TCGA. Bubble size and dashed grey box as in panel 2A. (J) Analysis showing rank percentile position of HMT sets methylating distinct histone lysine residues among correlations of PEMT expression to 56,200 genes and vice versa in a pan-tissue analysis of 18 tissue types from the GTEx with a strong HMT-PEMT relationship (within the grey box in panel 2C). Bubble size and dashed grey box as in panel 2A. (K) Analysis showing rank percentile position of HMT sets methylating distinct histone lysine residues among correlations of PEMT expression and vice versa in a pan-cancer analysis of 7 cancer types from the TCGA with a strong HMT-PEMT relationship (within the grey box in panel 2G). Bubble size and dashed grey box as in panel 2J. (L) Violin plot showing healthy tissue sample PI, a measure of proliferation inferred from sample RNA-seq gene expression data, for 48 tissue types of the GTEx arranged by the strength of the anticorrelating relationship between PEMT and total HMTs. Note the x axis is inverted as a lower relative reciprocal score indicates a stronger relationship. (M) Violin plot showing tumour PI for 31 cancer types of the TCGA arranged by the strength of the anticorrelating relationship between NNMT and total HMTs. Underlying data for all panels can be found in https://zenodo.org/record/8383542. FDR, false discovery rate; GTEx, Genotype-Tissue Expression; HMT, histone methyltransferase; NNMT, nicotinamide N-methyltransferase; PC, phosphatidylcholine; PI, proliferative index; SAH, S-adenosyl homocysteine; SAM, S-adenosyl methionine; TCGA, The Cancer Genome Atlas.
Fig 3
Fig 3. PEMT and NNMT expression anticorrelate globally with levels of specific histone marks genome-wide in healthy tissues and cancers, respectively.
(A) Boxplot shows t-values from linear mixed effects model for sample PEMT expression predicting ChIP-seq signal for various histone marks (label left) on gene bodies, promoters or repetitive elements (subpanel headers) in patient tissue samples collected as part of the ENCODE project. The number of individual sites is noted on the plot for each boxplot; p-values derive from paired Wilcoxon tests against a null distribution calculated by the mean t-value at each locus for 1,000 random expressed genes. (B) Heatmap showing H3K4me3 ChIP-seq signal (log2 fold change over input) over 1,000 random genes for 4 samples from the squamous epithelium of the esophagus arranged in order of PEMT expression. (C) Boxplot shows t-values from generalised linear models for NNMT expression (RNA-seq) predicting ChIP-seq signal for various histone marks (label left) on gene bodies and promoters in cell lines of the NCI60 cancer cell line panel. The number of individual sites is noted on the plot for each boxplot; p-values derive from paired Wilcoxon tests against a null distribution calculated by the mean t-value at each locus for 1,000 random expressed genes. (D) Boxplot shows t-values from generalised linear models for NNMT expression (RNA-seq) predicting ChIP-seq signal for various histone marks (label left) on different classes of repetitive elements in cell lines of the NCI60 cancer cell line panel. The number of individual sites is noted on the plot for each boxplot; p-values derive from paired Wilcoxon tests against a null distribution calculated by the mean t-value at each locus for 1,000 random expressed genes. Sites shown are from bin with highest ChIP signal (cf. S9D Fig). Underlying data for all panels can be found in https://zenodo.org/record/8383542. HERVs, human endogenous retroviruses; LINEs, long interspersed nuclear elements; LTRs, long terminal repeats; NNMT, nicotinamide N-methyltransferase; SINEs, short interspersed nuclear elements.
Fig 4
Fig 4. HMTs are regulated by E2F and Retinoblastoma, with NNMT expression reduced downstream of HMTs in Rb-mutant cancers.
(A) Above: Sequence motif enriched in C. elegans HE cluster HMT promoters, relative to other HMTs promoters. Below: previously reported EFL-2 binding motif. (B) Binding of the C. elegans Retinoblastoma orthologue LIN-35 upstream of the TSS of the HE cluster, other HMT genes, and random genes; p-values from Wilcoxon test. (C) Enrichment for transcription factor binding, from ENCODE ChIP-seq experiments, upstream of human HMT genes. Odds ratios and p-value derived from Fisher’s exact test. (D) Boxplots show median total HMT or NNMT expression percentile drawn from 1,000 iterations of pan-cancer sampling of tumours with wild-type RB1 or potentially deleterious RB1 mutations; p-value derived from t test. (E) Total HMT expression in small cell lung cancer cell lines from the CCLE with wild-type RB1 or deleterious RB1 mutations; p-value derived from t test. (F) Estimated E2F1 activity vs. total HMT expression (both corrected for confounders) in breast cancer primary tumours from the TCGA. (G) Potential architectures of the GRN linking RB1, NNMT, and HMTs. (H) Linear model t-values explaining total HMT and NNMT expression for RB1 mutation status as the sole explanatory variable or jointly considered with NNMT/HMT expression respectively; p-value derived from t test. Underlying data for all panels can be found in https://zenodo.org/record/8383542. CCLE, Cancer Cell Line Encyclopedia; GRN, gene regulatory network; HMT, histone methyltransferase; NNMT, nicotinamide N-methyltransferase; Rb, Retinoblastoma; TCGA, The Cancer Genome Atlas; TSS, transcription start site.

Comment in

References

    1. Kouzarides T. Histone methylation in transcriptional control. Curr Op Genet Dev. 2002;12(2):198–209. doi: 10.1016/s0959-437x(02)00287-3 - DOI - PubMed
    1. Jenuwein T, Allis CD. Translating the histone code. Science. 2001;293(5532):1074–1080. doi: 10.1126/science.1063127 - DOI - PubMed
    1. Berger SL. The complex language of chromatin regulation during transcription. Nature. 2007;447(7143):407–412. doi: 10.1038/nature05915 - DOI - PubMed
    1. Greer EL, Shi Y. Histone methylation: a dynamic mark in health, disease and inheritance. Nat Rev Genet. 2012;13(5):343–357. doi: 10.1038/nrg3173 - DOI - PMC - PubMed
    1. Wagner EJ, Carpenter PB. Understanding the language of Lys36 methylation at histone H3. Nat Rev Mol Cell Biol. 2012;13(2):115–126. doi: 10.1038/nrm3274 - DOI - PMC - PubMed

MeSH terms