

Prediction model for in-hospital mortality in patients at high altitudes with ARDS due to COVID-19
- PMID: 37883460
- PMCID: PMC10602283
- DOI: 10.1371/journal.pone.0293476
Prediction model for in-hospital mortality in patients at high altitudes with ARDS due to COVID-19
Abstract
Introduction: The diagnosis of acute respiratory distress syndrome (ARDS) includes the ratio of pressure arterial oxygen and inspired oxygen fraction (P/F) ≤ 300, which is often adjusted in locations more than 1,000 meters above sea level (masl) due to hypobaric hypoxemia. The main objective of this study was to develop a prediction model for in-hospital mortality among patients with ARDS due to coronavirus disease 2019 (COVID-19) (C-ARDS) at 2,600 masl with easily available variables at patient admission and to compare its discrimination capacity with a second model using the P/F adjusted for this high altitude.
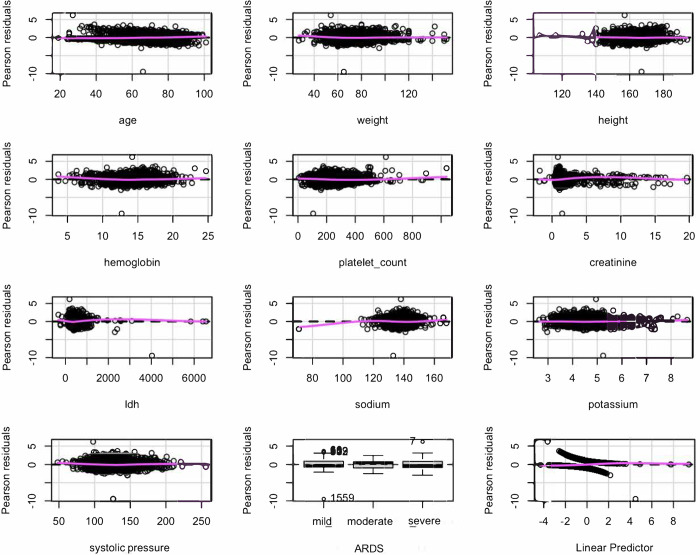
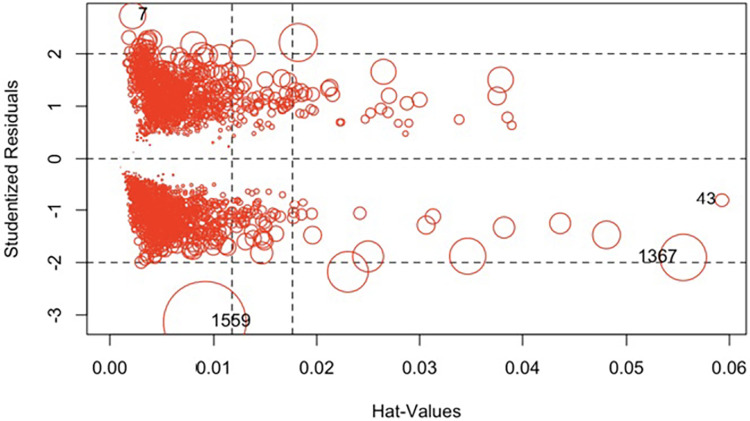
Methods: This study was an analysis of data from patients with C-ARDS treated between March 2020 and July 2021 in a university hospital located in the city of Bogotá, Colombia, at 2,600 masl. Demographic and laboratory data were extracted from electronic records. For the prediction model, univariate analyses were performed to screen variables with p <0.25. Then, these variables were automatically selected with a backward stepwise approach with a significance level of 0.1. The interaction terms and fractional polynomials were also examined in the final model. Multiple imputation procedures and bootstraps were used to obtain the coefficients with the best external validation. In addition, total adjustment of the model and logistic regression diagnostics were performed. The same methodology was used to develop a second model with the P/F adjusted for altitude. Finally, the areas under the curve (AUCs) of the receiver operating characteristic (ROC) curves of the two models were compared.
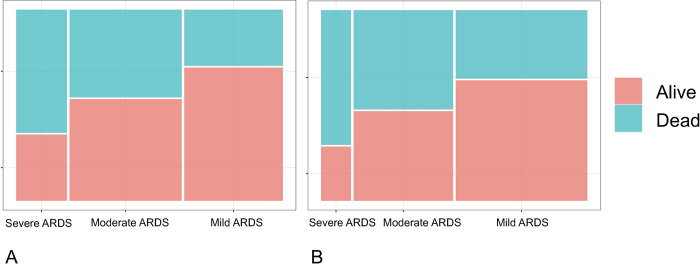
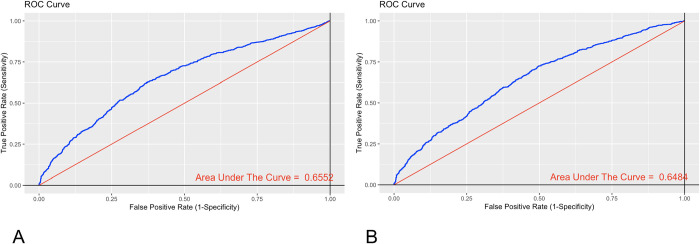
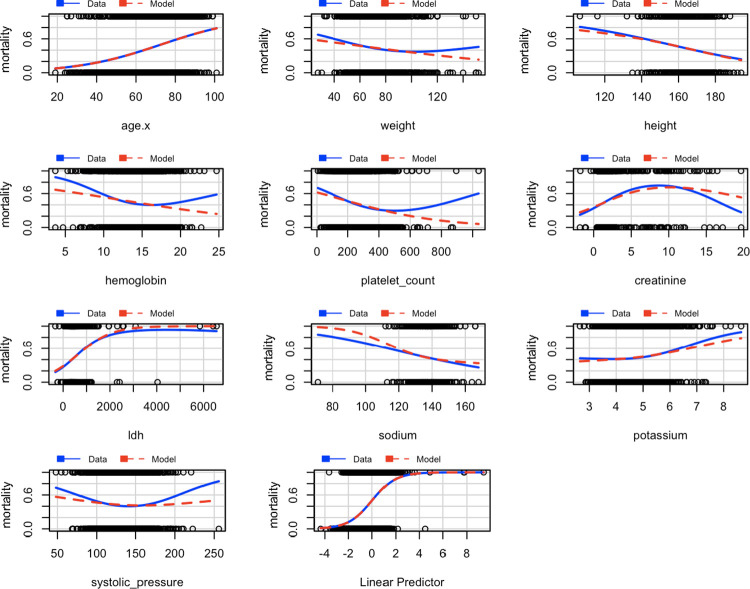
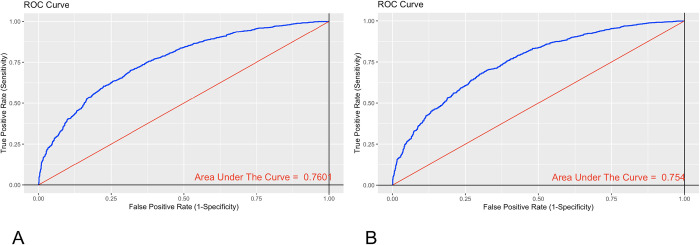
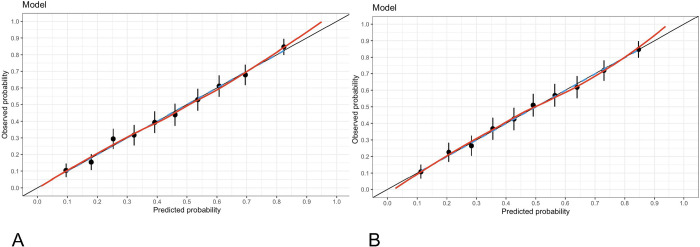
Results: A total of 2,210 subjects were included in the final analysis. The final model included 11 variables without interaction terms or nonlinear functions. The coefficients are presented excluding influential observations. The final equation for the model fit was g(x) = age(0.04819)+weight(0.00653)+height(-0.01856)+haemoglobin(-0.0916)+platelet count(-0.003614)+ creatinine(0.0958)+lactate dehydrogenase(0.001589)+sodium(-0.02298)+potassium(0.1574)+systolic pressure(-0.00308)+if moderate ARDS(0.628)+if severe ARDS(1.379), and the probability of in-hospital death was p (x) = e g (x)/(1+ e g (x)). The AUC of the ROC curve was 0.7601 (95% confidence interval (CI) 0.74-0, 78). The second model with the adjusted P/F presented an AUC of 0.754 (95% CI 0.73-0.77). No statistically significant difference was found between the AUC curves (p value = 0.6795).
Conclusion: This study presents a prediction model for patients with C-ARDS at 2,600 masl with easily available admission variables for early stratification of in-hospital mortality risk. Adjusting the P/F for 2,600 masl did not improve the predictive capacity of the model. We do not recommend adjusting the P/F for altitude.
Copyright: © 2023 Rodriguez Lima et al. This is an open access article distributed under the terms of the Creative Commons Attribution License, which permits unrestricted use, distribution, and reproduction in any medium, provided the original author and source are credited.
Conflict of interest statement
The authors have declared that no competing interests exist.
Figures
Similar articles
-
[Comparison of pulse oxygen saturation/fraction of inhaled oxygen and arterial partial pressure of oxygen/fraction of inhaled oxygen in the assessment of oxygenation in acute respiratory distress syndrome patients at different high altitudes in Yunnan Province].Zhonghua Wei Zhong Bing Ji Jiu Yi Xue. 2021 Jul;33(7):826-831. doi: 10.3760/cma.j.cn121430-20210301-00303. Zhonghua Wei Zhong Bing Ji Jiu Yi Xue. 2021. PMID: 34412752 Chinese.
-
[Feasibility of pulse oxygen saturation for the condition evaluation of acute respiratory distress syndrome patients in the Lijiang region].Zhonghua Wei Zhong Bing Ji Jiu Yi Xue. 2021 Dec;33(12):1447-1452. doi: 10.3760/cma.j.cn121430-20210518-00737. Zhonghua Wei Zhong Bing Ji Jiu Yi Xue. 2021. PMID: 35131011 Chinese.
-
[Establishing prediction model of community-acquired pneumonia complicated with acute respiratory distress syndrome based on artificial neural network].Zhonghua Wei Zhong Bing Ji Jiu Yi Xue. 2022 Apr;34(4):367-372. doi: 10.3760/cma.j.cn121430-20210927-01406. Zhonghua Wei Zhong Bing Ji Jiu Yi Xue. 2022. PMID: 35692200 Chinese.
-
[Analysis of risk factors of acute respiratory distress syndrome secondary to severe multiple trauma].Zhonghua Wei Zhong Bing Ji Jiu Yi Xue. 2021 Mar;33(3):299-304. doi: 10.3760/cma.j.cn121430-20201023-00685. Zhonghua Wei Zhong Bing Ji Jiu Yi Xue. 2021. PMID: 33834970 Chinese.
-
Critical evaluation of established risk prediction models for acute respiratory distress syndrome in adult patients: A systematic review and meta-analysis.J Evid Based Med. 2023 Dec;16(4):465-476. doi: 10.1111/jebm.12565. Epub 2023 Dec 6. J Evid Based Med. 2023. PMID: 38058055
Cited by
-
Early Prediction of Mortality Risk in Acute Respiratory Distress Syndrome: Systematic Review and Meta-Analysis.J Med Internet Res. 2025 May 20;27:e70537. doi: 10.2196/70537. J Med Internet Res. 2025. PMID: 40392588 Free PMC article.
-
Incidence, mortality, and predictive factors associated with acute respiratory distress syndrome in multiple trauma patients living in high-altitude areas: a retrospective study in Shigatse.PeerJ. 2024 Jun 17;12:e17521. doi: 10.7717/peerj.17521. eCollection 2024. PeerJ. 2024. PMID: 38903881 Free PMC article.
-
Adjusting EWS scores for altitude above sea level: is it necessary to predict sepsis mortality in the emergency room?Int J Emerg Med. 2025 Feb 20;18(1):30. doi: 10.1186/s12245-024-00761-8. Int J Emerg Med. 2025. PMID: 39979821 Free PMC article.
References
-
- Acute Respiratory Distress Syndrome: The Berlin Definition. JAMA [Internet]. 2012. Jun 20 [cited 2023 Jul 26];307(23). Available from: http://jama.jamanetwork.com/article.aspx?doi=10.1001/jama.2012.5669 - PubMed
-
- Avellanas Chavala ML. Un viaje entre la hipoxia de la gran altitud y la hipoxia del enfermo crítico: ¿qué puede enseñarnos en la compresión y manejo de las enfermedades críticas? Med Intensiva. 2018. Aug;42(6):380–90. - PubMed
-
- Penaloza D. Efectos de la exposición a grandes alturas en la circulación pulmonar. Rev Esp Cardiol. 2012. Dec;65(12):1075–8. - PubMed
MeSH terms
Substances
LinkOut - more resources
Full Text Sources
Medical
