. 2024 May 4;33(10):837-849.
doi: 10.1093/hmg/ddad182.

Identification of conserved skeletal enhancers associated with craniosynostosis risk genes

Affiliations

Identification of conserved skeletal enhancers associated with craniosynostosis risk genes

Xuan Anita He 何璇 et al. Hum Mol Genet. .

Abstract

Craniosynostosis, defined by premature fusion of one or multiple cranial sutures, is a common congenital defect affecting more than 1/2000 infants and results in restricted brain expansion. Single gene mutations account for 15%-20% of cases, largely as part of a syndrome, but the majority are nonsyndromic with complex underlying genetics. We hypothesized that the two noncoding genomic regions identified by a GWAS for craniosynostosis contain distal regulatory elements for the risk genes BMPER and BMP2. To identify such regulatory elements, we surveyed conserved noncoding sequences from both risk loci for enhancer activity in transgenic Danio rerio. We identified enhancers from both regions that direct expression to skeletal tissues, consistent with the endogenous expression of bmper and bmp2. For each locus, we also found a skeletal enhancer that also contains a sequence variant associated with craniosynostosis risk. We examined the activity of each enhancer during craniofacial development and found that the BMPER-associated enhancer is active in the restricted region of cartilage closely associated with frontal bone initiation. The same enhancer is active in mouse skeletal tissues, demonstrating evolutionarily conserved activity. Using enhanced yeast one-hybrid assays, we identified transcription factors that bind each enhancer and observed differential binding between alleles, implicating multiple signaling pathways. Our findings help unveil the genetic mechanism of the two craniosynostosis risk loci. More broadly, our combined in vivo approach is applicable to many complex genetic diseases to build a link between association studies and specific genetic mechanisms.

Keywords: BMP signaling; conserved regulatory elements; craniosynostosis; enhanced yeast one-hybrid assay; zebrafish transgenesis.


Figures

Figure 1
Figure 1
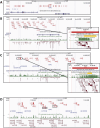
Selection of putative enhancers for in vivo testing. All panels are views from the UCSC genome browser, human genome assembly hg38; included are custom tracks indicating conserved sequences cloned for transgenesis (CNSs) and the SNPs linked to CS risk and confirmed after retesting (SNPs). (A) Overview of the region encompassing BBS9 and BMPER, indicating all the tested sequences. (B) The region encompassing BMPER, indicating the 32 tested sequences; the inset is a closer view of −117BMPER. (C) The risk locus within BBS9 [4], showing the 19 tested sequences; the inset is a closer view of −707BMPER. In B and C, the two lower tracks show two measures of multispecies conservation PhastCons and conserved elements, the primary criteria used to select sequences. The insets also include the track with predictions of regulatory elements from ENCODE data. (D) A similar view of the region downstream of BMP2 (gene is not included in the browser window), indicating the 18 tested sequences and the SNPs associated with CS risk. Boxed sequences are those that tested positive for skeletal-specific enhancer activities in zebrafish transgenesis assay, +402BMP2 and +421BMP2.
Figure 2
Figure 2
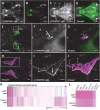
−117BMPER directs egfp expression to developing craniofacial bones and cartilage in zebrafish. (A, B) Ventral view of 5dpf zebrafish mosaic for −117BMPER. (A) Enhancer is active in early chondrocytes and osteoblasts, shown by egfp expression. (B) Overlap is shown with osteoblast marker sp7: mcherry. (C–D) Ventral view of 5dpf stable transgenic Tg (−117BMPER: egfp; sp7: mcherry) zebrafish. Enhancer is broadly active in craniofacial bones and cartilage. (E–G) compressed Z-stacks from confocal imaging of a transgenic Tg (−117BMPER: egfp; sp7: mcherry) animal at 5.2 mm SL (19dpf). Enhancer activity is prominent at the osteogenic front of the developing frontal bone (arrow). (H–J) Dorsal view of enhancer activity in the same transgenic animal at 6.62 mm SL (26dpf); each image is a maximum intensity projection of confocal slices. Enhancer is active in early differentiated osteoblasts, arrow points to the osteogenic front and the direction of growth. (K and L) Single cell RNAseq was performed on cells isolated from transgenic zebrafish skulls at 2 and 3 weeks. The enhancer, indicated by egfp expression, reflects the part of bmper expression that is in osteoblast precursor cells. (K) Heatmap of genes (in columns) that are distinguishingly expressed in egfp + (first row) and bmper expressing osteoblasts (second row). The quantification represents the Log2 fold changes in expression of each gene in each column relative to the entire dataset. (L) Significantly upregulated genes based on adjusted P-value (P < 0.05), in either egfp + cells or bmper + cells, boxed in (K). The transgene mCherry directed by sp7 marks osteoblasts. bs: basibranchial; ch: ceratohyal; ep: ethmoid plate; f: frontal bone; le: lateral ethmoid; mk: Meckel’s cartilage; op: opercle; so: supraorbital. Scale bars are 100 μm in A–E, H–J, and 25 μm in F and G.
Figure 3
Figure 3
−707BMPER directs egfp expression to developing craniofacial bones and cartilage in zebrafish. (A) Ventral view of two 5dpf zebrafish mosaic for −707BMPER: egfp expression, showing enhancer activity in early chondrocytes of the skulls. The −707BMPER contains the reference allele of CS-associated SNP rs10254116. (B–D) Ventral view of 5dpf larvae from two independent transgenic lines of Tg (−707BMPER: egfp; sp7: mcherry) zebrafish showing different expression patterns of the transgene. (B–C) In the −707BMPER(c): egfp line, the enhancer is primarily active in early chondrocytes, with sp7:mcherry expressed in osteoblasts; (D) In the −707BMPER(pc): egfp line, the expression is prominent in perichondral cells. (E–L) Compressed Z stacks from confocal imaging of two −707BMPER transgenic lines during frontal bone initiation (5–6 mm SL) and rapid expansion (6–7 mm SL). (E–H) Dorsal view of the enhancer activity of a transgenic animal Tg (−707BMPER (c3): egfp; sp7: mCherry). The enhancer activity was prominent in the chondrocytes of tmp but also visible in osteoblasts of the frontal bone. (I–L) Dorsal view of the enhancer activity of a transgenic fish Tg (−707BMPER (pc): egfp; sp7: mCherry). The enhancer was active at the perichondrium of taenia marginalis posterior (tmp) next to the initiation site of the frontal bone. (M–O) Compressed Z stacks from confocal imaging of a transgenic line expressing −707BMPER containing the minor allele of rs10254116, Tg (−707BMPER_minor (c2): egfp; sp7: mCherry). The enhancer was active at the chondrocytes of tmp during frontal bone development. ch: ceratohyal; f: frontal bone; mk: Meckel’s cartilage; pq: palatoquadrate; tmp: taenia marginalis posterior. Scale bars are 50 μm.
Figure 4
Figure 4
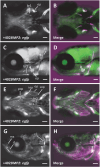
+402BMP2 directs egfp expression to developing craniofacial bones. (A–D) Ventral and lateral view of a 5dpf transgenic Tg (+402BMP2: egfp; sp7: mcherry) zebrafish. (B, D) Overlap is shown with osteoblast marker sp7: mcherry. Enhancer is active in early craniofacial osteoblasts. (E–H) Ventral and lateral view of Tg (+402BMP2: egfp; sp7: mcherry) animal at 6.27 mm SL (14dpf). Enhancer is active around the edge of many developing cranial bones, consistent with early osteoblasts. br 1–3: branchiostegal ray 1–3; cl: cleithrum; d: dentary; iop: interopercle; mx: maxilla; op: opercle; pop: preopercle; sop: subopercle. Scale bars are 100 μm in A–D and 300 μm in E–H.
Figure 5
Figure 5
Identification of interacting TFs via eY1H assays and differential enhancer activities between reference and alternate alleles. The scale indicates the summed strength of TF-bait interactions from two strains of yeasts: very strong (VS), strong (S), medium (M), weak (W). Only interactions positive in both strains of yeasts are demonstrated in the matrices. Quantification of strengths and interactions positive in one strain of yeast are included in Supplementary Table S5. (A) TFs that interacted with full-length enhancers in eY1H assays. (B) TFs that interacted with 40 bp-sequences around CS-associating SNPs. GCM1 showed up positive in both eY1H assay and CIS-BP differential binding prediction, whereas GCM2 from the same family only did by CIS-BP.

References

    1. Chen G, Deng C, Li Y-P. TGF-β and BMP signaling in osteoblast differentiation and bone formation. Int J Biol Sci 2012;8:272–88. - PMC - PubMed
    1. Bandyopadhyay A, Yadav PS, Prashar P. BMP signaling in development and diseases: a pharmacological perspective. Biochem Pharmacol 2013;85:857–64. - PubMed
    1. Flaherty K, Singh N, Richtsmeier JT. Understanding craniosynostosis as a growth disorder. Wiley Interdiscip Rev Dev Biol 2016;5:429–59. - PMC - PubMed
    1. Justice CM, Yagnik G, Kim Y. et al. A genome-wide association study identifies susceptibility loci for nonsyndromic sagittal craniosynostosis near BMP2 and within BBS9. Nat Genet 2012;44:1360–4. - PMC - PubMed
    1. Veleri S, Bishop K, Nogare DED. et al. Knockdown of Bardet-Biedl syndrome gene BBS9/PTHB1 leads to cilia defects. PLoS One 2012;7:e34389. - PMC - PubMed

Publication types

Substances

LinkOut - more resources