. 2023 Oct 27;382(6669):417-423.
doi: 10.1126/science.adf0460. Epub 2023 Oct 26.

Cross-modal representation of identity in the primate hippocampus

Affiliations

Cross-modal representation of identity in the primate hippocampus

Timothy J Tyree et al. Science. .

Abstract

Faces and voices are the dominant social signals used to recognize individuals among primates. Yet, it is not known how these signals are integrated into a cross-modal representation of individual identity in the primate brain. We discovered that, although single neurons in the marmoset hippocampus exhibited selective responses when presented with the face or voice of a specific individual, a parallel mechanism for representing the cross-modal identities for multiple individuals was evident within single neurons and at the population level. Manifold projections likewise showed the separability of individuals as well as clustering for others' families, which suggests that multiple learned social categories are encoded as related dimensions of identity in the hippocampus. Neural representations of identity in the hippocampus are thus both modality independent and reflect the primate social network.


Conflict of interest statement

The authors declare no competing interests.

Figures
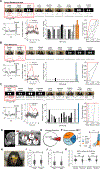
fig. 1.
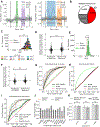
fig. 1.. Putative ‘concept cells’ in marmoset hippocampus.
[a-c] Top row: subset of stimuli shown above raster and PSTH. Bottom row: spike waveform density; normalized PSTH to all stimuli (preferred: red, nonpreferred: black), indicated are time points that show significant difference (p<0.05); median number of spikes for unimodal stimuli (grey/black indicate non-preferred individuals; ROC curve (shuffled controls shown in black). Exemplar identity neurons responding selectively to [a] the face and voice of a preferred conspecific (red), [b] the face only, and [c] the voice only. [d] Anatomical distribution of identity neurons (red) in hippocampal subfields relative to neurons remaining that responded to any stimulus (white). Black shadow indicates the electrode array track with MRI distortion artifact. [e] Pie chart showing the abundance of identity neurons in red with the number of remaining neurons that qualified for the ROC selectivity analysis in white. [f] Mode distribution of identity neurons. Modes included face (light blue), voice (dark blue), and both (orange). [g] Histogram showing the distribution of areas under ROC curves comparable to red ROC curves in [a-c]. Colors are as in [f]. Black dotted line is the mean, while red dotted line is the mean of 10,000 random shuffles of the labels. [h] Exemplar eye-movements (yellow) with fixations indicated (red). [i] Distribution of eye fixation durations for unimodal trials. [j] Distribution of apparent saccade number for unimodal trials. [k] Distribution of median firing rates while observer was looking at eyes (left) and face (right) for identity neurons (black) versus remaining neurons (white). Three asterisks indicate a significant median difference (p<0.001).
fig. 2.
fig. 2.. Single neurons in hippocampus represent multiple individuals.
[a,b] The PSTH normalized by the pre-stimulus baseline (top) and spike raster (bottom) for two exemplar MvMM neurons. Black indicates match and red indicates mismatch trials. Vertical line indicates stimulus onset. Inset shows spike waveform density. Asterisk indicates significant time points (p<0.05). Exemplar neuron with higher firing rate for [a] match and [b] mismatch trials. [c] Pie chart showing the number of neurons that responded significantly more for match (black) or mismatch (red) trials. [d] Venn diagram showing the number of MvMM neurons (black) in common with identity neurons (red). [e] Relative abundance of MvMM neurons in each hippocampal subfield. [f] Distribution of median firing rate while looking at the eyes (left) and face (right) for MvMM neurons (black) versus remaining neurons (white). [g] Probability density of saccadic eye movements directed towards the eyes for match (black) and mismatch (red) trials. Indicated are the time points in [h]. [h] Distribution of apparent number of saccades to eyes. Asterisk indicates significant median difference (p<0.05).
fig. 3
fig. 3. Cross-modal decoding of identity.
[a] PSTH of two exemplar predictive neurons. Colored traces average over trials involving preferred individual while the gray shaded regions indicate 95% confidence intervals. Colored regions indicate identity-specific time bins. [b] Pie chart showing number of identity-specific predictive neurons that prefer one (white), two (gray), and three or more individuals (red). [c] Histogram showing AUC distribution of identity-specific time bins with colors indicating preferred individuals in legend. Dotted lines indicate the mean (black) and the control (red). [d] Distribution of median firing rates while the observer was looking at the face for the identity-specific predictive neurons compared to the remaining neurons. [e] Histogram showing AUC distribution of MvMM time bins. Dashed lines indicate the mean (black) and the control (red). [f] Distribution of median firing rates while the observer was looking at the face for the MvMM predictive neurons compared to the remaining neurons. [g] ROC curves for the detection of face or voice of individuals. Firing rates were considered from MvMM time bins (green, AUC=0.536) and identity-specific time bins (black, AUC=0.779) similarly averaged over individuals. Thinner colored lines indicate individuals as in [c]. [h] ROC curves for the detection of match trials. Firing rates from MvMM time bins (green, AUC=0.782) and from identity-specific time bins (black, AUC=0.516). [i] ROC curves for the detection of both face and voice of individuals from same 19 recording sessions as in [g,h]. Firing rates from MvMM time bins (green, AUC=0.615), identity-specific time bins (black, AUC=0.622), and the INM (gray, AUC=0.818), similarly averaged over individuals. Results of the INM for individuals are shown by thin lines colored as in the legend of [c]. Red dotted line indicates random as in [g,h]. [j] Bar plot showing true positive rates predicted by a winner-take-all model that considered predictions from the INM specific to twelve individuals. Indicated is the mean of the shuffled labels (red) and 5´ that value (black). Bar plots summarize the trials from the testing sets of 33 recording sessions (Ntrials=454). [k] Bar plot showing mean AUC with identity neurons removed (light gray) versus the control randomly removing an equal number of bins from the remaining cells (dark gray). Uncertainty indicates 95% confidence of the mean. No significant difference was observed across recording sessions for any of the three qualifying subjects (Archie, p=0.81, Nidentities=14; Baloo, p=0.58, Nidentities=9; Hades, p=0.50, Nidentities=12). Three asterisks indicate statistical significance (p<0.001).
fig. 4
fig. 4. Cross-modal representation of identity using rate and event codes.
[a] Two-dimensional manifold projection of our rate-coded representation computed from firing rates of identity-specific time bins. One identity match trial was equivalent to one presentation of the stimulus as face and voice matched. Each identity match trial represented a different, randomly selected face and/or voice stimulus. Firing rates were computed from each identity-specific predictive time bins and then concatenated into a feature vector for each identity-match trial. This feature vector was then projected onto the manifold and plotted as one symbol per identity-match trial in one of the scatter plots. Indicated is the mean (black). Colors in legend correspond to individuals. [b] Schematic illustrating the hindsight delay to a given neuron (left), used to generate histograms of signed connection rates to three neurons (right). [c] Two-dimensional manifold projection of our event-coded representation of identity computed as the manifold projection of signed connection rates of all neurons in the same exemplar recording session. One symbol represents one spike. Indicated is the mean (black). [d] Boxplots of MSR showing significantly different values when subjects observed family of other subjects. Shown is Archie observing family of Hades (top left, p<0.001, Nidentities≥23) and Buck observing family of Hades (top right, p=0.003, Nidentities≥26), Archie observing family of Baloo (bottom left, p=0.017, Nidentities≥30), and Buck observing family of Baloo (bottom right, p=0.828, Nidentities≥37). Significance was computed according to Student’s t-test. [e] Latent activity averaged over all recording sessions from subjects Archie (left) and Buck (right). Colors indicate average over the family of Baloo (blue) and Hades (orange) relative to all conspecifics (gray). Shaded regions indicate 95% confidence of the mean estimated via bootstrap. [f] Graph of connections bundled between individuals. Triangles in legend indicate family members as in [a,c].

References

    1. Seyfarth RM, Cheney DL, “Knowledge of Social Relations” in The Evolution of Primate Societies, Mitani J, Call J, Kappeler PM, Palombit R, Silk JB, Eds. (University of Chicago Press, Chicago, IL, 2012), pp. 629–642.
    1. Perrodin C, Kayser C, Logothetis NK, Petkov C, Voice cells in primate temporal lobe. Curr. Biol. 21, 1408–1415 (2011). - PMC - PubMed
    1. Belin P, Bodin C, Aglieri V, A “voice patch” system in the primate brain for processing vocal information? Hear. Res. 366, 65–74 (2018). - PubMed
    1. Sliwa J, Planté A, Duhamel J-R, Wirth S, Independent Neuronal Representation of Facial and Vocal Identity in the Monkey Hippocampus and Inferotemporal Cortex. Cereb. Cortex. 26, 950–966 (2016). - PubMed
    1. Rutishauser U, et al. Single-unit responses selective for whole faces in the human amygdala. Curr. Biol. 21, 1654–1660 (2011). - PMC - PubMed