. 2023 Nov:67:102932.
doi: 10.1016/j.redox.2023.102932. Epub 2023 Oct 17.

Defective function of α-ketoglutarate dehydrogenase exacerbates mitochondrial ATP deficits during complex I deficiency

Affiliations

Defective function of α-ketoglutarate dehydrogenase exacerbates mitochondrial ATP deficits during complex I deficiency

Gerardo G Piroli et al. Redox Biol. 2023 Nov.

Abstract

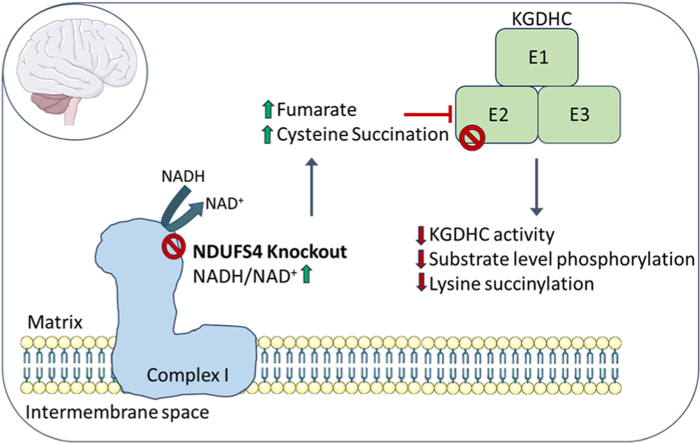
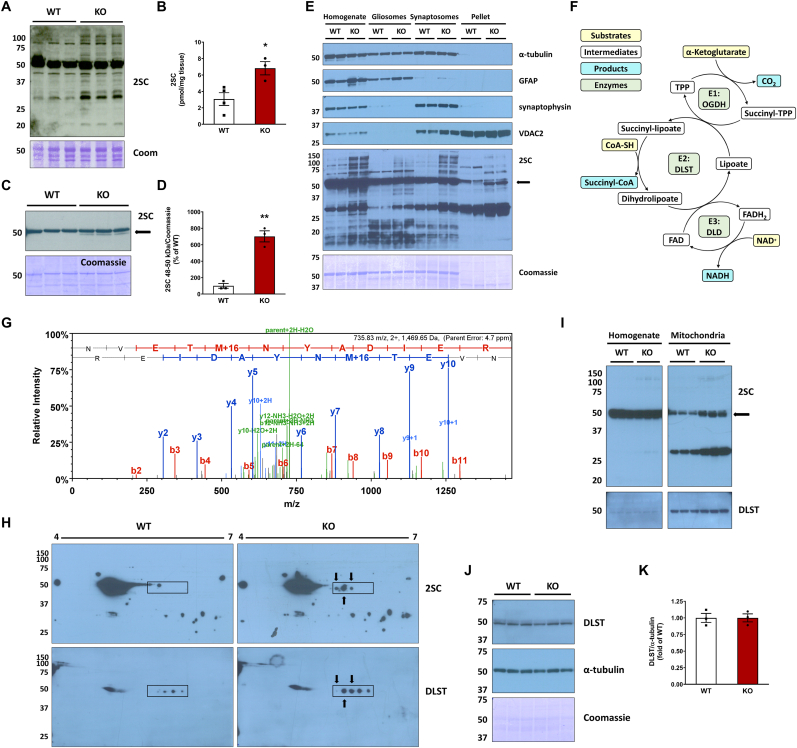
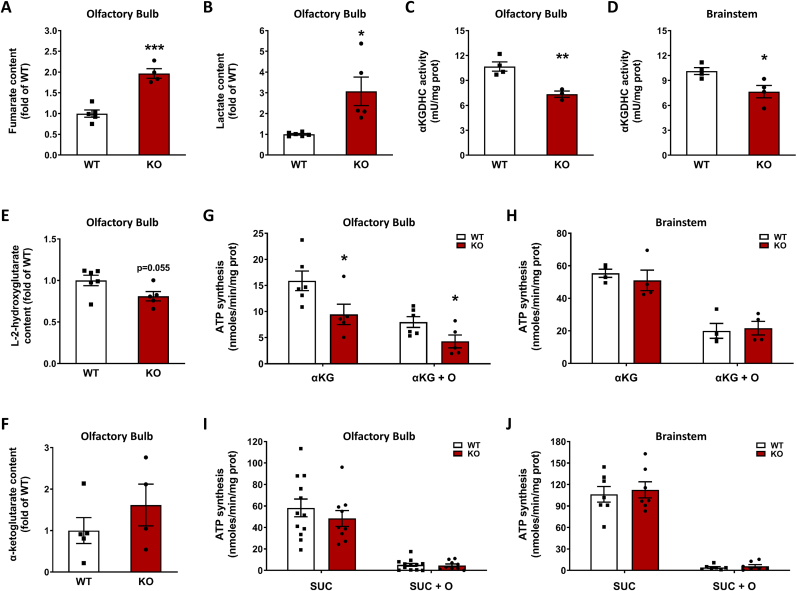
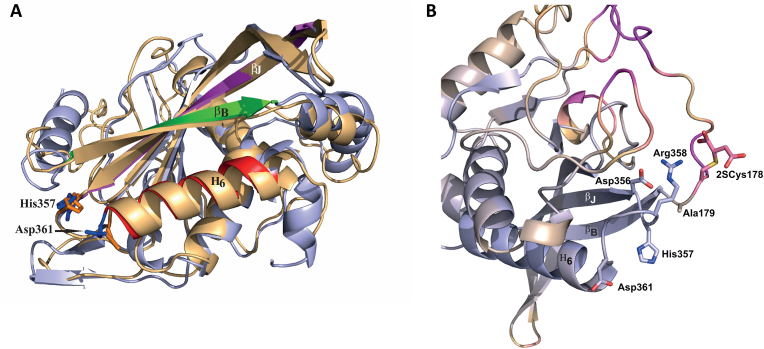
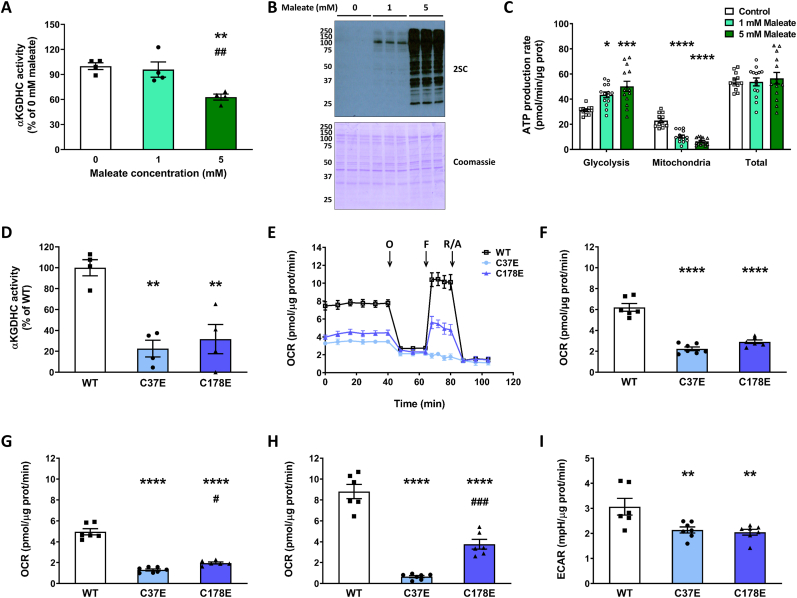
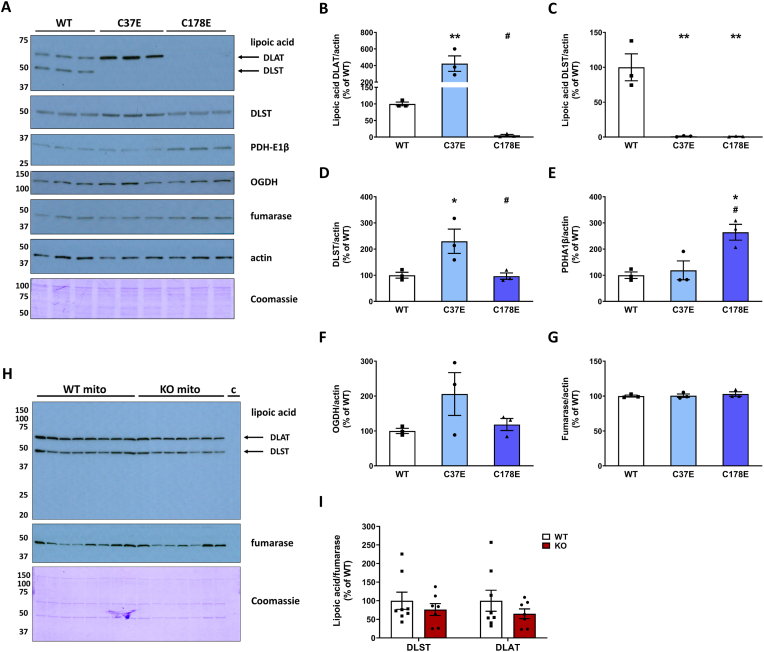
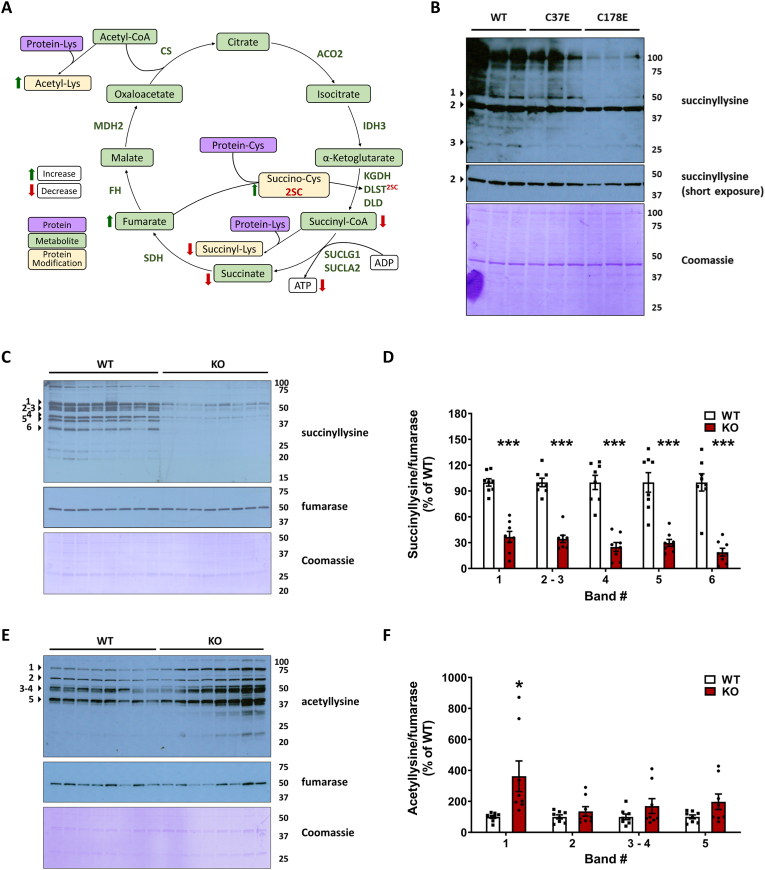
The NDUFS4 knockout (KO) mouse phenotype resembles the human Complex I deficiency Leigh Syndrome. The irreversible succination of protein thiols by fumarate is increased in select regions of the NDUFS4 KO brain affected by neurodegeneration. We report that dihydrolipoyllysine-residue succinyltransferase (DLST), a component of the α-ketoglutarate dehydrogenase complex (KGDHC) of the tricarboxylic acid (TCA) cycle, is succinated in the affected regions of the NDUFS4 KO brain. Succination of DLST reduced KGDHC activity in the brainstem (BS) and olfactory bulb (OB) of KO mice. The defective production of KGDHC derived succinyl-CoA resulted in decreased mitochondrial substrate level phosphorylation (SLP), further aggravating the existing oxidative phosphorylation (OXPHOS) ATP deficit. Protein succinylation, an acylation modification that requires succinyl-CoA, was reduced in the KO mice. Modeling succination of a cysteine in the spatial vicinity of the DLST active site or introduction of succinomimetic mutations recapitulates these metabolic deficits. Our data demonstrate that the biochemical deficit extends beyond impaired Complex I assembly and OXPHOS deficiency, functionally impairing select components of the TCA cycle to drive metabolic perturbations in affected neurons.

Keywords: Alpha-ketoglutarate dehydrogenase; Complex I; Fumarate; Leigh syndrome; Protein succination; Substrate level phosphorylation.


Conflict of interest statement

Declaration of competing interest None.

Figures

Image 1
Graphical abstract
Fig. 1
Fig. 1
Identification of dihydrolipoyllysine-residue succinyltransferase (DLST) succination in the brainstem (BS) of the Ndufs4 KO mouse.A, Total levels of protein succination (2SC) in brainstem (BS) homogenates from WT and Ndufs4 KO mice, note the abundance of succinated tubulin in WT and KO at ∼50 kDa. Ndufs4 KO BS show enrichment of several additional succinated proteins vs. WT mice (representative blot, n = 3/group). B, LC-MS/MS quantification of total 2SC levels in WT and Ndufs4 KO brainstem (n = 3–4/group). C, Detection and D, densitometric quantification of a distinct succinated band at ∼48–50 kDa (arrow) in Ndufs4 KO BS following cytosolic tubulin depletion (n = 3). E, Characterization of the purity of total tissue protein homogenates, gliosomes, synaptosomes, and a mitochondria-rich pellet fraction obtained from BS by analysis of α-tubulin, GFAP, synaptophysin and VDAC2 expression. In the 2SC panel, a ∼48–50 kDa succinated band is present in the pellet fractions (2SC panel, KO lanes, arrow). F, Structure and function of the α-ketoglutarate dehydrogenase complex (KGDHC). For each subunit the substrates are highlighted in yellow, intermediates/cofactors in white and products in light blue and the enzymatic components of the complex in light green. G, MS/MS spectrum of the peptide NVETMoxNYADIER corresponding to DLST in a ∼48–50 kDa band isolated from the mitochondria-rich pellets used in C. H, Co-localization (arrows) of succinated spots with DLST-immunoreactive spots in the region of ∼48–50 kDa and pH 5.5–6.3 (rectangular area) in Ndufs4 KO BS. I, Analysis of BS tissue homogenates, where tubulin precludes DLST detection, alongside purified mitochondrial fractions showing a succinated band at ∼48–50 kDa in KO lanes (2SC panel, arrow), which overlapped with DLST detection. J, Total DLST and α-tubulin content in BS homogenates of WT and Ndufs4 KO mice. K, Quantification of the DLST band intensity in J (n = 3/group). See also Fig. S1.In A, C, and E, H, I, J molecular weight markers are shown on the left side. Coomassie staining was used to verify even load of the lanes. In B, D, K, results expressed as mean ± SEM were compared by unpaired t-test (*P < 0.05, **P < 0.01). (For interpretation of the references to color in this figure legend, the reader is referred to the Web version of this article.)
Fig. 2
Fig. 2
α-ketoglutarate dehydrogenase complex (KGDHC) activity is reduced as a consequence of fumarate derived protein succination.A-B, Quantification of fumarate (A, n = 4–5) and lactate (B, n = 5–6) content in the olfactory bulb of Ndufs4 KO and WT mice. C-D, KGDHC activity in the olfactory bulb (C, n = 4) and brainstem (D, (n = 3–4) of Ndufs4 KO and WT mice. E-F, Quantification of L-2-hydroxyglutarate (E, n = 5–6) and α-ketoglutarate (F, n = 4–5) content in the olfactory bulb of Ndufs4 KO and WT mice. G-H, Mitochondrial total ATP synthesis (no oligomycin) and substrate level phosphorylation (SLP, +8 μM oligomycin = O) in the olfactory bulb (G, n = 5–6) and the brainstem (H, n = 4) in the presence of 5 mM α-ketoglutarate (αKG) as respiratory substrate. I-J, Same as in G-H but using 5 mM succinate (SUC) as respiratory substrate (n = 7–12).In panels A-J, results expressed as mean ± SEM, and comparisons performed by unpaired t-test (*p < 0.05, **p < 0.01 and ***p < 0.001 vs. WT).
Fig. 3
Fig. 3
A, Superimposition of the succinated Cys178 (2SCys178) form of human DLST (hDLST) in orange and the unmodified hDLST in blue. Red, green, and purple colors in the unmodified form indicate the secondary structural elements that form the two substrate channels. B, The catalytic center of hDLST and its immediate spatial vicinity in the succinated (2SCys178) form, showing the degree of displacement relative to the unmodified structure. Blue color represents displacement <0.5 Å and purple indicates displacement >6.5 Å. (For interpretation of the references to color in this figure legend, the reader is referred to the Web version of this article.)
Fig. 4
Fig. 4
Maleate treatment and succinomimetic mutation of DLST reduce the activity of the KGDHC.A-C, KGDHC activity (A, n = 4), protein succination (B), and ATP production rate linked to glycolysis and mitochondrial function (C) in DLST KO H838 cells expressing WT hDLST, after treatment for 16 h with 0–5 mM maleate (n = 12). D, KGDHC activity in DLST KO H838 cells expressing WT hDLST or hDLST forms where Cys37 or Cys178 were mutated to Glu to mimic succination (n = 4). E, Respiratory profile of the cells described in (D). The oxygen consumption rate (OCR) was measured using a Seahorse XF analyzer, in basal conditions and after sequential injection of oligomycin (O), FCCP (F), and rotenone/antimycin A as described in Methods. F–H, Basal respiration (F), oxygen consumption coupled to ATP production (G), and maximal respiration (H), in the experiment described in (E). I, Extracellular acidification rate (ECAR) after oligomycin injection in the experiment described in (E), n = 6/group.In panels A, C, D, and F–I, data expressed as mean ± SEM and comparisons by one-way ANOVA and post hoc Student-Neuman-Keuls test (A and C, *p < 0.05, **p < 0.01, ***p < 0.001, and ****p < 0.0001 for 1 mM and 5 mM maleate vs. 0 mM maleate, and ##p < 0.01 for 5 mM maleate vs. 1 mM maleate; D, and F–I, **p < 0.01, and ****p < 0.0001 for mutants vs. WT, and #p < 0.05 and ###p < 0.001 for C178E vs. C37E). In panel B, the molecular weight markers are shown on the left side.
Fig. 5
Fig. 5
A, Detection of lipoic acid and mitochondrial markers (DLST, PDH-E1β, OGDH and fumarase) in the DLST KO H838 cells expressing WT hDLST, DLST Cys37Glu or DLST Cys178Glu (n = 3/group). Actin and Coomassie staining were used to verify even loading of the gel. B-G, Densitometric quantification of the mitochondrial markers shown in A relative to cytosolic protein levels (actin). H, Detection of lipoic acid moieties associated with DLST and DLAT (dihydrolipoyllysine-residue acetyltransferase, a subunit of the pyruvate dehydrogenase complex) in the BS of WT and Ndufs4 KO mice (n = 7–8). In addition to the mitochondrial fractions (“mito”), a lane with a cytosolic fraction (“c”) was included as a negative control. I, Normalization of the signal intensity in H, relative to fumarase to account for mitochondrial protein levels. Normalization to Coomassie did not alter the lipoylation status (not shown). In panel A and H, molecular weight markers are shown on the left side.
Fig. 6
Fig. 6
DLST succination and mutations that mimic DLST succination alter the levels of protein acylation in vivo and in vitro.A, Schematic illustrating TCA cycle deficits in the Ndufs4 KO mouse. Red arrows indicate a measured decrease and green arrows indicate a measured increase. The metabolic impact of a 2-fold increase in fumarate (P < 0.001) contributes to a 2-fold increase in protein succination (P < 0.05). The specific succination of DLST (DLST2SC) contributes to a 25–30 % decrease in KGDHC activity (P < 0.001), and results in lower ATP via a 48 % reduction in SUCLA activity (P < 0.05), decreased lysine succinylation (hyposuccinylation), and a 50 % reduction in succinate levels (P < 0.001). Lysine acetylation of select proteins increases as a consequence of diminished TCA cycle function. These metabolic perturbations impacting the TCA cycle alter the chemical modification of proteins, extending the biochemical deficit beyond the loss of the Complex I component Ndufs4. Relationships between metabolites (green boxes), protein lysine or cysteine residues (purple boxes) and protein modifications (yellow boxes) are indicated. B, Protein lysine succinylation in mitochondrial fractions obtained from DLST KO H838 cells expressing WT hDLST, C37E or C178E hDLST succinomimetic mutants. C, Protein lysine succinylation in mitochondrial fractions obtained from the brainstem of WT and Ndufs4 KO mice. D, Quantification of prominent bands in C (indicated by arrowheads). E, Protein lysine acetylation in mitochondrial fractions obtained from brainstem of WT and Ndufs4 KO mice. F, Quantification of prominent bands in E (indicated by arrowheads).In B, Coomassie Brilliant Blue staining (prominent band at 42 kDa) was used for the normalization of the succinyllysine signal. In C and E, re-probing to detect fumarase was used for mitochondrial protein normalization, followed by Coomassie Brilliant Blue staining. Molecular weight markers are shown on the right side. See also Fig. S4. In D and F, results expressed as mean ± SEM were compared by unpaired t-test (*p < 0.05 and ***p < 0.001 vs. WT). (For interpretation of the references to color in this figure legend, the reader is referred to the Web version of this article.)

References

    1. Lake N.J., Compton A.G., Rahman S., Thorburn D.R. Leigh syndrome: one disorder, more than 75 monogenic causes. Ann. Neurol. 2016;79:190–203. - PubMed
    1. Calvaruso M.A., Willems P., van den Brand M., Valsecchi F., Kruse S., Palmiter R., Smeitink J., Nijtmans L. Mitochondrial complex III stabilizes complex I in the absence of NDUFS4 to provide partial activity. Hum. Mol. Genet. 2011;21:115–120. - PubMed
    1. Ortigoza-Escobar J.D., Oyarzabal A., Montero R., Artuch R., Jou C., Jiménez C., Gort L., Briones P., Muchart J., López-Gallardo E., et al. Ndufs4 related Leigh syndrome: a case report and review of the literature. Mitochondrion. 2016;28:73–78. - PubMed
    1. Kruse S.E., Watt W.C., Marcinek D.J., Kapur R.P., Schenkman K.A., Palmiter R.D. Mice with mitochondrial complex I deficiency develop a fatal encephalomyopathy. Cell Metabol. 2008;7:312–320. - PMC - PubMed
    1. Quintana A., Kruse S.E., Kapur R.P., Sanz E., Palmiter R.D. Complex I deficiency due to loss of Ndufs4 in the brain results in progressive encephalopathy resembling Leigh syndrome. Proc. Natl. Acad. Sci. U.S.A. 2010;107:10996–11001. - PMC - PubMed

Publication types

Substances